Expert C# 5.0: with .NET 4.5 Framework (2013)
CHAPTER 15
![]()
Diagnostic Tools in .NET
This chapter will discuss the different debugging tools used in the .NET Framework to analyze an application and its performance and to explore the source code of the application. This chapter will explore the use of many debugging tools for applications written in .NET, such as Windbg, ILDasm, .NET Reflector, and CLR Profiler.
These tools are discussed to show you how to analyze the memory, stack, and Heap, which were discussed in this book, in relation to the different features of C# language.
Windbg and Son of Strike Debugging Extension DLL
Windbg is a debugging tool that is used for user and kernel mode debugging. This tool comes from Microsoft as part of the Windows Driver Kit (WDK). Windbg is a GUI built in the Console Debugger (CDB), NT Symbolic Debugger (NTSD), and Kernel Debugger (KD) along with debugging extensions. The Son of Strike (SOS) debugging extension DLL (Dynamic Link Library) helps to debug managed assembly by providing information about the internal operation of the CLR environment. Windbg is a powerful tool that can be used to:
· Debug managed assembly by allowing you to set a breakpoint
· View source code using symbol files
· View stack trace information
· View Heap information
· Examine the parameters of a method, memory, and registers
· Examine the exception handling information
Let’s see how to download and install the Windbg.
Download and Installation
Windbg comes as part of the Windows debugging tools; it is free and available for download at http://msdn.microsoft.com/en-us/windows/hardware/gg463009.aspx. Once you have downloaded and installed the installation package, open the windbg.exe from the installed directory. When you open it, it will look much like the screenshot in Figure 15-1.
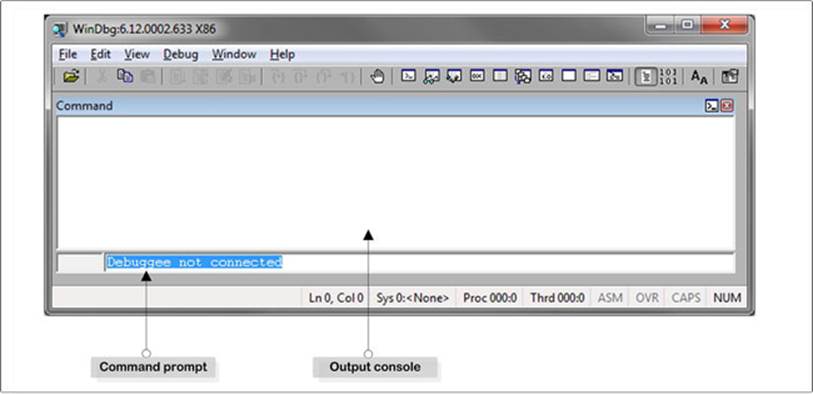
Figure 15-1. The windbg.exe tool
Figure 15-1 demonstrates that the Command prompt section is used to write the command for Windbg to execute, and in the output console section, you can see the output generated from the executed command. When you install the Windbg, it is not ready to use right away. It requires a few other steps to make it ready to debug the managed assembly. One of the first steps is to set up the symbol path, and the second is to ensure you are using the right version of the SOS debugging extension DLL, which we will explore further in the following sections.
Setting Up the Symbol Path
The symbol file contains a variety of data that can be used in the debugging process. The symbol file might contain:
· Global variables
· Local variables
· Function names and the addresses of their entry points
· Frame pointer omission (FPO) records
· Source line numbers
When the debugger tool, such as Windbg, has to have access to the related symbol files, it requires you to set the symbol file location. Microsoft has provided a symbol server for that purpose, so it is good to point the debugger to that symbol server. In Windbg, in order to point to that symbol server, you use the srv command along with the local cached folder (where the symbol files will be downloaded) and the server location from which the symbol files will be downloaded. It is just as easy to use the symbol server through the srv command as it is to use the appropriate syntax in your symbol path. Typically, the syntax takes the following format:
SRV*your local cached folder*http://msdl.microsoft.com/download/symbols
In your local cached folder, there is a drive or shared drive that can be used as the symbol destination. For example, to set the symbol path in the Windbg, type the following command in the command window of the debugger:
.sympath SRV*C:\symbols*http://msdl.microsoft.com/download/symbols
Alternatively, you can set the symbol path location via the Symbol File Path under the File menu of the Windbg, as demonstrated in Figure 15-2.
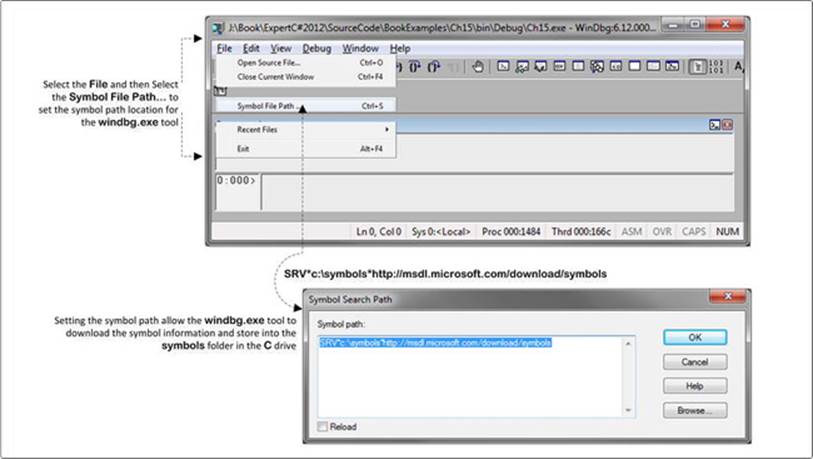
Figure 15-2. The windbg.exe tool
Figure 15-2 shows that in the Symbol Search Path window, the symbol path location has been set as:
SRV*c:\symbols*http://msdl.microsoft.com/download/symbols
Here c:\symbols refers to the local cached folder in where the symbol file will be downloaded, the location being specified as http://msdl.microsoft.com/download/symbols.
Another important step requires that you finish the Windbg set up using the correct version of the SOS debugging extension DLL. This will be explored in the following section.
Son of Strike Debugging Extension DLL
The SOS debugging extension DLL helps you to debug a managed assembly. When using SOS, you will be able to:
· Display managed call stacks
· Set breakpoints in managed code
· Find the values of local variables
· Dump the arguments to method calls
· Perform most of the inspection and control debugging actions that you can use in native-code debugging without the convenience of source-level debugging
When the SOS is used with the Windbg tool, it requires that you to use the correct version of it. The next section will explain how to set that version of the SOS.dll extension while debugging an executable.
Loading SOS Debugging Extension DLL in Windbg
To load the SOS debugging extension DLL into Windbg, you need to first load a managed assembly. The executable from Listing 15-1 can be used to do this.
Listing 15-1. An Example Program
using System;
namespace Ch15
{
class Program
{
static void Main(string[] args)
{
Person aPerson = new Person()
{
Name = "A"
};
aPerson.ShowDetails();
}
}
public class Person
{
public string Name { get; set; }
public void ShowDetails()
{
Console.WriteLine(Name);
}
}
}
Listing 15-1 produced the output:
A
The executable produced from Listing 15-1 needs to load into the Windbg. Figure 15-3 demonstrates how to do this. Let’s open the executable produced from Listing 15-1 in the Windbg, as shown in Figure 15-3.
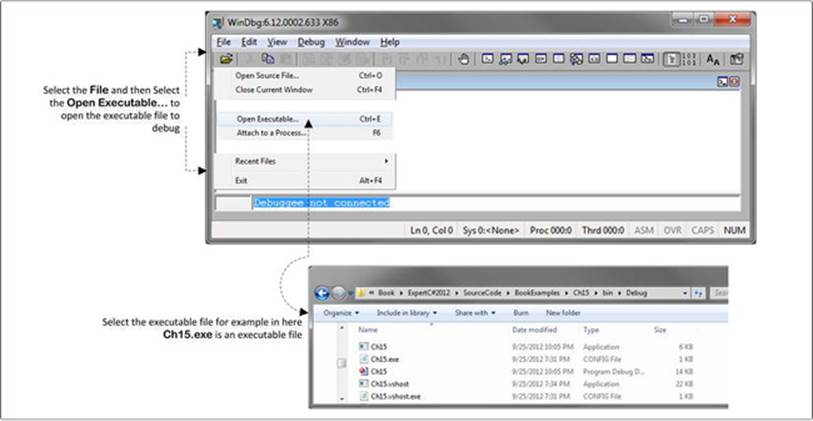
Figure 15-3. Using the windbg.exe tool
Figure 15-3 demonstrates that Open Executable… under the File menu produces a dialog window from which you can choose the location of the executable file produced from Listing 15-1 and select it. The Windbg tool is now ready to load the SOS debugging extension DLL.
The following commands (executing g command might throw an exception but please ignore it) need to be run to load the SOS.dll, which will initiate the debugging environment in Windbg:
sxe ld clrjit
g
.loadby sos clr
.load sos.dll
The .load sos.dll command is used to load the SOS, but if Windbg cannot find the right version of the SOS, it throws an exception.
In .NET, every version of the CLR has its own copy of the SOS extension DLL. You must always load the correct version of the SOS that comes with the CLR. To load this version of the SOS, you need to use the full path of the SOS (installed in your system) using the .load command. The path syntax is:
.load <full path to sos.dll>
Or you can use:
.load %windir%\Microsoft.NET\Framework\<version>\sos.dll
For example, if the SOS that is installed in the directory is C:\Windows\Microsoft.NET\Framework\v4.0.30319\, you might need to execute the command:
.load C:\Windows\Microsoft.NET\Framework\v4.0.30319\sos.dll
The complete list of the commands would be:
sxe ld clrjit
g
.loadby sos clr
.load C:\Windows\Microsoft.NET\Framework\v4.0.30319\sos.dll
Figure 15-4 demonstrates that the SOS is loaded in the Windbg.
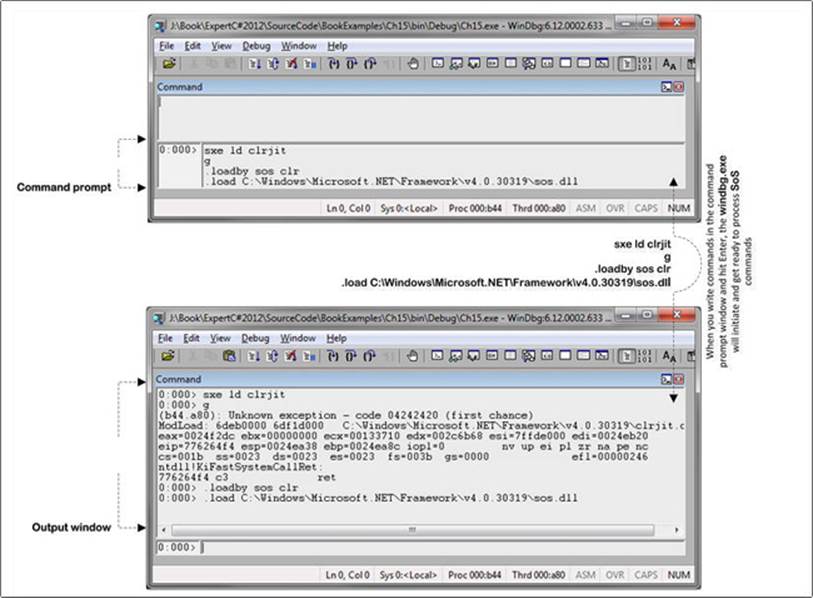
Figure 15-4. SOS debugging extension DLL loading in the Windbg tool
The Windbg tool is now able to execute the SOS commands to debug the loaded Ch15.exe executable. In the following section, you will use different test cases to explore the power of the SOS commands and get an idea of how to debug the managed assembly in the Windbg along with SOS debugging extension DLL.
Use of the SOS Debugging Extension DLL in Windbg
The following section will explore different scenarios to show how different SOS commands can be used to debug the managed assembly using the Windbg.
Type Information Using name2ee
If you want to explore the type information, such as the address of the MethodTable of an object or the address of the EEClass of a loaded module, you can use the name2ee command. The name2ee command takes a module and type name as input and displays the relevant information about the given type as output.
Before you do anything, load the type information to set a breakpoint:
!bpmd Ch15.exe Ch15.Person.ShowDetails
Then execute the command:
g
Then execute the following command, which takes Ch15.exe as the module name and Ch15.Person as the type name. This command is executed against the loaded executable from Listing 15-1:
!name2ee Ch15.exe Ch15.Person
When the name2ee command has successfully executed, it will produce the following output (throughout the chapter, the output might vary when you run a command locally):
Module: 00232e94
Assembly: Ch15.exe
Token: 02000003
MethodTable: 002337bc /* later used in the dumpmt command */
EEClass: 002312d8
Name: Ch15.Person
The output shows information about the MethodTable of the Person type that contains information about all of the methods in the Person class. You can use the address of the MethodTable to explore the methods information of the Person class. Later we will learn how to use the dumpmt command to do that.
The name2ee command can also be useful to explore information about a method of a type, for example, if you execute the following command to explore the ShowDetails method of the Person class:
!name2ee Ch15.exe Ch15.Person.ShowDetails
This will produce the output:
Module: 00232e94
Assembly: Ch15.exe
Token: 06000005
MethodDesc: 0023379c
Name: Ch15.Person.ShowDetails()
JITTED Code Address: 004f0148 /* Later used to explore the native code */
The output contains important information, for example, the MethodDesc address 0023379c, which can be used to explore more details about the method if you execute the command:
!dumpmd 0023379c
It will produce output that shows the details about the ShowDetails method:
Method Name: Ch15.Person.ShowDetails()
Class: 002312d8
MethodTable: 002337bc
mdToken: 06000005
Module: 00232e94
IsJitted: yes
CodeAddr: 004f0148
Transparency: Critical
You can use the MethodDesc address to see the IL code of the ShowDetails method. The dumpil command with the MethodDesc address will display the IL code of the specified method.
Let’s execute the dumpil command as shown:
!dumpil 0023379c
This will produce the IL version of the ShowDetails method:
ilAddr = 00f720a4
IL_0000: nop
IL_0001: ldarg.0
IL_0002: call Ch15.Person::get_Name
IL_0007: call System.Console::WriteLine
IL_000c: nop
IL_000d: ret
The Jitted code address (from the output of name2ee Ch15.exe Ch15.Person.ShowDetails) can be used to explore the native code for the method that has Jitted using the u command. For example:
/* 004f0148 refers the JITTED Code Address extracted
* when explore the ShowDetails method using the name2ee */
!u 004f0148
It produces the output:
Normal JIT generated code
Ch15.Person.ShowDetails()
Begin 004f0148, size 37
j:\Book\ExpertC#2012\SourceCode\BookExamples\Ch15\Program.cs @ 28:
>>> 004f0148 55 push ebp
004f0149 8bec mov ebp,esp
004f014b 83ec08 sub esp,8
004f014e 33c0 xor eax,eax
004f0150 8945f8 mov dword ptr [ebp-8],eax
004f0153 894dfc mov dword ptr [ebp-4],ecx
004f0156 833d6031230000 cmp dword ptr ds:[233160h],0
004f015d 7405 je 004f0164
004f015f e80b6a840f call clr!JIT_DbgIsJustMyCode (0fd36b6f)
004f0164 90 nop
j:\Book\ExpertC#2012\SourceCode\BookExamples\Ch15\Program.cs @ 29:
004f0165 8b4dfc mov ecx,dword ptr [ebp-4]
004f0168 ff158c372300 call dword ptr ds:[23378Ch] (Ch15.Person.get_Name(),
mdToken: 06000003)
004f016e 8945f8 mov dword ptr [ebp-8],eax
004f0171 8b4df8 mov ecx,dword ptr [ebp-8]
004f0174 e827a3b178 call mscorlib_ni+0x2fa4a0 (7900a4a0) (System.Console.
WriteLine(System.String), mdToken: 0600098f)
004f0179 90 nop
j:\Book\ExpertC#2012\SourceCode\BookExamples\Ch15\Program.cs @ 30:
004f017a 90 nop
004f017b 8be5 mov esp,ebp
004f017d 5d pop ebp
004f017e c3 ret
You can use the name2ee command to explore the method table information of the different types from .NET Framework assembly. If you want to explore the String class from the mscorlib.dll assembly, you need to execute the command:
!name2ee mscorlib.dll System.String
This will show you the type information about the String class:
Module: 536b1000
Assembly: mscorlib.dll
Token: 0200004c
MethodTable: 53aab808 /* This used later in the dumpmt command */
EEClass: 536b4ec8
Name: System.String
The following section will explore the dumpmt command that can be used to find the information about the method of a type. The dumpmt command will use the method table address 002337bc of the Person class, which we saw in the name2ee command earlier.
Method Table Information of an Object dumpmt
If you want to explore method table information using the method table address returned from the Person class, we can execute the dumpmt command along with the method table address 002337bc. The dumpmt command has an MD option that is used to display information about the method description:
!dumpmt -MD 002337bc
This produces the output:
EEClass: 002312d8
Module: 00232e94
Name: Ch15.Person
mdToken: 02000003
File: J:\Book\ExpertC#2012\SourceCode\BookExamples\Ch15\bin\Debug\Ch15.exe
BaseSize: 0xc
ComponentSize: 0x0
Slots in VTable: 8
Number of IFaces in IFaceMap: 0
--------------------------------------
MethodDesc Table
Entry MethodDe JIT Name
78ff99d0 78d16a08 PreJIT System.Object.ToString()
78fe4b70 78d16a10 PreJIT System.Object.Equals(System.Object)
78fe4c80 78d16a30 PreJIT System.Object.GetHashCode()
78fe1500 78d16a44 PreJIT System.Object.Finalize()
004f00d0 002337a8 JIT Ch15.Person..ctor()
004f0190 00233784 JIT Ch15.Person.get_Name()
004f0108 00233790 JIT Ch15.Person.set_Name(System.String)
004f0148 0023379c JIT Ch15.Person.ShowDetails()
The dumpmt command can also be used to explore the method table for the .NET Frameworks’ type. For example, the method table address 53aab808 of the string class (explore early) in the mscorlib.dll assembly would be:
!dumpmt -MD 53aab808
It produces the output:
EEClass: 536b4ec8
Module: 536b1000
Name: System.String
mdToken: 0200004c
File: C:\Windows\Microsoft.Net\assembly\GAC_32\mscorlib\v4.0_4.0.0.0__
b77a5c561934e089\mscorlib.dll
BaseSize: 0xc
ComponentSize: 0x2
Slots in VTable: 193
Number of IFaces in IFaceMap: 7
--------------------------------------
MethodDesc Table
Entry MethodDe JIT Name
539a2cd0 5373f874 PreJIT System.String.ToString()
/* information removed */
539dfca0 5373fbd0 PreJIT System.String.ConcatArray(System.String[], Int32)
Explore Heap Using dumpheap
The CLR stores all the reference types, for example, the instance of the Person class from Listing 15-1, onto the Heap. Using the dumpheap command, we can find the current state of the Heap for the Person object:
!dumpheap -type Person
This will produce the output:
Address MT Size
016c2374 002937bc 12
total 0 objects
Statistics:
MT Count TotalSize Class Name
002937bc 1 12 Ch15.Person
Total 1 objects
Setting the Breakpoint of a Method to Pause Execution
The bpmd command is used to set the breakpoint in a method of a loaded type. For example, if you want to set a breakpoint in the ShowDetails method, execute the command:
!bpmd Ch15.exe Ch15.Person.ShowDetails
This will set the breakpoint to the ShowDetails method and display the following output to show the status of the bpmd execution:
Found 1 methods in module 00142e94...
MethodDesc = 0014379c
Adding pending breakpoints...
The bpmd command can also be used to set the breakpoint in the .NET Framework method, for example, the ToUpper method of the String class using the bpmd command:
!bpmd mscorlib.dll System.String.ToUpper
!bpmd mscorlib.dll System.String.ToLower
!bpmd mscorlib.dll System.String.Trim
This command will produce the output:
Found 2 methods in module 536b1000...
MethodDesc = 5373f850
MethodDesc = 5373f85c
Setting breakpoint: bp 53999956 [System.String.ToUpper(System.Globalization.CultureInfo)]
Setting breakpoint: bp 539A0ECC [System.String.ToUpper()]
Adding pending breakpoints...
Found 2 methods in module 536b1000...
MethodDesc = 5373f82c
MethodDesc = 5373f838
Setting breakpoint: bp 539A3936 [System.String.ToLower(System.Globalization.CultureInfo)]
Setting breakpoint: bp 53986690 [System.String.ToLower()]
Adding pending breakpoints...
Found 2 methods in module 536b1000...
MethodDesc = 5373f490
MethodDesc = 5373f88c
Setting breakpoint: bp 539AF41C [System.String.Trim()]
Setting breakpoint: bp 5399BF63 [System.String.Trim(Char[])]
Adding pending breakpoints...
The bpmd command is very useful when you want to explore the stack information of the method execution.
Stack Information for an Application
The dumpstack command can be used to find the status of the stack:
!dumpstack
It will produce the output:
0:000> !dumpstack
OS Thread Id: 0xa80 (0)
Current frame: ntdll!KiFastSystemCallRet
ChildEBP RetAddr Caller, Callee
/* information removed */
0024ff50 7763b3f5 ntdll!__RtlUserThreadStart+0x70
0024ff90 7763b3c8 ntdll!_RtlUserThreadStart+0x1b, calling ntdll!__RtlUserThreadStart
To analyze the stack information, you need to use the clrstack command, which is one of most important commands to explore the stack information of a method:
!clrstack
It will produce the output:
OS Thread Id: 0x450 (0)
Child SP IP Call Site
0028f4a8 002b0164 Ch15.Person.ShowDetails() [j:\Book\ExpertC#2012\SourceCode\
BookExamples\Ch15\Program.cs @ 24]
0028f4b8 002b00b6 Ch15.Program.Main(System.String[]) [j:\Book\ExpertC#2012\SourceCode\
BookExamples\Ch15\Program.cs @ 17]
0028f64c 6cd03dd2 [GCFrame: 0028f64c]
The clrstack command takes p option to display the parameters section of the method call. You have to set the breakpoint to the ShowDetails method and program control, which is currently in the Main. Let’s execute the g command and !clrstack with the p option:
!clrstack -p
It produces the output:
OS Thread Id: 0xb7c (0)
Child SP IP Call Site
0039f318 00610164 Ch15.Person.ShowDetails()
[j:\Book\ExpertC#2012\SourceCode\BookExamples\Ch15\Program.cs @ 28]
PARAMETERS:
this (0x0039f31c) = 0x016c2374
0039f328 006100b6 Ch15.Program.Main(System.String[])
[j:\Book\ExpertC#2012\SourceCode\BookExamples\Ch15\Program.cs @ 17]
PARAMETERS:
args (0x0039f334) = 0x016c2354
0039f4bc 0f593dd2 [GCFrame: 0039f4bc]
The l option can be used in the clrstack command to show the LOCALS section of the method stack:
!clrstack -l
It produces the output:
OS Thread Id: 0xb7c (0)
Child SP IP Call Site
0039f318 00610164 Ch15.Person.ShowDetails() [j:\Book\ExpertC#2012\SourceCode\
BookExamples\Ch15\Program.cs @ 28]
0039f328 006100b6 Ch15.Program.Main(System.String[]) [j:\Book\ExpertC#2012\
SourceCode\BookExamples\Ch15\Program.cs @ 17]
LOCALS:
0x0039f330 = 0x016c2374
0x0039f32c = 0x016c2374
0039f4bc 0f593dd2 [GCFrame: 0039f4bc]
The p and l options can be combined with the a option, which can be used to get the full details about the method stack:
!clrstack -a
This will produce the output:
OS Thread Id: 0xb7c (0)
Child SP IP Call Site
0039f318 00610164 Ch15.Person.ShowDetails() [j:\Book\ExpertC#2012\SourceCode\
BookExamples\Ch15\Program.cs @ 28]
PARAMETERS:
this (0x0039f31c) = 0x016c2374
0039f328 006100b6 Ch15.Program.Main(System.String[]) [j:\Book\ExpertC#2012\
SourceCode\BookExamples\Ch15\Program.cs @ 17]
PARAMETERS:
args (0x0039f334) = 0x016c2354
LOCALS:
0x0039f330 = 0x016c2374 /* Used later to explore object information*/
0x0039f32c = 0x016c2374
0039f4bc 0f593dd2 [GCFrame: 0039f4bc]
From this output, we can see the PARAMETERS and LOCALS sections use some addresses, for example, 0x016c2374, to refer to some objects on the Heap. You can use the dumpobj command to explore information about these objects. The next section will discuss the dumpobj command.
Exploring Object Information of a Type Using dumpobj
The dumpobj command, along with the address of an object, shows details about the object stored in the Heap:
/* address taken from the LOCALS section of the above output which
* refers the instance of the Person*/
!dumpobj 0x016c2374
It produced the output:
Name: Ch15.Person
MethodTable: 002937bc
EEClass: 002912d8
Size: 12(0xc) bytes
File: J:\Book\ExpertC#2012\SourceCode\BookExamples\Ch15\bin\Debug\Ch15.exe
Fields:
MT Field Offset Type VT Attr Value Name
7957b808 4000001 4 System.String 0 instance 016c2364 <Name>k__BackingField
Current Object in the Stack
Using the dumpstackobjects command, you can get the current object information from the stack:
!dumpstackobjects
It produces the output:
OS Thread Id: 0xb7c (0)
ESP/REG Object Name
ecx 016c2374 Ch15.Person
0039F31C 016c2374 Ch15.Person
0039F328 016c2374 Ch15.Person
0039F32C 016c2374 Ch15.Person
0039F330 016c2374 Ch15.Person
0039F334 016c2354 System.Object[] (System.String[])
0039F3B0 016c2354 System.Object[] (System.String[])
0039F50C 016c2354 System.Object[] (System.String[])
0039F544 016c2354 System.Object[] (System.String[])
For example, you can use the address of the instance of the Person class 016c2374 to find object information using the dumpobject (do is short for dumpobject):
!do 016c2374
It produces the output:
Name: Ch15.Person
MethodTable: 002937bc
EEClass: 002912d8
Size: 12(0xc) bytes
File: J:\Book\ExpertC#2012\SourceCode\BookExamples\Ch15\bin\Debug\Ch15.exe
Fields:
MT Field Offset Type VT Attr Value Name
7957b808 4000001 4 System.String 0 instance 016c2364 < Name>k__BackingField
So far we have explored the instance of a type. If you want to explore the static class that does not have any instance, you can use the dumpclass command, which shows information about the static class, as described in the next section.
Static Class Information
The dumpclass command can be used to explore the static class. For example, the Console class is a static class within the system namespace:
!name2ee mscorlib.dll System.Console
It produces the output:
Module: 536b1000
Assembly: mscorlib.dll
Token: 020000af
MethodTable: 53a9d1f8
EEClass: 53716970 /* used by the dumpclass */
Name: System.Console
The dumpclass command along with the address of the EEClass 53716970 shows information about the static class console:
!dumpclass 53716970
It produces the output:
Class Name: System.Console
mdToken: 020000af
File: C:\Windows\Microsoft.Net\assembly\GAC_32\
mscorlib\v4.0_4.0.0.0__b77a5c561934e089\mscorlib.dll
Parent Class: 536b4f7c
Module: 536b1000
Method Table: 53a9d1f8
Vtable Slots: 4
Total Method Slots: 5
Class Attributes: 100181 Abstract,
Transparency: Transparent
NumInstanceFields: 0
NumStaticFields: 16
MT Field Offset Type VT Attr Value Name
53aad758 40002aa 60 ...t.UnicodeEncoding 0 shared static StdConUnicodeEncoding
>> Domain:Value 00083d70:018223d4 <<
53a9fcd8 40002ab 64 System.IO.TextReader 0 shared static _in
>> Domain:Value 00083d70:00000000 <<
53aae768 40002ac 68 System.IO.TextWriter 0 shared static _out
>> Domain:Value 00083d70:01824024 <<
/* Information removed */
Exception Handling Analysis Using name2ee and ehinfo
The SOS debugging extension DLL provides another way to examine the exception handling mechanism in .NET. The program in Listing 15-2 will be used to help us explore exception handling.
Listing 15-2. Example of Exception Handling
using System;
namespace Ch15
{
class Program
{
static void Main(string[] args)
{
try
{
int a = 100, b = 0;
Console.WriteLine(a / b);
}
catch (DivideByZeroException dbze)
{
Console.WriteLine(dbze.Message);
}
}
}
}
This program will produce the output:
Attempted to divide by zero.
To debug the executable from Listing 15-2, you need to start from scratch (i.e., stop the previous debug session in the Windbg and load the executable produced from Listing 15-2). You need to load the SOS.dll (just to clarify, you do not need to load the symbols again for the windbg.exe), as we did earlier in the chapter, but this time with the new executable produced from Listing 15-2. To refresh your mind, you would execute as follows:
sxe ld clrjit
g
.loadby sos clr
.load C:\Windows\Microsoft.NET\Framework\v4.0.30319\sos.dll
These commands will allow you to execute further commands to analyze the exception handling information embedded within the method in compile time. To explore the exception handling, you need to execute the name2ee, dumpmt, and ehinfo commands. The name2ee command will show the method table information for the Program class:
0:000> !name2ee Ch15.exe Ch15.Program
Module : 00332e94
Assembly : Ch15.exe
Token : 02000002
MethodTable : 00333724
EEClass : 00331264
Name : Ch15.Program
To explore the method description table for the program, you need to use the dumpmt command, which produces the output:
0:000> !dumpmt -md 00333724
EEClass : 00331264
Module : 00332e94
Name : Ch15.Program
mdToken : 02000002
File :J:\Book\ExpertC#2012\SourceCode\
BookExamples\Ch15\bin\Debug\Ch15.exe
BaseSize : 0xc
ComponentSize : 0x0
Slots in VTable : 6
Number of IFaces in IFaceMap: 0
--------------------------------------
MethodDesc Table
Entry MethodDesc JIT Name
78e499d0 78b66a08 PreJIT System.Object.ToString()
78e34b70 78b66a10 PreJIT System.Object.Equals(System.Object)
78e34c80 78b66a30 PreJIT System.Object.GetHashCode()
78e31500 78b66a44 PreJIT System.Object.Finalize()
0033c015 0033371c NONE Ch15.Program..ctor()
0033c011 00333710 NONE Ch15.Program.Main(System.String[])
From the Jitted status of the Main method, you can see that it has not yet been Jitted, so to Jit the Main method you need to execute the g command. It will execute the Main method and return to the caller. As a result, you be unable to explore details about the Main method. It requires pausing the execution of the Main method to add a breakpoint to the Main method using the bpmd command:
!bpmd Ch15.exe Ch15.Program.Main
It produces the output:
Found 1 methods in module 00332e94...
MethodDesc = 00333710
Adding pending breakpoints...
Now execute the g command, and this will start Jitting the process, and the Jit compiler will compile the Main method. To find out more about it, execute the following:
0:000> !dumpmt -md 00333724
EEClass : 00331264
Module : 00332e94
Name : Ch15.Program
mdToken : 02000002
File : J:\Book\ExpertC#2012\SourceCode\BookExamples\Ch15\bin\Debug\Ch15.exe
BaseSize : 0xc
ComponentSize : 0x0
Slots in VTable : 6
Number of IFaces in IFaceMap: 0
--------------------------------------
MethodDesc Table
Entry MethodDesc JIT Name
78e499d0 78b66a08 PreJIT System.Object.ToString()
78e34b70 78b66a10 PreJIT System.Object.Equals(System.Object)
78e34c80 78b66a30 PreJIT System.Object.GetHashCode()
78e31500 78b66a44 PreJIT System.Object.Finalize()
0033c015 0033371c NONE Ch15.Program..ctor()
0033c011 00333710 JIT Ch15.Program.Main(System.String[])
The Main method has been Jitted so you can explore the exception handling information about the Main method using the MethodDesc reference exception handling information that is extracted using the EHInfo command:
0:000> !EHInfo 00333710
It produces the output:
MethodDesc: 00333710
Method Name: Ch15.Program.Main(System.String[])
Class: 00331264
MethodTable: 00333724
mdToken: 06000001
Module: 00332e94
IsJitted: yes
CodeAddr: 003b0050
Transparency: Critical
EHHandler 0: TYPED
Clause : [003b0089, 003b00a9] [39, 59]
Handler : [003b00a9, 003b00d2] [59, 82]
The output produces the exception handling information regarding the Main method. You can explore this a bit further in native code level using the following command for the MethodDesc address 00333710:
!u -ehinfo -n 00333710
It produces the output:
Normal JIT generated code
Ch15.Program.Main(System.String[])
Begin 003b0050, size 8b
003b0050 55 push ebp
003b0051 8bec mov ebp,esp
003b0053 57 push edi
003b0054 56 push esi
003b0055 83ec2c sub esp,2Ch
003b0058 8bf1 mov esi,ecx
003b005a 8d7dcc lea edi,[ebp-34h]
003b005d b90a000000 mov ecx,0Ah
003b0062 33c0 xor eax,eax
003b0064 f3ab rep stos dword ptr es:[edi]
003b0066 8bce mov ecx,esi
003b0068 894de0 mov dword ptr [ebp-20h],ecx
003b006b 833d6031330000 cmp dword ptr ds:[333160h],0
003b0072 7405 je 003b0079
003b0074 e8f66afd0e call clr!JIT_DbgIsJustMyCode (0f386b6f)
003b0079 33d2 xor edx,edx
003b007b 8955d4 mov dword ptr [ebp-2Ch],edx
003b007e 33d2 xor edx,edx
003b0080 8955d8 mov dword ptr [ebp-28h],edx
003b0083 33d2 xor edx,edx
003b0085 8955dc mov dword ptr [ebp-24h],edx
003b0088 90 nop
/* Exception Catch block start from here */
EHHandler 0: TYPED CLAUSE BEGIN
003b0089 90 nop
003b008a c 745dc64000000 mov dword ptr [ebp-24h],64h
003b0091 33d2 xor edx,edx
003b0093 8955d8 mov dword ptr [ebp-28h],edx
003b0096 8b45dc mov eax,dword ptr [ebp-24h]
003b0099 99 cdq
003b009a f77dd8 idiv eax,dword ptr [ebp-28h]
003b009d 8bc8 mov ecx,eax
003b009f e8d4661679 call mscorlib_ni+0x9b6778 (79516778) (System.
Console.WriteLine(Int32), mdToken: 0600098a)
003b00a4 90 nop
003b00a5 90 nop
003b00a6 90 nop
003b00a7 eb29 jmp 003b00d2
EHHandler 0: TYPED CLAUSE END
/* End of the Exception Catch block*/
/* Start of the Exception handling block */
EHHandler 0: TYPED HANDLER BEGIN
003b00a9 8945d0 mov dword ptr [ebp-30h],eax
003b00ac 8b45d0 mov eax,dword ptr [ebp-30h]
003b00af 8945d4 mov dword ptr [ebp-2Ch],eax
003b00b2 90 nop
003b00b3 8b4dd4 mov ecx,dword ptr [ebp-2Ch]
003b00b6 8b01 mov eax,dword ptr [ecx]
003b00b8 8b4028 mov eax,dword ptr [eax+28h]
003b00bb ff5010 call dword ptr [eax+10h]
003b00be 8945cc mov dword ptr [ebp-34h],eax
003b00c1 8b4dcc mov ecx,dword ptr [ebp-34h]
003b00c4 e8d7a3aa78 call mscorlib_ni+0x2fa4a0 (78e5a4a0) (System.Console.
WriteLine(System.String), mdToken: 0600098f)
003b00c9 90 nop
003b00ca 90 nop
003b00cb e8f53dd20e call clr!JIT_EndCatch (0f0d3ec5)
003b00d0 eb00 jmp 003b00d2
EHHandler 0: TYPED HANDLER END
/* End of the Exception handling block */
003b00d2 90 nop
003b00d3 90 nop
003b00d4 8d65f8 lea esp,[ebp-8]
003b00d7 5e pop esi
003b00d8 5f pop edi
003b00d9 5d pop ebp
003b00da c3 ret
Clear the Output Window
The .cls command is helpful to clear the command output window in the windbg.exe.
Complete List of Command
To get information about an individual command, for example, to get more information about clrstack command, execute the command:
!help clrstack
Intermediate Language Disassembler
The Intermediate Language Disassembler (ILDasm) tool is used to examine .NET Framework assemblies in IL format, such as mscorlib.dll, as well as other .NET Framework assemblies provided by a third party or that you created. The ILDasm parses any .NET Framework–managed assembly. The ILDasm can be used:
· To explore Microsoft intermediate language (MSIL) code
· To displays namespaces and types, including their interfaces
· To explore the executable header information
Download and Installation
The ILDasm comes with the .NET Framework Software Development Kit, so you do not need to download it and it will be installed as part of the Visual Studio installation.
How to Use the ILDasm
After opening any executable in the ILDasm, the generated IL code would be displayed as shown in Figure 15-5.
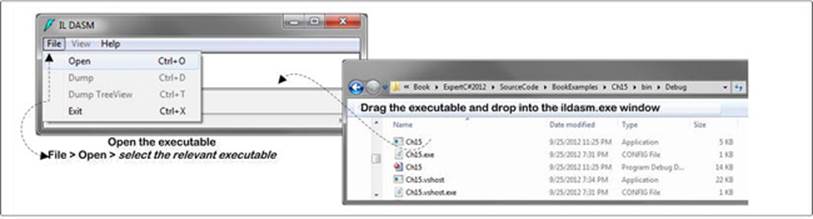
Figure 15-5. Open an executable via the ILDasm.exe
After opening the executable in the ILDasm, the generated IL code would be displayed as shown in Figure 15-6.
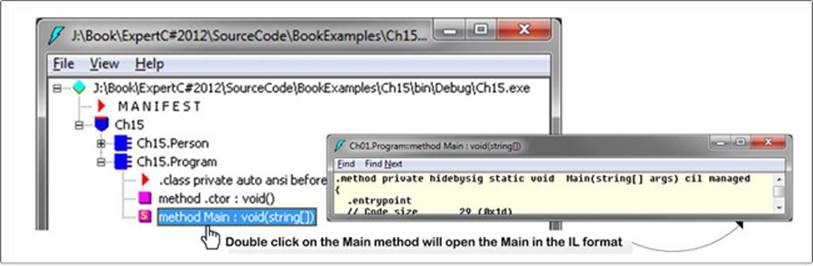
Figure 15-6. Main method in IL view
Figure 15-6 demonstrates that you can explore the contents of the method by double-clicking the method name from the explored assembly contents in the ILDasm. The contents of the method will be in IL format.
The following sections will explore different scenarios to show how the ILDasm tool can be used to explore the managed assembly, metadata information of the managed assembly, and much more.
Exploring .ctor and .cctor Using ildasm.exe
The C# compiler compiles the constructors of a type and names the constructors with the .ctor and .cctor extensions in the compiled IL code. Listing 15-3 is used to explain the .ctor and .cctor compiled by the C# compiler for the constructors of a class in C#.
Listing 15-3. Example of the Universe Class
namespace Ch15
{
class Program
{
static void Main(string[] args) {}
}
public class Universe
{
static double ageOfTheUniverse;
public Universe() {} /* Compiled as .ctor */
public Universe(double age) {} /* Compiled as .ctor */
static Universe()
{ ageOfTheUniverse = 13.75e+10; } /* Compiled as .cctor */
public void EmtpyMethod() {} /* Method declaration */
}
}
Let’s decompiled the executable produced from Listing 15-3 using the ILDasm. Open the Universe class, which will show you the compiled IL code as shown in Figure 15-7.
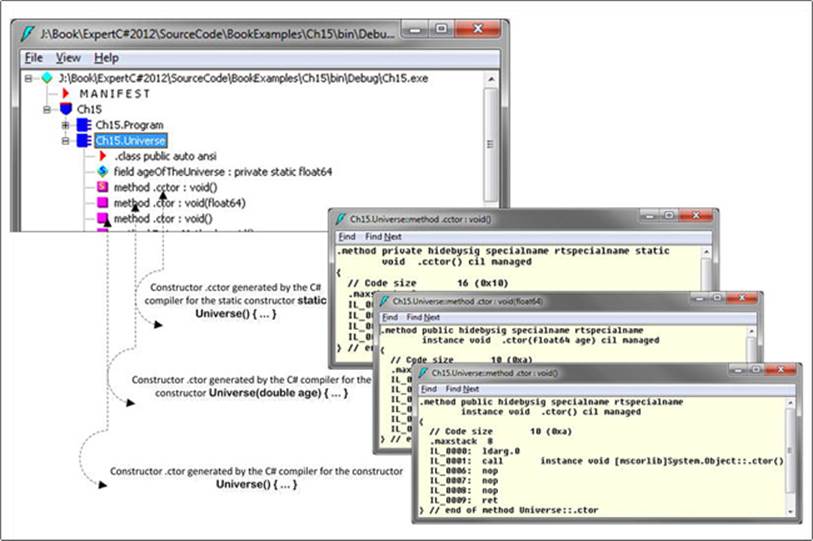
Figure 15-7. Decompiled IL code via ildasm.exe
Following the decompiled IL code shows how the C# compiler compiled the constructor’s .cctor and .ctor including overloaded, as shown in Listing 15-4.
Listing 15-4. Decompiled IL Code for Listing 15-3
.class public auto ansi Universe extends [mscorlib]System.Object
{
/* Type Initializer */
.method private hidebysig specialname rtspecialname
static void .cctor() cil managed
{
.maxstack 8
L_0000: nop
L_0001: ldc.r8 137500000000
L_000a: stsfld float64 Ch15.Universe::ageOfTheUniverse
L_000f: ret
}
/* Instance constructor */
.method public hidebysig specialname rtspecialname instance
void .ctor() cil managed
{
.maxstack 8
L_0000: ldarg.0
L_0001: call instance void [mscorlib]System.Object::.ctor()
L_0006: nop
L_0007: nop
L_0008: nop
L_0009: ret
}
/* Instance constructor */
.method public hidebysig specialname rtspecialname instance
void .ctor(float64 age) cil managed
{
.maxstack 8
L_0000: ldarg.0
L_0001: call instance void [mscorlib]System.Object::.ctor()
L_0006: nop
L_0007: nop
L_0008: nop
L_0009: ret
}
/* Method declaration */
.method public hidebysig instance void EmtpyMethod() cil managed
{
.maxstack 8
L_0000: nop
L_0001: ret
}
.field private static float64 ageOfTheUniverse
}
From Listing 15-4, you can see that while C# compiler compiles the constructor for the Universe class from Listing 15-3, it compiles the instance constructors with the .ctor extension and type initializers with the .cctor extension.
.ctor
From Listing 15-4, you can see that two methods have been named as .ctor. These are the instance constructors. According to the CLI specification Partition II (Metadata Definition and Semantics), the instance constructors are named as .ctor and marked with instance, rtspecialname, and specialname.
.cctor
From Listing 15-4, you can see that a method has been named as .cctor. It is the type initializer, which is used to initialize the type itself. According to the CLI specification Partition II (Metadata Definition and Semantics), this method will be static, take no parameters, return no value, be marked with rtspecialname and specialname, and be named .cctor. Besides the constructors, Listing 15-4 contains a field declaration with the .field extension and a method named EmptyMethod.
Exploring Metadata Information of an Assembly Using ILDasm
The ILDasm tool can be used to explore the metadata information of an assembly, for example, you can see the String Heap addresses, user strings section, and so forth, as demonstrated in Figure 15-8.
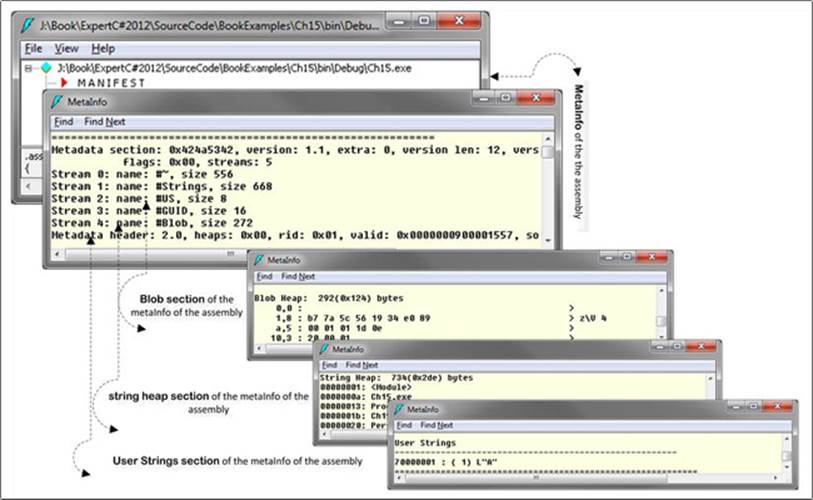
Figure 15-8. Metadata information using ILDasm.exe tool
Exploring .NET Framework Source Code in IL Code
Let’s open ToUpper method from the String class of the mscorblib.dll assembly via ildasm.exe:
· Drag the mscorblib.dll assembly onto the ILDasm.
· Locate the string class from the mscorblib.dll and double-click the ToUpper method from the string class.
This will show the IL implementation of the ToUpper method, as shown in Figure 15-9.
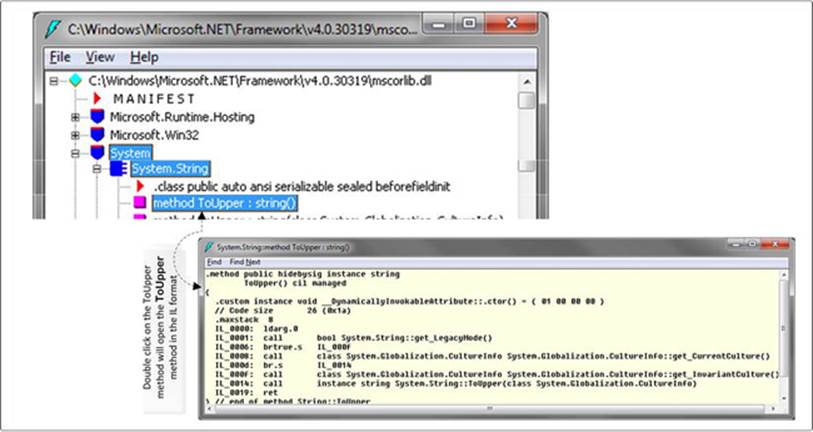
Figure 15-9. Open string class via ildasm.exe
The .NET Reflector: Source Code Explorer
The .NET Reflector tool is used to explore .NET assembly’s source code in C# or in IL format, which shows the inner implementation of the .NET assemblies. To analyze this, browse and debug the .NET components, for example, the executable or the DLL in different .NET languages. This tool can be used to:
· See the metadata
· See the IL code of the assembly
· View resources and XML documentation
· View and debug the .NET Framework code
Its Analyzer option can be used to find assembly dependencies and even Windows DLL dependencies.
Once the .NET Reflector tool is combined with other add-ins, it can become a tool to facilitate testing and make teamwork more effective.
Download and Installation
This tool can be download from http://www.reflector.net/. After installing the Reflector, you open it from the installed directory. Figure 15-10 shows the source code of the string class from the mscorlib.dll assembly that was opened using the Reflector.
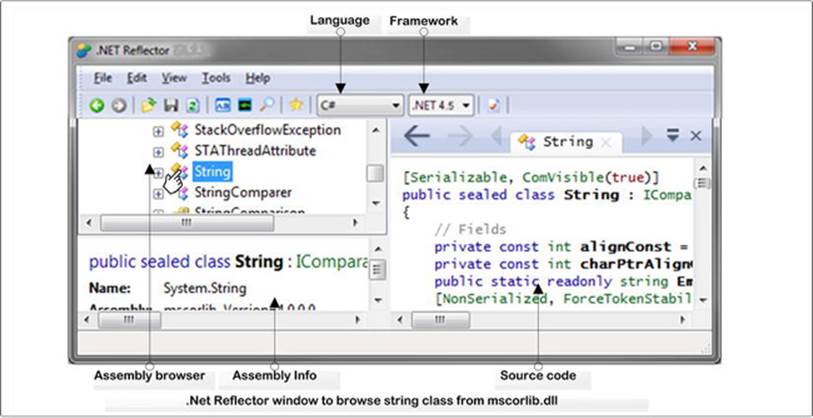
Figure 15-10. Introduction of the .Net Reflector tool
The .NET Reflector, ILasm, and ILDasm
Microsoft supplies two tools for investigating assemblies:
· ILasm, the Microsoft IL Assembler. It will take an ASCII assembly language source code file and produce binary IL (MSIL) code.
· ILDasm, the .NET disassembler. This is part of the .NET Framework that works the other way around. It will produce an “assembly” file from an IL file.
The ILDasm tools are useful, but not sufficient by themselves. Unfortunately, ILDasm works best only with CLI assembly sections. The tool will show method signatures and member variables of an assembly, but the code will be in .NET IL code.
To be able to extract everything you want from a .NET assembly, in the language that was used originally to create the assembly, you will need .NET Reflector. This will also allow you to browse and inspect the other resources in the assembly, even the XML documentation used by the IDE (Integrated Development Environment) that created the assembly.
Exploring .NET Framework Source Code in C# or IL View
The Reflector can be used to explore the source code of the assembly in C# or IL language. Figure 15-11 shows the source code of the String class in the mscorlib.dll in .NET Framework.
You can also explore the source code of the executable produced from Listing 15-1. This tool is very handy when you have a managed assembly but not the source code.
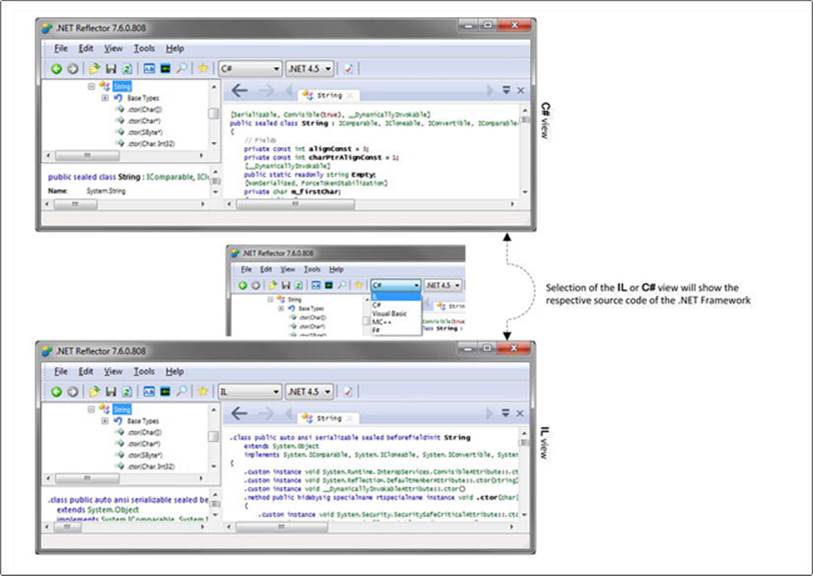
Figure 15-11. .NET Framework source code explore using the .NET Reflector tool
CLR Profiler: A Memory Profiler
The CLR Profiler is a memory profiler for the .NET Framework. It allows you to analyze the contents of the managed Heap and the garbage collector. This tool can also be used to analyze different information about the execution, allocation, and memory consumption of your application and to analyze the performance of your application. Figure 15-12 shows the CLR Profiler tools.
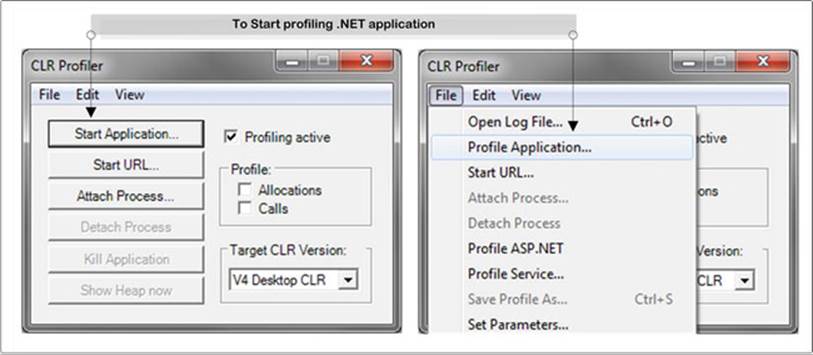
Figure 15-12. Introducing CLR Profiler 4.0
Download and Installation
The CLR Profiler is downloaded as a self-extracting executable file. The expanded contents include the source code and the executable file (CLRProfiler.exe). The download also contains a comprehensive document that provides detailed information on CLR Profiler. This can be download fromhttp://www.microsoft.com/en-us/download/details.aspx?id=16273.
Views in CLR Profiler
The CLRProfiler.exe has different views that can be used to analyze the application, as discussed in the sections that follow.
Histogram Allocated Types
This shows the high-level view of object type’s allocation (by allocation size) during the application lifetime. It also shows the large object Heap (objects larger than 85KB).
Histogram Relocated Types
It shows that those objects that survived in the garbage collection move to different generation, for example, Gen0, Gen1, and Gen2.
Objects By Address
It shows the managed Heap status at any given time.
Histogram By Age
By this view, you can see the lifetime of the objects on the managed Heap.
Allocation Graph
This view displays the call stack and shows how objects were allocated. You can use this view to:
· See the cost of each allocation by method
· Isolate allocations you were not expecting
· View possible excessive allocations by a method
· View assembly, module, function, and class graphs
Heap Graph
It shows the objects on the managed Heap and their connections.
Call Graph
This view help you to see which methods call other methods and how frequently. You can use this graph to get a feel for the cost of library calls and to determine how many calls are made to methods and which methods are called.
Time Line
This view displays what the garbage collector does over the lifetime of the application. You can use this view to:
· Analyze the behavior of the garbage collector
· Explore the three generations (Gen0, Gen1, and Gen2) and how frequently they occur.
· Determine which objects survive garbage collection and are promoted to the next generation.
You can select time points or intervals and right-click to show who allocated memory in the interval.
Call Tree View
This view can be used to explore text-based, chronological, and hierarchical views of your application’s execution. You can use this view to:
· See what types are allocated and their size
· See which assemblies are loaded as a result of method calls
Memory Profiling
Let’s do a memory profiling for the program in Listing 15-5 using the CLR Profiler.
Listing 15-5. Example of a Memory Profile
using System;
namespace Ch15
{
class Program
{
static void Main(string[] args)
{
double result = default(double);
for (int i = 0; i < Int16.MaxValue; ++i)
result += i;
}
}
}
If you open the executable produced from Listing 15-5 via the ClrProfiler.exe tool, you will see the statistics of the memory while the CLR executes the executable, as shown in Figure 15-13.
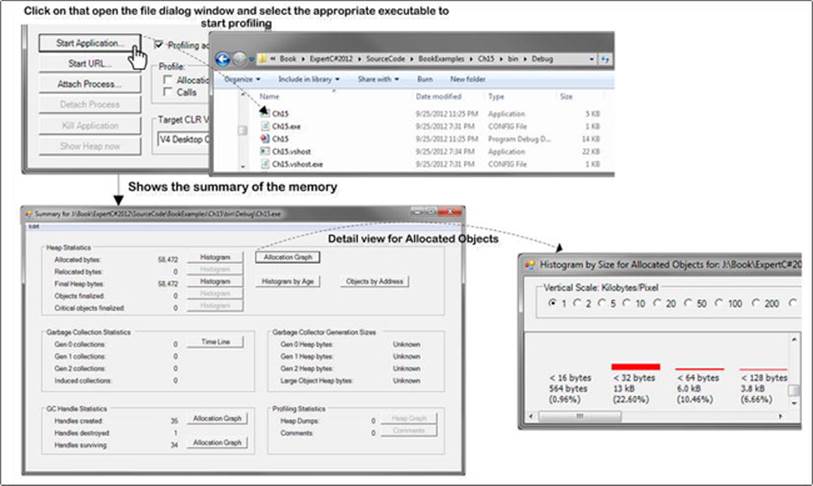
Figure 15-13. Profile and application
Figure 15-13 demonstrates that when the program in Listing 15-5 is loaded by the CLR Profiler, it shows you the Heap statistics, such as how many bytes have been allocated, how much is in the final Heap, and what the status of the garbage collector is.
Summary
Debugging is one of the most important keys to understanding the internal operations of the C# language features. Using the debugger, you will better understand how the C# actually works. This book has explored the stack and Heap, parameter passing in method call, automatic property declaration, how the enum type is handled by the CLR, the state machine in iterator, and much more. This chapter has brought these different concepts together by exploring the use of debugging tools such as Windbg, ILDasm, .NET Reflector, and CLR Profiler.