Learning Nagios 4 (2014)
Chapter 12. Using the Query Handler
The last chapter talked about the extension of Nagios using multiple approaches, including writing your own plugins or commands to send notifications, and performing passive checks and sending the results to Nagios.
Nagios 4 provides a new interface called query handler, which is a general purpose mechanism that allows other processes to communicate with Nagios. It allows two-way communication, so it is possible to both send commands to the Nagios, similar to external commands pipe, and to receive information—either answers to a command that was previously sent to the query handler or asynchronous notifications, such as information about changes in the host and/or service status.
In this chapter, we will cover the following topics:
· Understanding the query handler
· Learning the services currently available in the query handler
· Communicating with various services
· Using the Nagios Event Radio Dispatcher (NERD) service to receive real-time notifications about changes in the host and service statuses
Introducing the query handler
The query handler is a major new feature of Nagios 4. It allows two-way communication between Nagios internal processes and external applications, and is designed to be extensible. The future versions of Nagios may provide more functionality using the query handlers.
The query handler communicates using Unix domain sockets (for more details, visit http://en.wikipedia.org/wiki/Unix_domain_socket). These are meant for communication between processes on same machine. Unix domain sockets use filesystems as names for remote addresses. For example, /var/nagios/rw/nagios.qh is the path to the query handler's Unix domain socket for an installation performed according to the steps given in Chapter 2, Installing Nagios 4. Filesystem permissions are used to determine whether a process can connect to the other side—so it is possible to limit the access to the query handler to specific operating system users or groups.
Unix domain sockets are very similar to named pipes, such as the Nagios external commands pipe; however, it is not possible to use named pipes for a two-way communication with more than one client. Another difference is that you cannot open Unix domain sockets as a file and/or send commands to the socket using shell commands such as echo, which is possible with named pipes such as the Nagios external commands pipe.
Nagios provides its functionalities through the query handlers using services. There are several built-in services, and the ones that are public are described throughout this chapter. The future versions of Nagios (or third-party software) may provide additional services. Each command sent to Nagios is prefixed with its service name, so each service may use any name for its subcommands.
Nagios uses the query handlers internally to distribute jobs to worker processes. Child processes connect to the query handler and receive tasks that should be performed. This is one of the reasons the query handler was originally created—to control the worker processes. The worker processes use the wproc service, which is an internal service and should only be used by Nagios processes.
Nagios also provides services that can be used by external applications. The first and most basic one is echo, which simply responds with the data that was sent to it. It is mainly a useful tool to learn how to communicate with Nagios.
The core service allows the querying of information about Nagios processes and scheduled jobs. The nerd service allows you to subscribe to events and can be used to receive real-time updates about changes on the Nagios host and/or service status.
Communicating with the query handler
The location (address) of the Nagios query handler is similar to the Nagios external command pipe—which is called nagios.qh and by default, resides in the same directory as the external commands pipe. The path to the query handler is /var/nagios/rw/nagios.qh for an installation performed according to the steps given in Chapter 2, Installing Nagios 4.
Let's begin to understand the query handler by communicating with it from the shell. There are multiple commands that allow us to connect to the Unix domain sockets, for example, Netcat (for more details, visit http://netcat.sourceforge.net/) and socat (for more details, visit http://www.dest-unreach.org/socat/). Both can be used to send commands to the Nagios query handler. To install the tools, simply run the following command on Ubuntu:
# apt-get install socat netcat
For Red Hat Enterprise Linux, CentOS, and Fedora Core, you can run the following command:
# yum install socat nc
For Red Hat Enterprise Linux, the socat package is available as part of Extra Packages for Enterprise Linux (EPEL) (for more details, visit https://fedoraproject.org/wiki/EPEL). This package will not be available unless EPEL is installed. It will install both of the tools, which will be used later to check the communication with the query handler. The communication protocol for query handler is simple. There is no initial message, so post connection, we can simply send the commands to the query handler.
All commands that are sent to the query handler are prefixed with the name of the handler and are sent using the following command:
@service command\0
In the preceding command, @service is the name of the service prefixed with the @ character, command is the command (and parameters) to be sent, and \0 is a character with the ASCII code of 0 that indicates the end of the command. Nagios may also send information—responses to commands or notifications. The format of the response varies by the service that implements it.
Many commands return an answer or send notifications after it is invoked. However, some commands, for example, to modify settings, will return an exit code. The code is modeled after the HTTP status codes (visithttp://en.wikipedia.org/wiki/List_of_HTTP_status_codes), where codes starting with 200 indicate success and those starting with 400 indicate an error.
Nagios provides the @echo service that can be used to test the connectivity to the query handler. It will return the same message that was sent to it. To test the connectivity, we can simply run the following command:
# echo -e '@echo Query handler is working properly!\0' | \
socat - UNIX-CONNECT:/var/nagios/rw/nagios.qh
The first line generates a command to be sent to the @core service. The -e option passed to the echo command enables the interpretation of backslash escapes, which changes \0 to the ASCII character 0.
Next, the output from the echo command is sent to the socat command, which sends its output to the query handler and prints out the result to the standard output. The socat command takes two arguments, which are the channels to relay data for. The hyphen (–) indicates using standard input/output and the UNIX-CONNECT:/var/nagios/rw/nagios.qh argument specifies the Unix domain socket path to connect to—in our case the Nagios query handler.
If the command succeeds, its output should look like this: Query handler is working properly!
If the current user does not have access to connect to the socket, the output will indicate an error as follows:
socat E connect(3, AF=1 "/var/nagios/rw/nagios.qh", 26): Permission denied
For netcat, the command is similar:
# echo -e '@echo Query handler is working properly!\0' | \
nc –U /var/nagios/rw/nagios.qh
The first line of the command is identical to the previous example. The -U option for the netcat command allows it to connect to the Unix domain socket with its address specified in the command line.
A single connection to Nagios can be used to send multiple commands and/or receive multiple types of information. However, as the formats of the responses can vary, it is best to use a single connection for a single service, that is, use one connection to manage the Nagios load and another to get notifications about the host and/or service check results.
Using the query handler programmatically
Now that we know how to communicate with the Nagios query handler, we can do so programmatically. Almost all languages provide a mechanism to communicate using the Unix domain sockets.
For example, to send a test message using Python, we can use the socket module (described in more detail at http://docs.python.org/library/socket.html) to communicate with the query handler using the following code:
#!/usr/bin/env python
# path to query handler and message to send
nagios_qh = "/var/nagios/rw/nagios.qh"
test_message = "TestMessage"
# load required modules
import socket, sys, os
# connect using stream-based Unix socket
s = socket.socket(socket.AF_UNIX, socket.SOCK_STREAM)
s.connect(nagios_qh)
# send message to @echo query handler
s.sendall("@echo " + test_message + "\0")
# read result and close the socket
test_result = s.recv(len(test_message))
s.close()
# check whether the test message was sent back as expected
if test_result == test_message:
print "Return message matches sent message"
exit(0)
else:
print "Return message does not match"
exit(1)
The preceding code sends a test message to the @echo query handler service and retrieves the result. As the @echo service handler does not provide an end-of-message indicator, the code simply reads the same amount of bytes that were sent.
For Ruby, the UNIXSocket class (described in more detail at http://ruby-doc.org/stdlib/libdoc/socket/rdoc/UNIXSocket.html) can be used to connect to the query handler. An example similar to the preceding code is shown as follows:
#!/usr/bin/env ruby
require 'socket'
nagios_qh = "/var/nagios/rw/nagios.qh"
test_message = "Test message"
s = UNIXSocket.new(nagios_qh)
s.send "@echo #{test_message}\0", 0
test_result = s.recv(test_message.length)
if test_result == test_message
puts "Return message matches sent message"
exit 0
else
puts "Return message does not match"
exit 1
end
PHP also supports the Unix domain sockets using the stream_socket_client function. It is documented in more detail at http://www.php.net/manual/function.stream-socket-client.php.
For example, to write a message and read it, we can use the following PHP code:
<?php
test_message = "TestMessage";
$sock = stream_socket_client('unix:///var/nagios/rw/nagios.qh');
fwrite($sock, '@echo '.test_message."\0");
echo fread($sock, strlen(test_message))."\n";
fclose($sock);
?>
While programming in Perl, the IO::Socket::UNIX module (described in more detail at http://perldoc.perl.org/IO/Socket/UNIX.html) can be used to communicate with the query handler. For example, to connect to the Nagios query handler, use the following code:
use IO::Socket::UNIX;
my $qh_socket = IO::Socket::UNIX->new(
Type => SOCK_STREAM,
Peer => '/var/nagios/rw/nagios.qh',
);
$message = "Test Message";
print $qh_socket "\@echo $message\0";
$qh_socket->recv($output, length($message));
print "Read:\n$output";
Java does not natively support the Unix domain sockets, but there are multiple projects that use Java Native Interface (JNI) to provide Unix sockets. These include jnr-unixsocket available at https://github.com/jnr/jnr-unixsocket and juds project athttps://github.com/mcfunley/juds.
Also, Tcl does not provide native support for Unix sockets. However, the ceptcl package (described in detail at http://wiki.tcl.tk/ceptcl) provides mechanisms to connect to the Nagios query handler.
Regarding programs written in C, it is best to use libnagios and its nsock_unix API to connect to the Nagios query handler. Chapter 11, Programming Nagios, demonstrates how to use the C language and the libnagios library to connect to the Nagios query handler and query the @core service.
For other programming languages, support for the Unix domain sockets may be built-in or require additional modules or packages. But as the technology is quite ubiquitous, commonly used languages should provide support for it.
Using the core service
The Nagios query handler provides the @core service, which can be used to get and set information about the Nagios process.
For all commands handled by the @core service, the result is a text that ends with the \0 character—to read a response, all we need to do is continue reading until we receive \0, which indicates the end of the response.
It allows you to query information about the queue of scheduled jobs, such as the next active check or background operation to be performed. The command name is squeuestats and the full command to be sent is as follows:
@core squeuestats\0
The result is a string with multiple statistics information in the form of name=value, separated by semicolons—name1=value1;name2=value2;....
For example, to print all information, we can simply use the following code:
#!/usr/bin/env python
import socket, sys, os
nagios_qh = "/var/nagios/rw/nagios.qh"
s = socket.socket(socket.AF_UNIX, socket.SOCK_STREAM)
s.connect(nagios_qh)
s.sendall("@core squeuestats\0")
result = ""
while True:
b = s.recv(1)
if ord(b) == 0:
break
result += b
s.close()
result = sorted(result.split(";"))
print "\n".join(result)
The code connects to the Nagios socket, sends the @core squeuestats command, and reads the response until the \0 character is sent. The ord function returns the code of the currently read character as an integer number (documented in detail athttp://docs.python.org/2/library/functions.html#ord), and if the read data is not 0, it is added to the result string as a character. Then, the result is split by a semicolon, sorted, and finally, printed as a text, where each element of the list is joined by a newline character (\n).
Another command that the @core service provides is loadctl, which can be used to get values for all available load control settings or change one of their values. The syntax for the command is as follows:
@core loadctl
@core loadctl setting=value
@core loadctl setting1=value1;setting2=value2;...
The first form returns a list of all load control settings in the form of options, such as setting=value, separated by semicolons. For example, look at the following output:
backoff_change=1168;backoff_limit=5.00;changes=0;jobs_limit=3896;jobs_max=3896;jobs_min=40;jobs_running=0;load=0.00;nofile_limit=1024;nproc_limit=46272;options=0;rampup_change=292;rampup_limit=1.60
If the loadctl command has any setting specified, it can be changed and the command returns whether it succeeded or failed as result.
For example, we can change the jobs_max setting using the following command:
# echo -e '@core loadctl jobs_max=9999\0' | \
socat - UNIX-CONNECT:/var/nagios/rw/nagios.qh
The Nagios query handler will return 200: OK in the case of success. A response starting with 400 indicates that the setting was not found or modified.
Note
The load control settings are Nagios internal settings, we do not recommend that you modify them unless needed. The previous example simply illustrates how this can be done if needed.
As a more complete example of using the core service, the following Ruby code queries both scheduled jobs statistics and loads control settings and prints all of them:
#!/usr/bin/env ruby
require 'socket'
def read_response(s)
response = ""
while true
b = s.recv(1)
break if b[0] == "\0"
response << b
end
return response
end
nagios_qh = "/var/nagios/rw/nagios.qh"
s = UNIXSocket.new(nagios_qh)
s.send "@core squeuestats\0", 0
puts "Squeue stats:"
puts read_response(s).split(";").sort.join("\n")
puts ""
s.send "@core loadctl\0", 0
puts "Load control:"
puts read_response(s).split(";").sort.join("\n")
puts ""
Introducing Nagios Event Radio Dispatcher
The query handler also includes the NERD (Nagios Event Radio Dispatcher) service, which allows you to subscribe to the service or host check results. The service name is @nerd and it accepts the following commands:
@nerd list\0
@nerd subscribe <channel>\0
@nerd unsubscribe <channel>\0
The list command returns a list of channels separated by newlines, where the channel name is the first word of a line, followed by the channel's description. The subscribe and unsubscribe commands can be used to start and stop the receipt of notifications for specified channels.
For example, to list all available channels, we can simply use the following command from the shell:
# echo -e '@nerd list\0' | \
socat - UNIX-CONNECT:/var/nagios/rw/nagios.qh
The output will be as follows:
hostchecks Host check results
servicechecks Service check results
opathchecks Host and service checks in gource's log format
The opathchecks channel for notifications can be used together with the Gource visualization tool to show the animated host and service check updates. This functionality is described later in the Displaying checks using Gource section in this chapter.
The hostchecks and servicechecks channels can be used to receive updates regarding changes in the host and/or service status. The format for the respective channels is as follows:
<hostname> from <old_code> -> <new_code>: <description>
<hostname>;<servicename> from <old_code> -> <new_code>: <description>
In the preceding command, <old_code> and <new_code> correspond to the exit codes for the check results.
For the host checks, the codes map is as follows:
|
Exit code |
Description |
|
0 |
UP |
|
1 |
DOWN |
|
2 |
UNREACHABLE |
For the service checks, the values are as follows:
|
Exit code |
Description |
|
0 |
OK |
|
1 |
WARNING |
|
2 |
CRITICAL |
|
3 |
UNKNOWN |
Once a socket is subscribed to a channel, updates regarding the hosts and/or services are sent, separated by newline characters. To read the status updates for hosts or services, simply subscribe to one or more channels and read from the socket line by line.
For example, the following code subscribes for both the host and service updates and prints the results accordingly:
#!/usr/bin/env ruby
require 'socket'
# mapping of status codes to textual form
svc_statuses = ["OK", "WARNING", "CRITICAL", "UNKNOWN"]
host_statuses = ["UP, DOWN", "UNREACHABLE"]
nagios_qh = "/var/nagios/rw/nagios.qh"
# connect to Nagios query handler and subscribe to channels
s = UNIXSocket.new(nagios_qh)
s.send "@nerd subscribe hostchecks\0", 0
s.send "@nerd subscribe servicechecks\0", 0
while true
line = s.gets
if i = line.match(/(.*?);(.*?) from ([0-9]+) -> ([0-9]+): (.*)$/)
# chek if this is a service check status
status = i[4].to_i
status = 3 if status < 0 || status > 3
status = svc_statuses[status]
puts "Service #{i[2]} on #{i[1]} is #{status}: #{i[5]}"
elsif i = line.match(/(.*?) from ([0-9]+) -> ([0-9]+): (.*)$/)
# otherwise check if this is host check status
status = i[3].to_i
status = 2 if status < 0 || status > 2
status = host_statuses[status].to_s
puts "Host #{i[1]} is #{status}: #{i[4]}"
end
end
The code uses regular expressions to parse the lines. It first tries to parse the result as service status updates and then checks if it matches the host status expression.
Please note that the code is mainly meant for demonstration and is far from being a complete example. A final application that uses NERD to receive notifications should handle the case when the socket is closed and retry connecting back to Nagios to handle cases such as the restart of Nagios.
Displaying real-time status updates
The first and most common use case for the NERD service is in the applications that display the host and service status in real time. This requires you to connect to the Nagios query handler, send a subscription command, receive updates, and show them.
We will now write such a tool using Tcl as the programming language. The reasons are that it comes with an easy-to-use GUI Tk framework and uses event-driven programming, which makes it easier to handle the reading of events.
First, let's start off with creating the GUI elements—a treeview widget (documented in detail at http://www.tcl.tk/man/tcl/TkCmd/ttk_treeview.htm) and a scrollbar—and configuring all of the columns using the following code:
#!/usr/bin/env wish8.5
set nagios_qh "/var/nagios/rw/nagios.qh"
wm title . "Nagios real-time status"
# create a treeview widget
set t [ttk::treeview .l -height 40 \
-columns {status time info} \
-yscrollcommand {.scroll set}]
# configure columns and colors
$t column #0 -stretch 0
$t column status -width 100 -stretch 0
$t column time -width 160 -stretch 0
$t column info -width 200 -stretch 1
$t heading #0 -text "Name"
$t heading status -text "Status"
$t heading time -text "Time"
$t heading info -text "Details"
# create background mappings for each state
$t tag configure bgOK –background "#00ff00"
$t tag configure bgWARNING –background "#bbaa00"
$t tag configure bgCRITICAL –background "#00ff00"
$t tag configure bgUNKNOWN –background "#00ff00"
$t tag configure bgUP –background "#00ff00"
$t tag configure bbDOWN –background "#ff0000"
$t tag configure bgUNREACHABLE –background "#999999"
# create an associated scrollbar
ttk::scrollbar .scroll -command {.l yview}
pack $t -side left -fill both -expand 1
pack .scroll -side right -fill y
The preceding code will initialize a treeview widget and configure three columns in addition to the default one to show the status, the time at which an event was received, and the event details.
The treeview widget and many other widgets in Tk use tags to indicate how an item should be displayed. The preceding code creates tags with bg prefixes and the names of all known states and changes their color. For example, all items with bgOK have their -background option set as #00ff00, which is green.
Next, create a code that handles communication with Nagios and stores the state of currently known hosts and services:
# load ceptcl package for Unix domain sockets
package require ceptcl
set s [cep -domain local -type stream $nagios_qh]
fconfigure $s -translation binary -blocking 0
puts -nonewline $s "@nerd subscribe hostchecks\0"
puts -nonewline $s "@nerd subscribe servicechecks\0"
flush $s
The preceding code creates a socket to the Nagios query handler to read the host and service check updates. Next, create a code that will handle the reading of data from Nagios:
# variable that will store map for hosts and services
set results [dict create]
proc readdata {} {
global s results
if {[gets $s line] > 0} {
set now [clock format [clock seconds] \
-format "%Y-%m-%d %H:%M:%S"]
if {[regexp \
{^(.*?);(.*?) from ([0-9]+) -> ([0-9]+):\s+(.*?)$} \
$line - host svc old_status status info]} {
set status [lindex {OK WARNING CRITICAL UNKNOWN} $status]
dict set results $host $svc [list $status $now $info]
} elseif {[regexp \
{^(.*?) from ([0-9]+) -> ([0-9]+):\s+(.*?)$} \
$line - host old_status status info]} {
set status [lindex {UP DOWN UNREACHABLE} $status]
dict set results $host @ [list $status $now $info]
}
updateWidget
}
}
fileevent $s1 readable readdata
The preceding code uses the global results variable that stores all the host and service results as a dictionary data type. It will use the host name as a key and keep a dictionary for the host information and services.
The subdictionary for each host will keep a mapping of service names (where @ will be used as a key to store the host information) and the value will be a list that consists of the status, update time, and details—the same as the columns in treeview, since it will allow us to pass the same information to the widget directly.
The fileevent command specifies commands to run whenever data can be read from the socket. The command then uses the global variable s to access the Nagios socket. It tries to parse each line using regular expressions and if it matches the pattern of the service or host check notifications, it is stored in the dictionary. The regular expression syntax in Tcl is documented in detail at http://www.tcl.tk/man/tcl8.5/TclCmd/re_syntax.htm. It also calls updateWidget, which will add or update the items in the tree.
Look at the following code:
array set id {}
proc updateWidget {} {
global results t
global id
foreach host [dict keys $results] {
# check if host status is known; if not
# then assume unknown status
if {[dict exists $results $host @]} {
set info [dict get $results $host @]
} else {
set info [list UNKNOWN "" {No data}]
}
set status [lindex $info 0]
# create item in list if it does not exist yet
# use host name as identifier for storing ID
# of the item in the list
if {![info exists id($host)]} {
set id($host) [$t insert {} \
[getInsertIndex $t {} $host] \
-text $host -open true]
}
# update values for columns and tag for color
$t item $id($host) -values $info -tags bg$status
set hostSvc [dict get $results $host]
foreach svc [dict keys $hostSvc] {
# skip host information if set
if {$svc == "@"} {continue}
# use host,svc as identifier for storing
# ID of the item in the list
set svcid ${host},${svc}
set info [dict get $results $host $svc]
set status [lindex $info 0]
# create item in list if it does not exist yet
if {![info exists id($svcid)]} {
set id($svcid) [$t insert $id($host) \
[getInsertIndex $t $id($host) $svc] \
-text $svc]
}
# update values for columns and tag for color
$t item $id($svcid) -values $info -tags bg$status
}
}
}
The preceding code iterates through all keys in the results variable, which are the host names. It then tries to get the host information by checking whether the @ key exists; if it does, it gets the host information from the dictionary, otherwise, it takes a reasonable default value that the host status is UNKNOWN and the description is No data. Then, it checks if the host was already added to the treeview widget—if it wasn't, the host is added. Next, the remaining columns' information and tags are changed to reflect the latest status.
Next, the same is done for each host's services. The code iterates through all known services for the host. If the name is @, which stores the host information, it is ignored, otherwise, a check is made whether a service with this name was already added to thetreeview; if not, the service is added. Then, status of the tags and the remaining columns' information is updated.
The code uses the global array id to store the mapping of hosts or services to IDs for the treeview items. For hosts, the key for the array is the host name. For services, it is hostname;servicename, such as gateway;PING for the PING service on the gateway host.
Information about hosts and services may be updated in a random order. While inserting, the getInsertIndex command is used to determine at which index the new item should be inserted. The code is very simple and is as follows:
proc getInsertIndex {t parent text} {
set idx 0
foreach o [$t children $parent] {
if {[string compare –nocase $text \
[$t item $o -text]] <= 0} {
return $idx
}
incr idx
}
return end
}
It takes all the children of the specified parent and compares the new item's text with the current item's text. If the item to be inserted is lexicographically less than the current item at the index of the idx, then the new item should be inserted at this point. If there are no children or all current items are lexicographically less than the items to be inserted, the special index end is returned, which indicates that a new item should be added at the end.
The application should now work properly. After opening it, the list will show as empty, but after leaving the application running for some time, it will receive notifications about new check statuses, and the GUI will show a more complete list of hosts and services.
The application should now look similar to the following screenshot:
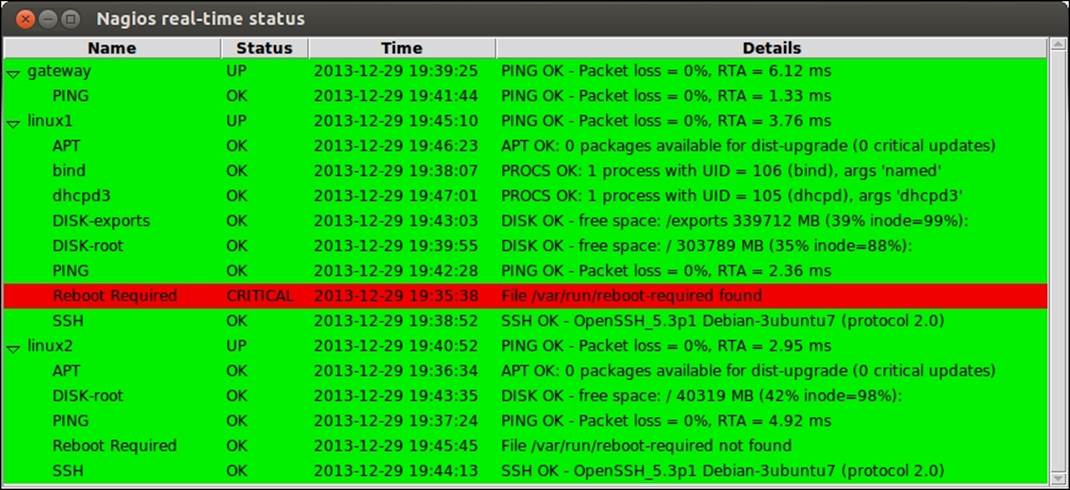
The precious code is not a complete application to display updates, but rather a demonstration of how such an application can be written.
The main issue is that it does not try to reconnect to the Nagios query handler, so it will not handle the restart of Nagios properly.
Handling the restart of Nagios properly can be done if you move the socket creation to a command and retry if it fails, as shown in the following code snippet:
proc connectToNagios {} {
global s
# catch errors connecting to Nagios
if {[catch {
set s [cep -domain local -type stream $nagios_qh]
}]} {
# retry after 10 seconds
after 10000 connectToNagios
return 0
} else {
fconfigure $s -translation binary -blocking 0
puts -nonewline $s "@nerd subscribe hostchecks\0"
puts -nonewline $s "@nerd subscribe servicechecks\0"
flush $s
fileevent $s1 readable readdata
return 1
}
}
Now, whenever connectToNagios is invoked, it will try to connect, and if it fails, it will try to connect again. It also returns whether the connection succeeded. As only the readable event handles the data from the channel, the rest of the code can stay the same.
Next, we need to run the connectToNagios command at the application's startup, which will also report an error if the first attempt to connect fails:
if {![connectToNagios]} {
puts "Unable to connect to Nagios query handler"
exit 1
}
Printing the error and exiting will make it easier to troubleshoot cases where the application cannot connect to the Nagios query handler due to permissions or an incorrect query handler path.
Finally, we need to change the readdata command to detect end-of-file events and reconnect after 10 seconds, as shown in the following code:
proc readdata {} {
global s results
if {[gets $s line] > 0} {
set now [clock format [clock seconds] \
-format "%Y-%m-%d %H:%M:%S"]
if {[regexp \
{^(.*?);(.*?) from ([0-9]+) -> ([0-9]+):\s+(.*?)$} \
$line - host svc old_status status info]} {
set status [lindex {OK WARNING CRITICAL UNKNOWN} $status]
dict set results $host $svc [list $status $now $info]
} elseif {[regexp \
{^(.*?) from ([0-9]+) -> ([0-9]+):\s+(.*?)$} \
$line - host old_status status info]} {
set status [lindex {UP DOWN UNREACHABLE} $status]
dict set results $host @ [list $status $now $info]
}
updateWidget
} elseif {[eof $s]} {
# if EOF was detected, try to close the socket
# and reconnect after 10 seconds
catch {close $s}
after 10000 connectToNagios
}
}
With the current approach, the application will start showing the host and service statuses when new updates are sent by NERD. A possible improvement is to read the status.dat file when the program is first run to get current information on all hosts and services. The check could be done whenever a connection is made to the Nagios query handler. It should also remove all hosts and services that are no longer present in the status.dat file in the treeview widget. However, as this code would become much more complex to maintain, it is beyond the scope of this book.
Displaying checks using Gource
An interesting feature of NERD is the opathchecks channel, which sends out updates that can be used in conjunction with Gource. The application and more details about it can be found at http://code.google.com/p/gource/.
It is an open source application that was originally designed to show the animation of source code changes for specific files. It also supports the animated and/or real-time display of any set of changes using a custom log format (documented in detail athttp://code.google.com/p/gource/wiki/CustomLogFormat).
The opathchecks channel provides updates about hosts and services in a format that matches the custom log format for Gource, so it can be passed directly to it. Each notification about the check status is sent as a separate line, similar to the hostchecks andservicechecks channels.
Each line consists of the following fields, separated by a vertical bar (|):
|
Field |
Example |
Description |
|
Timestamp |
1388339291 |
This is the Unix timestamp at which the change took place. |
|
Username |
Core Worker 12701 |
This is the name of the user who made the change. |
|
Type |
M |
This is the operation type and can be one of A - added, M - modified, or D - deleted. Nagios always reports M type. |
|
Path |
linux1/bind |
This is the oath of the updated file/object; for Nagios, it is <hostname>/_HOST_ or <hostname>/<service>. |
|
Color |
FFFF00 |
This is the color in the hex (FFFFFF) RGB format. |
While the fields were originally meant to view changes in the source code, the way Nagios works can also be visualized as shown in the preceding table's Example column.
For example, a sample set of updates looks like the following output:
1388339291|Core Worker 12701|M|linux1/bind|AAAAAA
1388339295|Core Worker 12701|M|linux1/PING|AAAAAA
1388339304|Core Worker 12698|M|linux1/Reboot Required|AAAAAA
1388339491|Core Worker 12698|M|linux2/_HOST_|FFFF00
As the notifications for the opathchecks channel match the format for Gource, it can simply be passed as a standard input. In order to use Gource to view the results in real time, we can simply run the following shell script:
# (echo -e '@nerd subscribe opathchecks\0' ; sleep 10000d) \
| socat - UNIX-CONNECT:/var/nagios/rw/nagios.qh \
| gource --realtime --log-format custom -
The first line of the preceding code will write the command to @nerd to subscribe to the opathchecks channel. It will then wait indefinitely (10000d means approximately 27 years, which is a safe value) so that the socat command does not assume it should close the connection.
After running the application for some time, it will show how the Nagios worker processes perform the monitoring along with the groups of hosts and their services, as shown in the following screenshot:
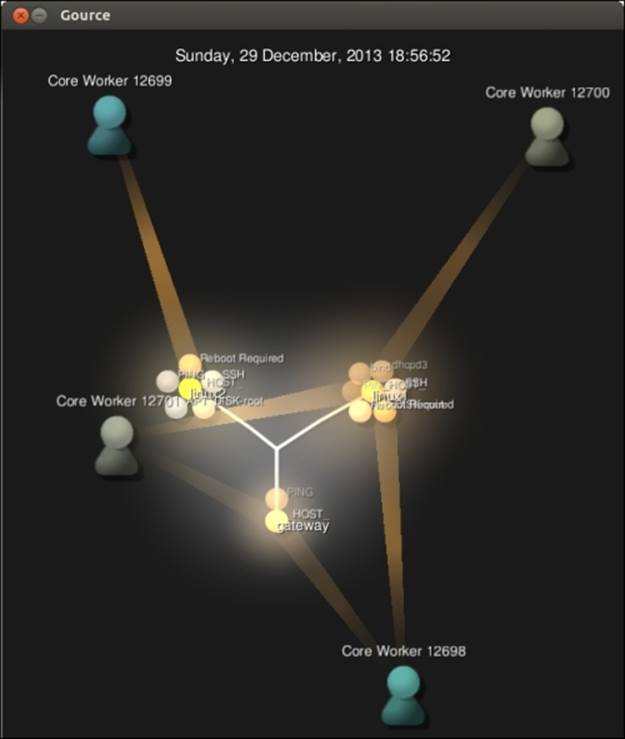
The application will show a 3D animation of the updates for the status checks in real time. The GUI can also be controlled using the mouse—the wheel to zoom in and out, and left/right-click buttons to pan and rotate the view.
It is also possible to store a history of notifications and replay it later with the Gource application. To store the output from the opathchecks channel, simply run the following command:
# (echo -e '@nerd subscribe opathchecks\0' ; sleep 10000d) \
| socat - UNIX-CONNECT:/var/nagios/rw/nagios.qh \
>/path/to/output.txt
At any time, we can break it by pressing the Ctrl + C keys.
Next, in order to replay it with the gource command, simply run the following command:
| gource --log-format custom /path/to/output.txt
In this mode, it is also possible to pause and resume the animation as well as move the time of the animation back and forth using the timeline at the bottom of the window.
Summary
Nagios 4 provides a query handler, which can be used for two-way communications with Nagios. It is used internally by Nagios worker processes. It can also be used by external applications for getting and setting data
In this chapter, we learned what the query handler is and how to communicate with it using the Unix domain sockets. We also learned about the services that the query handler provides in Nagios 4.
We learned how to query the Nagios scheduled tasks queues and load control settings. We also found out how to change the load control settings, although we do not recommend that you do so, as they are internal settings.
We also learned how to use NERD to receive notifications about changes in the host and/or service status. We created a sample application that shows the changes in real time. In addition, we connected Nagios and the NERD notifications with the Gource application that can be used to show animated, real-time visualization of the changes in status.
This chapter concludes the book. You are encouraged to run examples that were shown throughout as well as experiment on your own with Nagios. We hope that the book will be the beginning of your journey into IT monitoring and, in particular, into Nagios.
All materials on the site are licensed Creative Commons Attribution-Sharealike 3.0 Unported CC BY-SA 3.0 & GNU Free Documentation License (GFDL)
If you are the copyright holder of any material contained on our site and intend to remove it, please contact our site administrator for approval.
© 2016-2026 All site design rights belong to S.Y.A.