Thinking with Data (2014)
Chapter 2. What Next?
With a basic understanding of the four areas of a project scope (context, needs, vision, and outcome), we turn our attention to filling in the details of the project. By thinking deeply before digging into the data, we maximize our chances of doing something useful as opposed to simply the first things that come to mind.
Working with data is a process that you lose yourself in. There is a natural tension between going into exploration as quickly as possible and spending more time thinking and planning up front. When balanced properly, they are mutually beneficial. However, diving in quickly and getting lost in the data exerts a natural siren song on those of us who work with data professionally. It takes effort and patience to put time into thinking up front, but it is effort that is duly rewarded.
Before we start down rabbit holes that may or may not take us somewhere useful, and after we have a rough project scope, we need to take some more steps to clarify the details of the problem we are working on. That process is the focus of this chapter. This includes important discussions with decision makers and implementers, figuring out how to define key terms, considering what arguments we might make, posing open questions to ourselves, and deciding in what order to pursue different ideas.
There is no particular order to these steps. A project might be so simple that every area is obvious and we don’t need to engage with anybody else or do any more thinking before we dive into the data work. This is rare. More than likely, there will be things that need clarification in our own heads (and in the minds of others) to avoid wasted effort.
It’s possible to know everything you need to know for a small, personal project before you even begin. Larger projects, which are more likely to cause something important to change, always have messier beginnings. Information is incomplete, expectations are miscalibrated, and definitions are too loose to be useful. In the same way that the nitty-gritty of data science presumes messier data than is given for problems in a statistics course, the problem definition for large, applied problems is always messier than the toy problems we think up ourselves.
As we move on to the rest of the project, it’s critical to remember to take careful notes along the way. There are minor intellectual and technical decisions made throughout a project that will be crucial in writing the final documentation. Having a final, written version of the work we do means a much greater chance to reproduce our work again months or years down the line. It also means we are more likely to catch our own errors as we put our ideas down into words.
Refining the Vision
The vision we expressed in our first pass at a scope is often sufficient to get started, but not complete enough to guide our actions.
We refine our vision by improving our intuition about the problem. We improve our intuition by talking to people, trying out ideas, gathering questions, and running simple experiments. We want to spend time up front maximizing our understanding. It pays to make our early work investigative rather than definitive.
Pointed questions explore the limits of our current knowledge, and focusing on question generation is a good use of time. Good questions also offer up new ways to frame a problem. At the end of the day, it is usually how we frame the problem, not the tools and techniques that we use to answer it, that determine how valuable our work is.
Some of these questions will be preliminary and serve to illustrate the breadth of the problem, such as knowing whether there are ten thousand or ten million purchases per month to study. Others will form the core of the work we are looking to undertake, such as how exactly those purchases are related over time for the same customer.
One technique for coming up with questions is to take a description of a need or of a process that generated our data and to ask every question that we can think of—this is called kitchen sink interrogation. In a kitchen sink interrogation, we are generating questions, not looking for answers. We want to get a sense of the lay of the land. A few minutes up front can save days or weeks down the line.
If our customers leave our website too quickly, why do they leave? What does it mean to leave? At what points do they leave? What separates the ones who leave from the ones who stay? Are there things that we have done before that have changed customer behavior? Are there quick things we can try now? How do we know what their behavior is? How reliable is that source? What work has already been done on this problem?
If we’re trying to understand user engagement, what metrics are already being used? Where do they break down? What are they good at predicting? What are some alternative metrics that we haven’t looked at yet? How will we validate what a good metric is? By collecting questions with a kitchen sink interrogation, we start to get a sense for what is known and what is unknown.
Another technique, working backward, starts from the mockups or argument sketches and imagines each step that has to be achieved between the vision and where we are right now. In the process of working backward, we kick up a number of questions that will help to orient us. When we’re lucky, we will figure out that a certain task is not feasible long before we’ve committed resources to it.
The same techniques discussed in Chapter 1 do not go away once we have a basic sense of the vision. Mockups and argument sketches are continuously useful. Having a clear vision of what our goal looks like—whether it’s in the form of a sentence describing what we would learn or a hand-drawn sketch of a graph—is incredibly instructive in its production and a wonderful guiding light when we are deep in the trenches. Having a clear idea of what numbers we expect to come out of a process before we start it also means that we will catch errors right away.
We can also borrow tactics that we used to refine needs. Walking through a scenario or roleplaying from the perspective of the final consumer is a good way to catch early problems in our understanding of what we are aiming at. If we are producing a map or a spreadsheet or an interactive tool, there is always going to be someone on the other side. Thinking about what their experience will be like helps keep us focused.
Once results start to come in, in whatever form makes sense for the work we are doing, it pays to continually refer back to this early process to see if we are still on track. Do these numbers make sense? Is the scenario we envisioned possible?
TECHNIQUES FOR REFINING THE VISION
Interviews
Talk to experts in the subject matter, especially people who work on a task all the time and have built up strong intuition. Their intuition may or may not match the data, but having their perspective is invaluable at building your intuition.
Rapid investigation
Get order of magnitude estimates, related quantities, easy graphs, and so on, to build intuition for the topic.
Kitchen sink interrogation
Ask every question that comes to mind relating to a need or a data collection process. Just the act of asking questions will open up new ideas. Before it was polluted as a concept, this was the original meaning of the term brainstorming.
Working backward
Start from the finished idea and figure out what is needed immediately prior in order to achieve the outcome. Then see what is prior to that, and prior to that, and so on, until you arrive at data or knowledge you already have.
More mockups
Drawing further and more well-defined idealizations of the outcome not only helps to figure out what the actual needs are, but also more about what the final result might look like.
Roleplaying
Pretend you are the final consumer or user of a project, and think out loud about the process of interacting with the finished work.
Deep Dive: Real Estate and Public Transit
An extended example will be instructive. Suppose that a firm in New York that controls many rental properties is interested in improving its profitability on apartment buildings it buys. It considers itself a data-driven company, and likes to understand the processes that drive rental prices. It has an idea that public transit access is a key factor in rental prices, but is not sure of the relationship or what to do with it.
We have a context (a data-driven New York residential real estate company) and a vague need (it wants to somehow use public transit data to improve its understanding of rental prices). After some deep conversation, and walking through scenarios of what it might do if it understood how transit access affects rental prices, it turns out the company actually has several specific needs.
First and simplest, it wants to confirm its hunch that rental prices are heavily dependent on public transit access in New York. Even just confirming that there is a relationship is enough to convince the company that more work in this area is warranted. Second, it wants to know if some apartments may be under- or overpriced relative to their worth. If the apartments are mispriced, it will help the company set prices more effectively, and improve profitability. And third, the company would love to be able to predict where real estate prices are heading.
Note that the latter two needs did not mention public transit data explicitly. It may turn out in the process of working with this data that public transit data isn’t useful, but all the other data we dig up actually is! Will the real estate company be disappointed? Certainly not. Public transit data will be the focus of our work, but the goal isn’t so much to use public transit data as it is to improve the profitability of the company. If we stick too literally to the original mandate, we may miss opportunities. We may even come up with other goals or opportunities in the course of our analyses.
Before we go too far, what is our intuition telling us? Knowing the subject matter, or talking to subject matter experts, is key here. Reading apartment advertisements would be a good way to build up an understanding of what is plausible. Apartment prices probably are higher close to transit lines; certainly listings on real estate websites list access to trains as an amenity. Putting ourselves in the shoes of someone getting to work, we can realize that the effect likely drops off rapidly, because people don’t like to walk more than 10 or 15 minutes if they can help it. The effects are probably different in different neighborhoods and along different transit lines, because different destinations are more interesting or valuable than others.
Moving on to the vision, we can try out a few ideas for what a result would look like. If our final product contained a graph, what would it be a graph of? Roughly speaking, it would be a graph of “price” against “nearness to transit,” with price falling as we got farther away from transit. In reality it would be a scatterplot, but drawing a line graph is probably more informative at this stage. Actually sketching a mockup of a basic graph, with labels, is a useful exercise (Figure 2-1).
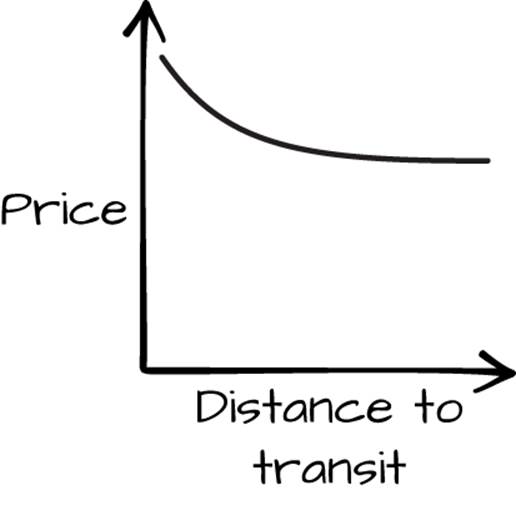
Figure 2-1. Mockup graph
We can recognize from this that we will need some way to define price and proximity. This presentation is probably too simple, because we know that the relationship likely depends on other factors, like neighborhood. We would need a series of graphs, at least. This could be part of a solution to the first two needs, verifying that there is a strong relationship between public transit and the housing market, and trying to predict whether apartments are under- or overpriced.
Digging into our experience, we know that graphs are just one way to express a relationship. Two others are models and maps. How might we capture the relevant relationships with a statistical model?
A statistical model would be a way to relate some notion of transit access to some notion of apartment price, controlling for other factors. We can clarify our idea with a mockup. The mockup here would be a sentence interpreting the hypothetical output. Results from a model might have conclusions like, “In New York City, apartment prices fall by 5% for every block away from the A train, compared to similar apartments.” Because we thought about graphs already, we know that one of the things we will need to control for in a model is neighborhood and train line. A good model might let us use much more data. For example, investigating the government data archives on this topic reveals that turnstile data is freely available in some cities.
A model has the potential to meet all three of our needs, albeit with more effort. Model verification would let us know if the relationship is plausible, outlier detection would allow us to find mispriced apartments, and running the model on fake data would allow us to predict the future (to some extent). Each of these may require different models or may not be plausible, given the data that is available. A model might also support other kinds of goals—for example, if we wanted to figure out which train line had the largest effect on prices.
If our vision is a transit map, it would be a heat map of apartment prices, along with clearly marked transit lines and probably neighborhood boundaries. There would need to be enough detail to make the city’s layout recognizable. Depending on the resolution of the map, this could potentially meet the first two needs (making a case for a connection and finding outliers) as well, through visual inspection. A map is easier to inspect, but harder to calibrate or interpret.
Each has its strengths and weaknesses. A scatterplot is going to be easy to make once we have some data, but potentially misleading. The statistical model will collapse down a lot of variation in the data in order to arrive at a general, interpretable conclusion, potentially missing interesting patterns. The map is going to be limited in its ability to account for variables that aren’t spatial, and we may have a harder time interpreting the results. Each would lend itself to a variety of arguments.
What we finally end up with will probably be more complicated than the basic things we outline here. There may actually be a combination of two or all three of these, or some output we haven’t considered yet; maybe a website that the firm can use to access the model predictions with a few knobs to specify apartment details, or a spreadsheet that encodes a simple model for inclusion in other projects. Any graph, model, or map we make for this project will depend on additional bits of analysis to back up their conclusions.
Another way to explain this process is to say that we begin with strong assumptions and slowly relax them until we find something we can actually achieve. A graph of price against proximity, or a user interface with two buttons, is almost certainly too simple to be put into practice. To make such a project work requires much stronger assumptions that we can make in practice. That shouldn’t stop us from trying to express our ideas in this kind of clean way. Sometimes the details, even when they take up most of our time, are only epicycles on top of a larger point that we will be worse off if we forget.
Don’t forget the utility of a few concrete examples in spurring the imagination. Before building a map, we should try plugging a few intersections into real estate websites to get a feel for how the aspects of homes might vary with distance and price. The same goes for reading classifieds. There may be entire aspects of apartments that were not obvious at first glance, like proximity to highly regarded schools, that will be mentioned in the apartment description and could have a huge effect on price. Always seek to immerse yourself in some particular examples, even if it just means reading the first 10 or 20 lines of a table in depth before building a model.
Always seek to immerse yourself in some particular examples, even if it just means reading the first ten or twenty lines of a table in depth before building a model.
Deep Dive Continued: Working Forward
Having imagined the end of our work, it is helpful to think about what kind of data is appropriate for defining the variables. Having spread our wings, it is time to get a little realistic and start working forward from what we have.
What will we use for apartment prices? It is common in the real estate industry to use price per square foot, to normalize against differences in apartment size. Finding historical price-per-square-foot data across an entire city may be as simple as purchasing a database, or it could be a much more involved process of connecting public and private data together.
And what is transit access? Note that, despite the easy way we were able to draw that initial graph, it is not clear at first blush how to even define the term transit access! A little kitchen sink interrogation is useful here.
First, what is transit? The initial conversation was sparked from subway lines. Do buses count? Bus access will be much harder to show on a map than train access, but buses are a necessity in areas that are less well connected to trains. Knowing where the company actually operates might be useful here. How long do people actually walk? Where do people in each neighborhood actually go? Is that information available? Are there people we could talk to about getting end-to-end transit data, maybe from existing surveys? Could employment records be useful?
“Transit access” itself could be about walking distance to train or bus lines, or it could be about average travel time from a point to important landmarks, like the Empire State Building or Wall Street in New York City. Which one we pick will make a big difference!
In refining the vision we can also recognize that this is a causal question of sorts (how much does being near a subway station increase prices compared to an identical apartment that was farther away?), and therefore calls for a causal argument pattern. Chapters 4 and 5 cover argument patterns in detail, but for our purposes we can recognize that we will, at a minimum, need to acquire additional information to help distinguish the effect of proximity to transit from, say, higher prices on more luxurious apartments. More luxurious apartments may have been built closer to the subway to take advantage of the better location, and so on.
Further refining the vision, we know that apartment prices will be a continuous variable, neighborhood will probably be an important confounder, and each transit line will probably contribute a different amount. We will need locations of apartments and transit stops, information on subways accessed by each stop, and, if we build a model, a reasonable distance or travel time function to tie things together. If we want to understand how these things change over time, we will need not only a snapshot, but also a historical record. The breadth of making a full model starts to become clear in a way it might not have been at the start.
At this stage we may become aware of the limitations we are likely to face. It will probably be hard to encode an “apartment quality” measure. A proxy metric, like some sense of how recently or frequently an apartment was refurbished, requires additional data like city records. Our results may be hard to interpret without a great deal of work, but it may be good enough for our needs. And if we want to understand historical relationships between transit connectivity and apartment prices, we have to figure out how far back to go and how to handle the additional complexities inherent in working with time data.
Thinking hard about the outcome can clear this up. What will be different after we are done? Might the easiest need be sufficient for now? A more purely observational study would be fine. Or might there be enough buy-in to get this work widely used within the firm? And is the time component really that valuable? Each of these goals is different, the arguments that are needed are different, and they will call for different levels of investment of time and energy. If we don’t think about how the work will be used after we finish, we may end up working on something pointless.
Who will maintain this work after we finish? Keeping a map up-to-date is probably easier than a model with a dozen separate data sources. Are all the sources we are interested in available programmatically, or would we have to take weeks of time to get them again next year?
How will we know if we have done a good job? How do we cross-check our results? For example, we could look at how quickly or slowly each apartment was rented, as a way of verifying that we predicted over- or underpricing correctly. Naturally, this is complicated by the speed with which the rental market moves in a big city, but it is worth a thought nevertheless.
Deep Dive Continued: Scaffolding
Having elaborated our vision and what the pieces are that we plan to work with, the next step is to consider our project’s scaffolding. How can we go about our tasks so that at each step we can evaluate what is taking shape and see if we need to change direction? We want to avoid looking back in horror at having wasted our time on something useless.
Especially at the beginning, we want to find things to do that will be fast and informative. The simple truth is that we don’t know in advance what will be the right things to pursue; and if we knew that already, we would have little need for our work. Before we do anything slow, or only informative at the margins, we want to focus on building intuition—and eventually that means poking around with data.
If we have already collected some data, simple tabulations, visualizations, and reorganized raw data are the best way to quickly build intuition. Just combining and slicing various relevant data sets can be very informative, as long as we do not get stuck on this as our main task.
Models that can be easily fit and interpreted (like a linear or logistic model), or models that have great predictive performance without much work (like random forests), serve as excellent places to start a predictive task. Using a scatterplot of latitude and longitude points as a first approximation map is a great way to start a geospatial project. And so on.
It is important, though, to not get too deep into these exploratory steps and forget about the larger picture. Setting time limits (in hours or, at most, days) for these exploratory projects is a helpful way to avoid wasting time. To avoid losing the big picture, it also helps to write down the intended steps at the beginning. An explicitly written-down scaffolding plan can be a huge help to avoid getting sucked deeply into work that is ultimately of little value. A scaffolding plan lays out what our next few goals are, and what we expect to shift once we achieve them.
It also helps when we understand the argument or arguments we are looking to make. Understanding the outline of our argument will lead us to discover which pieces of analysis are most central. Chapter 3 discusses the details of arguments, including transformation, evidence, justifications, and arranging claims. These let us solve potentially complicated needs with data. With a sketch of the argument in place, it is easier to figure out the most central thing we need to work on. The easiest way to perform this sketching is to write out our ideas as paragraphs and imagine how we will fill in the details.
In the case of the apartment prices and public transit, finding or plotting a map of apartment prices next to a base layer of transit connections is probably the easiest thing to do first. By looking at the map, we can see whether such a relationship seems plausible, and start to gain intuition for the problem of making scatterplots or building a model.
Building exploratory scatterplots should precede the building of a model, if for no reason other than to check that the intuition gained from making the map makes sense. The relationships may be so obvious, or the confounders so unimportant, that the model is unnecessary. A lack of obvious relationships in pairwise scatterplots does not mean that a model of greater complexity would not be able to find signal, but if that’s what we’re up against, it is important to know it ahead of time. Similarly, building simple models before tackling more complex ones will save us time and energy.
Scaffolding is the art of prioritizing our aims and not going too far down that rabbit hole. How can we proceed in a way that is as instructive as possible at every step?
Verifying Understanding
In any scaffolding plan, it is important to build in explicit checks with the partners or decision makers to ensure that we understand their needs properly. It keeps us focused, and it builds trust. It is better to overcommunicate, especially with new partners, than it is to assume that we are on the same page for a week only to find we have built something pointless.
Find a convenient medium and explain the partners’ needs back to them, asking if you have understood things properly. Mention generally what your thoughts are around your vision, such as the form that the results would take, without going into too much detail. The goal is conceptual agreement, not a detailed critique of the project, unless they are data-savvy and particularly interested. The details will evolve throughout the project anyway.
Explicitly ask them if they agree that you have understood what they are looking for, and if they have any more questions. You should feel confident that you are doing something that they will use. This doesn’t need to be a formal meeting; it can often be accomplished with a quick conversation.
If one or more people will be needed to implement the final work, talk to them and make sure that their requirements are being represented. If someone else will be installing a script we create into production software, who will be in charge of cleaning it up and keeping it running? Talk to them and make sure that you understand what they need.
We will go through basically the same process on a regular basis for large projects, and at least when all the work is done for a project of any size, so pay attention to how these discussions go.
Partners and decision makers often have intuitive understandings of the processes they are looking to understand better, or at least have some idea of what concrete examples of what they’re interested in will look like. Intuition like that is invaluable, and should never be overlooked. Spending lots of time talking to people who deal with a process is a smart way to get the intuition needed to build a data-based argument that can create real knowledge.
We know that we have grasped the problem well when we can explain our strategy to these partners in terms that matter to them (even if they have no knowledge of data science), and we receive back enthusiastic understanding.
Getting Our Hands Dirty
Once we have data, we may find that our initial ideas were wrong or that the need can be met even more easily than we thought. Regardless, thinking explicitly before we dive into them will make what we do far more productive.
We need to spend time data gathering: actually acquiring the data we will need. This step might be easy, or it may take a long time. We might have one database or API call, or we may need to strategize about how to store all the data we will require. We may need to contact people in positions of authority in order to acquire data. We may need to make trade-offs of accuracy against price or time to acquire new data.
Once some data is gathered, we can begin the transformations. We usually put raw data into a common format, then transform the data into graphs, models, tables, and summaries that can serve as evidence for a larger argument. These steps can take the longest amount of time. As part of the scaffolding, we should plan to start with easy transformations (like exploratory graphs or summary statistics) and then easy models, before moving on to more sophisticated or complicated models. Often, easy transformations will serve well enough to make a valid argument and additional work is not necessary.
Once the data is transformed and ready to serve as evidence, we can evaluate the strength of our arguments. By updating the few paragraphs we wrote out at the beginning with new information, we will know if what we have done fits into the larger goal or not. Is there another thing we forgot to justify or that we need to explore? Do we need to continue on to make a more complicated model? Are there alternative interpretations of what we have found that require us to find something else to help us decide between them? Does this argument even make any sense, given the data we have collected?
Say, for example, that we’re outlining our argument to ourselves after collecting public transit and apartment price, and we realize that we’re not sure if we have an unbiased sample of apartments. We have choices; do we want to acknowledge that bias and claim the conclusions to be more limited? Or do we perhaps want to make an argument as to why the data we have is actually representative of the city as a whole? We might find that most apartments are actually listed on Craigslist, or that, for the demographic that will be interested in using this information, nearly all apartments are listed on Craigslist. Strong arguments will rarely consist only of a single piece of evidence, though other strands of the arguments around them may be implied or gestured at.
After we have arrived at a useful point, we can arrange the results into a pleasing form, keeping in mind the needs of our audience. Will we only show the most damning graph, or does it make more sense to present a chorus of models and summaries? Should we present a series of claims each chained to another, or present a number of claims in parallel? If we’re building a tool, which things should be optional and which fixed? If we’re writing a narrative, which examples should we use to reinforce our point?
Finally, we need to present what we’ve done. The actual written copy, the final form of the graphs, the neat table, the interactive tool with a carefully designed UI—these are all part of having a good presentation. Presentation matters tremendously. At the very least, there are genre conventions in every field that are worth following in order to be taken seriously; tone is important in presentation. Highly polished, beautiful graphics may be considered fussy in an academic setting, but are necessary for an earnings report for a design company. A very abstract problem presentation is inappropriate for a board meeting, but useful for demonstrating a technique to colleagues. And so on.
As in any creative field, working with data is not a linear process where we proceed from a grand statement of the problem at hand and gradually fill in the pieces until we are satisfied. Sometimes we are lucky and problems flow like that, but more often (and more interestingly), there is an interplay of clarification and action that slowly brings us to a better place than where we started.