HTML5 Games: Creating Fun with HTML5, CSS3, and WebGL (2012)
part 2
Creating the Basic Game
Chapter 6
Creating Graphics with Canvas
in this chapter
• Using canvas versus other methods
• Drawing with the canvas element
• Drawing paths and shapes
• Applying transformations to the canvas
• Modifying image data
This chapter shows you how to create dynamic graphics with the canvas element. It starts by giving you an overview of the ways in which you can display graphics and graphics on the web before diving into the canvas drawing API.
The meat of this chapter is all about how to use the canvas API. First you walk through the basics of drawing simple shapes and paths and applying various styles to the content. You learn how to use the canvas state stack to your advantage and see how to mix images and text content with graphics on the canvas.
You also learn how to use transformations to modify the way things are drawn and how to apply different compositing operations. Finally, the chapter rounds off the canvas tour by looking at how to use low-level pixel access to create some really interesting effects.
Graphics on the Web
In the past, all graphics on the web had to be represented by bitmap images in formats such as GIF or JPEG. More options are available today, so let’s start by looking at the options you have for displaying graphics on the web.
Bitmap images
Bitmaps are images defined by a rectangular grid of pixels. The traditional formats used on the web — JPEG, PNG, and GIF — are all bitmap formats. Bitmaps are perfectly adequate for many purposes. In some use cases, such as displaying photos, they are the only sensible choice. Theimg tag has been around since forever and has full support in all browsers.
The main disadvantages of bitmap images are that the images don’t scale well and that the content is static and non-interactive. Sure, animated image formats exist, but you cannot dynamically change the content of the images. Bitmap images don’t have much in terms of interactivity either. You can attach event handlers to the images, but the content is static and therefore can’t respond visually to user actions.
If you scale a bitmap image to a size that is larger than the original, some degradation in the quality of the image inevitably occurs. You have only so many pixels to work with, and the computer cannot intelligently decide what it should use to fill the voids. Computers typically employ one of two basic strategies when it comes to image rescaling. One is the nearest-neighbor strategy, which is fast but makes the image appear pixelated. The other is interpolation using, for instance, bilinear or bicubic algorithms. This is the default resampling method for all modern browsers, and it has a softening effect.
SVG graphics
Scalable Vector Graphics (SVG) is an alternative to bitmap graphics that is useful for displaying vector-based art. Because this format is based on XML, you can edit the files by hand, although many graphics applications also export directly to SVG format. The insides of an SVG file look something like this:
<svg xmlns=”http://www.w3.org/2000/svg” viewBox=”0 0 512 512”>
<path fill=”#E34F26” d=”M71,460 L30,0 481,0 440,460 255,512”/>
<path fill=”#EF652A” d=”M256,472 L405,431 440,37 256,37”/>
</svg>
You can also add images, text, and various shapes to an SVG file, but you have to declare all content in this XML format. In addition to graphical elements, you can declare basic animations and event handlers.
The SVG format is not brand new; the development of the SVG specification began in 1999. However, only recently have all major browser vendors added native support for it. Although you are able to modify the SVG content using DOM functions, there’s no nice API such as what thecanvas element provides. This brings me to the main topic of this chapter: the canvas element.
Canvas
One of the major, early features of the HTML5 specification was the canvas element. Web developers had long been looking for ways to create dynamic graphics, and canvas finally solved that problem. The canvas element provides a two-dimensional drawing surface with a rich JavaScript API for drawing all sorts of shapes, paths, and objects on that surface. The API is so full featured, actually, that a project such as canvg (http://code.google.com/p/canvg/) is able to provide a near-complete canvas-based SVG renderer.
A major difference between canvas and SVG is that the canvas API does what is known as immediate mode rendering in contrast to SVG’s retained mode. Immediate mode means that any content drawn on the canvas is immediately rasterized and rendered to the surface. The canvas does not maintain any sort of internal structure of the shapes and paths that have been drawn. As soon as you tell the canvas to draw, for example, a square, it does the job and then forgets all about what those pixels represent. An SVG image, on the other hand, always has an XML structure that describes exactly which elements make up the image.
Another feature that really sets canvas apart from SVG, for example, is the low-level access to pixel data. Because you can access and modify individual pixels, there really is no limit to what you can do with a canvas element. This is evidenced by the existence of ray tracers, imaging applications, as well as numerous experiments displaying amazing effects inspired by the demo-scene.
When to choose canvas
When to use canvas and when to opt for some other technology isn’t always clear. In many cases, there is no right answer, either. Regular bitmap images are still relevant, and if the content doesn’t rely on any dynamic data and is otherwise static, you’re often better off just using old-fashioned images.
If the content can be described by sufficiently simple elements, SVG can be a good alternative. The vector-based format makes it a good choice for graphics that need to scale to different sizes. The added bonus of being able to attach events and simple animations to elements makes SVG a nice option for both UI and game graphics. However, if the contents get too complicated with too many elements that are continuously added, modified, and removed, performance can be a problem.
Canvas really shines when you need fine-grained control over the output. With pixel-level data access, you can do things that are not possible with any other technology. One disadvantage of using canvas is that, even if many of its drawing functions are vector based, the output is a bitmap, subject to the same scaling issues as regular images. If you make the element bigger using CSS, the content still appears pixelated. However, because all the canvas-based graphics are created programmatically, you have the option of creating them in the best resolution at runtime.
An advantage of having bitmap-based output is that you don’t need to worry about how many times you add content to the canvas element. No matter how many shapes and images you add, the resulting canvas is always just a bitmap. You don’t need to worry about filling the canvaselement with too much content that could slow things down.
Drawing with Canvas
Let’s get started with the canvas element. You can create a new canvas element with JavaScript like any other DOM element:
var canvas = document.createElement(“canvas”);
document.body.appendChild(canvas);
Alternatively, you can declare it in the markup using the appropriate HTML tags:
<canvas id=”mycanvas”></canvas>
This approach creates a canvas element with the default dimensions 300x150 pixels. When created, the canvas is fully transparent. You can provide alternative fallback content by adding it as children of the canvas element:
<canvas id=”mycanvas”>
<h3>Sorry, this page requires a modern browser!</h3>
</canvas>
The browser renders only whatever you put inside the canvas tags if it has no canvas support, much the same way the contents of noscript tags are displayed only when JavaScript is disabled. This is an easy way to show a helpful message or, if possible, show a static image in place of the otherwise interactive or animated canvas content.
An important concept to understand when using canvas is the context object. The canvas element does not provide any graphics functionality by itself. It merely defines a two-dimensional surface and exposes a few properties for setting the dimensions:
canvas.width = 400;
canvas.height = 300; // the canvas is now 400x300 pixels
![]()
The dimensions of the canvas are not necessarily equal to its CSS dimensions. You can scale a canvas element to any width and height using CSS without any effect to the actual dimensions of the canvas. The content is simply stretched. In this regard, the canvas behaves very much like a bitmap image.
When you want to add graphics to this surface, you must do so via a context object created using the getContext() method on the canvas element:
var ctx = canvas.getContext(“2d”); // create a 2D context object
Note the parameter passed to the getContext() method. The canvas element allows for any number of context types with different interfaces to creating graphics on the canvas surface. Currently, the only other context is the WebGL context, which you can use to create 3D graphics. I show you more about WebGL in Chapter 11 . In this chapter, you use only the 2D context, which is also the only context documented in the canvas specification.
Drawing shapes and paths
Many of the canvas drawing functions use the same path API to define paths of points that make up the shape you want to draw. You initiate a new path by calling the ctx.beginPath() method on the context object. Invoking this method also clears any previously added path data.
You have a number of different functions available for adding path segments. The most basic path function simply adds a line segment. Listing 6.1 shows an example of how to begin a new path and create a rectangle.
Listing 6.1 Adding a Rectangle Path
ctx.beginPath();
ctx.moveTo(150, 200);
ctx.lineTo(250, 200);
ctx.lineTo(250, 230);
ctx.lineTo(150, 230);
ctx.closePath();
A path is always made up of a number of subpaths. The first path function called in Listing 6.1 is ctx.moveTo(), which creates a new subpath with a single point at the specified coordinates. The ctx.lineTo() method moves the position, adds a new point, and connects it to the previous position with a line.
![]()
If you do not call moveTo() to create the subpath, it is automatically created when, for example, lineTo() is called. However, because no starting position is defined, that lineTo() call only moves the position and does not actually add a line.
When you are done adding segments to the path, you can close the path using the ctx.closePath() method of the context object. Adding this method creates a final line segment from the current position to the position of the first point. The example in Listing 6.1 uses this feature to add the fourth and final edge of the rectangle. The ctx.closePath() call is optional because you might not always want to close the path.
You should not use the ctx.beginPath() method to create additional subpaths because that function clears all path data before creating the new path. If you want to add more subpaths to the current path, you can do this by calling the ctx.moveTo() method.
Fills and strokes
Now that the path is defined, you can draw it to the canvas surface. The canvas path API has two different methods for converting the path to graphics: ctx.fill() and ctx.stroke(). As you might have guessed, ctx.fill() fills the inside of the path with a color, and ctx.stroke() draws only the edges. The color used for each of these methods is set using the ctx.fillStyle and ctx.strokeStyle properties of the context object:
ctx.fillStyle = “#aaeeaa”; // light green fill color
ctx.strokeStyle = “#111155”; // dark blue stroke color
Colors can be specified using any valid CSS color, meaning that hexadecimal format, color keywords, rgb(...), hsl(...), and so on are accepted. Aside from the color, you can also set the width of the stroke with the ctx.lineWidth property:
ctx.lineWidth = 5.0; // thicker stroke
When you are done setting up the path and have defined the fill and stroke styles, finish the job by calling ctx.fill() and/or ctx.stroke(). Listing 6.2 shows a basic example.
Listing 6.2 Drawing a Triangle
<canvas id=”canvas” width=”250” height=”250”></canvas>
<script>
var canvas = document.getElementById(“canvas”),
ctx = canvas.getContext(“2d”);
ctx.beginPath();
ctx.moveTo(125, 50);
ctx.lineTo(200, 200);
ctx.lineTo(50, 125);
ctx.closePath();
ctx.fillStyle = “rgba(255,150,50,0.5)”;
ctx.fill();
ctx.strokeStyle = “red”;
ctx.lineWidth = 2.0;
ctx.stroke();
</script>
The resulting triangle is shown in Figure 6-1. You can find this example in the file 01-triangle.html.
Figure 6-1: Drawing a triangle
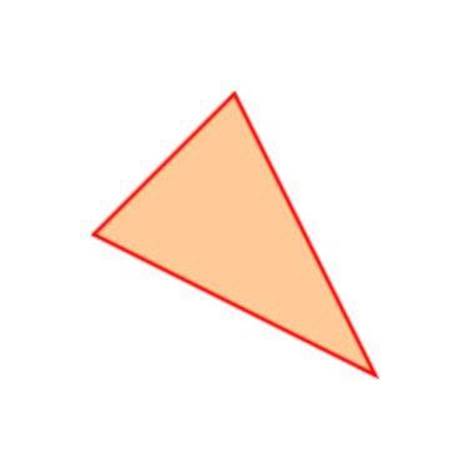
Mind the transparency if you are using both the ctx.stroke() and ctx.fill() methods on the same path. When you stroke the path, the line is drawn with the path in the center of the line. This means that half the stroke is drawn on the inside and the other half is drawn on the outside. If either the fill or stroke color is non-opaque, it is usually a good idea to draw the transparent part first to avoid unwanted blending near the edge. In the example in Listing 6.2, the ctx.stroke() method is called after ctx.fill() to avoid just this pitfall.
There is a small gotcha regarding horizontal and vertical line segments. Because strokes are drawn with the path in the center of the stroke, a 1-pixel-wide vertical line would have half a pixel on the left side and half a pixel on the right side. Now, that doesn’t work because there is no such thing as half a pixel. The result is that a semitransparent 2-pixel-wide line is used instead. This result may or may not be what you want, but an easy fix is to add 0.5 to both the x and y coordinates of the points, thereby making the line centered on the center of the pixel.
Rectangles
Drawing something like a rectangle is pretty easy using just ctx.moveTo() and ctx.lineTo() calls, but it would be a bit tedious to go through that procedure every time you need something trivial like that. Fortunately, the ctx.rect() method does the same job with less typing:
ctx.beginPath();
ctx.rect(150, 200, 100, 30);
ctx.fillStyle = “rgba(255,150,50,0.5)”;
ctx.fill();
Rectangles are fairly common, and if you just want to draw a single rectangle, there is an even simpler way. The ctx.fillRect() method takes four parameters that define a rectangle that should be filled using the current ctx.fillStyle:
ctx.fillStyle = “rgba(255,150,50,0.5)”;
ctx.fillRect(150, 200, 100, 30);
A similar shortcut exists for stroking rectangles:
ctx.strokeStyle = “red”;
ctx.strokeRect(150, 200, 100, 30);
A third variant of the rectangle function, ctx.clearRect(), takes the same four parameters, but instead of drawing, it clears the area. All pixels in the specified rectangle are set to black with the alpha channel set to 0, that is, fully transparent:
ctx.clearRect(150, 200, 100, 30);
If you want to clear the entire canvas, you can just set either the width or height property on the canvas element. Even setting the value to itself triggers a canvas reset:
canvas.width = canvas.width; // canvas is now cleared
Any time you write to one of these properties, the contents of the canvas are cleared back to the initial transparent state. Be careful, though. Resetting the canvas this way also clears fill and stroke styles, for example, as well as transformations and clipping paths, which you hear more about later.
Note that ctx.fillRect(), ctx.strokeRect(), and ctx.clearRect() are independent from the path API and do not require you to set up a path before using them. They also do not interfere with any current path data, so it is safe to call them while setting up and drawing other paths.
Arcs and circles
Straight lines and rectangles get you only so far. You also can add arc segments with the aptly named arc() function:
ctx.arc(x, y, radius, startAngle, endAngle, ccw)
This function adds a circular arc segment to the current subpath. It does so by using an imaginary circle with the specified radius and a center in the point (x, y). A segment of the circumference of this circle is then added to the subpath. The startAngle and endAngle parameters define which segment of the circumference to add. The last parameter, ccw, is a boolean value that indicates which direction around the imaginary circle the rasterizer should travel to get from startAngle to endAngle. If it is set to true, the counterclockwise direction is used; otherwise, it travels clockwise.
![]()
Both startAngle and endAngle are measured in radians. The number of radians in a full circle is equal to 2 Pi. If you are more comfortable working with degrees, you can convert degrees to radians by multiplying by 180 divided by Pi.
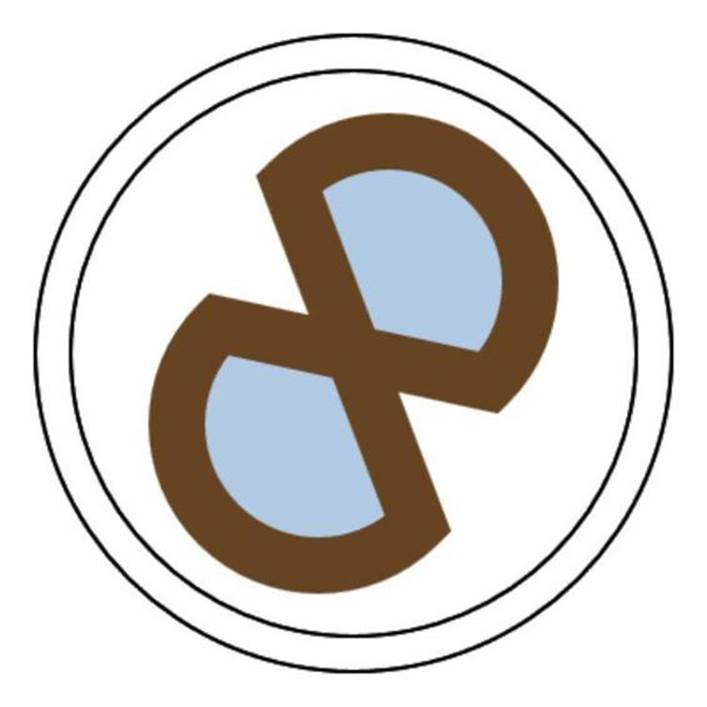
Listing 6.3 shows an example of how to draw arc segments.
Listing 6.3 Drawing Arcs
<canvas id=”canvas” width=”250” height=”300”></canvas>
<script>
var canvas = document.getElementById(“canvas”),
ctx = canvas.getContext(“2d”);
ctx.fillStyle = “rgba(100,150,200,0.5)”;
ctx.beginPath();
ctx.arc(180, 240, 80, 0.25 * Math.PI,
1.25 * Math.PI, false);
ctx.arc(220, 160, 80, 0.25 * Math.PI,
1.25 * Math.PI, true);
ctx.closePath();
ctx.fill();
ctx.lineWidth = 32;
ctx.strokeStyle = “#664422”;
ctx.stroke();
</script>
When adding an arc segment to an existing subpath, you must once again mind the position of the last-used point. Unless you move the position to the beginning of the arc, the arc is connected to the last point by a straight line.
To draw a full circle, simply set startAngle to 0 and endAngle to (2 * Math.PI). The ccw parameter is irrelevant in this case because both directions give the same result. An example of full circles is shown in Listing 6.4.
Listing 6.4 Drawing a Full Circle
<canvas id=”canvas” width=”250” height=”300”></canvas>
<script>
var canvas = document.getElementById(“canvas”),
ctx = canvas.getContext(“2d”);
ctx.beginPath();
ctx.arc(200, 200, 160, 0, 2 * Math.PI, false);
ctx.moveTo(200 + 180, 200);
ctx.arc(200, 200, 180, 0, 2 * Math.PI, false);
ctx.lineWidth = 2;
ctx.strokeStyle = “black”;
ctx.stroke();
</script>
Figure 6-2 shows the arcs and circles. You can find these examples in the file 02-arcs.html.
Figure 6-2: Drawing arcs and circles
Bézier curves
Arcs are great, but they are just one type of curved path you can draw. The canvas context offers two methods for drawing Bézier curves. You might know these curves from the path tools in graphics applications such as Adobe Illustrator and Photoshop. Bézier curves are a powerful tool and can be generalized to higher dimensions to form Bézier surfaces and be used in both engineering and advanced 3D computer graphics. I don’t go into the math behind Bézier curves here; you just need to know that they are a type of parametric curve that uses a number of control points to describe a curved path from one point to another.
The first method, ctx.quadraticCurveTo(), adds a quadratic Bézier curve. In addition to the end point, this type of curve uses a single control point:
ctx.quadraticCurveTo(cx, cy, x, y);
This example adds a quadratic Bézier curve from the current position to (x, y), using the control point (cx, cy). Listing 6.5 shows a simple example of how to draw a quadratic curve. You can also find this example in the file 03-quadraticCurve.html.
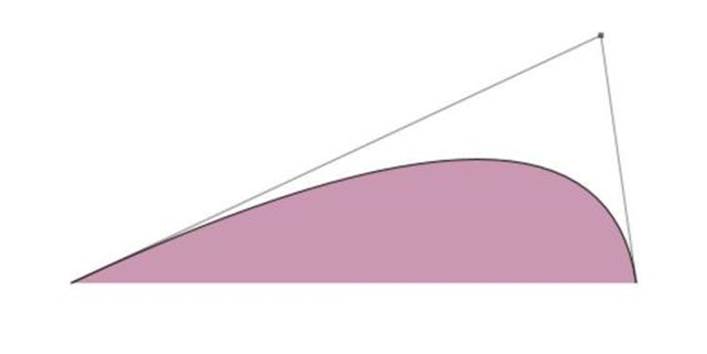
Listing 6.5 Drawing a Quadratic Curve
<canvas id=”canvas” width=”500” height=”300”></canvas>
<script>
var canvas = document.getElementById(“canvas”),
ctx = canvas.getContext(“2d”);
// draw quadratic Bézier curve
ctx.beginPath();
ctx.moveTo(50,200);
ctx.quadraticCurveTo(425,25,450,200);
ctx.fillStyle = “rgba(150,50,100,0.5)”;
ctx.fill();
ctx.stroke();
// draw control point
ctx.strokeStyle = ctx.fillStyle = “rgba(0,0,0,0.5)”;
ctx.beginPath();
ctx.moveTo(450,200);
ctx.lineTo(425,25);
ctx.lineTo(50,200);
ctx.stroke();
ctx.fillRect(450-2,25-2,4,4);
</script>
Figure 6-3 shows the resulting drawing. I drew this example to help you understand how the method affects the curve. As you can see, it’s as if the control point pulls the curve toward it.
Figure 6-3: A quadratic Bézier curve and its control point
The second curve method is called ctx.bezierCurveTo(). This method might as well have been named ctx.cubicCurveTo() because it creates a cubic Bézier curve. Cubic curves use two control points. Listing 6.6 shows an example of such a curve.
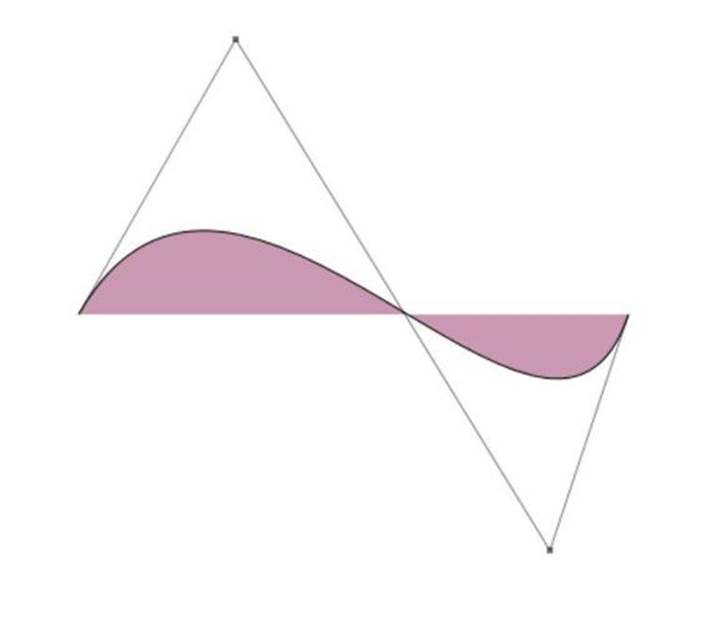
Listing 6.6 Drawing a Cubic Curve
<canvas id=”canvas” width=”450” height=”400”></canvas>
<script>
var canvas = document.getElementById(“canvas”),
ctx = canvas.getContext(“2d”);
// draw cubic Bézier curve
ctx.beginPath();
ctx.moveTo(50,200);
ctx.bezierCurveTo(150,25,350,350,400,200);
ctx.fillStyle = “rgba(150,50,100,0.5)”;
ctx.fill();
ctx.stroke();
// draw control points
ctx.strokeStyle = ctx.fillStyle = “rgba(0,0,0,0.5)”;
ctx.beginPath();
ctx.moveTo(50,200);
ctx.lineTo(150,25);
ctx.lineTo(350,350);
ctx.lineTo(400,200);
ctx.stroke();
ctx.fillRect(150-2,25-2,4,4);
ctx.fillRect(350-2,350-2,4,4);
</script>
Figure 6-4 shows the resulting drawing. Again, I drew the control points for this figure. As you might imagine, the cubic curve gives you a lot more flexibility and can even create self-intersecting curves. This example is found in the file 04-cubicCurve.html.
Figure 6-4: A cubic Bézier curve and its control points
A nice feature of cubic Bézier curves is that you can easily add one after the other to form longer and more detailed curves. Just put the first control point of the following curve segment in the opposite direction of the last control point of the previous segment. The curve segments then join smoothly without any abrupt breaks.
Clipping paths
Aside from filling and stroking, you can do one other thing with paths. You can use the ctx.clip() method to use the path as a clipping path. This makes the current path act as a mask that is applied to all subsequent drawing functions. As long as the clipping path is active, only the area within that region is modified. Listing 6.7 shows a simple example of a clipping path.
Listing 6.7 Applying a Clipping Path
<canvas id=”canvas” width=400 height=400></canvas>
<script>
var canvas = document.getElementById(“canvas”),
ctx = canvas.getContext(“2d”);
function makeClippingPath() {
// make a star-shaped clipping path
ctx.beginPath();
ctx.moveTo(270,200);
for (var i=0;i<=20;i++) {
ctx.lineTo(
200 + Math.cos(i/10 * Math.PI) * 70 * (i%2 + 1),
200 + Math.sin(i/10 * Math.PI) * 70 * (i%2 + 1)
);
}
ctx.clip();
}
// fill the entire canvas
ctx.fillStyle = ”sienna”;
ctx.fillRect(0,0,400,400);
makeClippingPath();
// try to fill the canvas again
ctx.fillStyle = ”lightsalmon”;
ctx.fillRect(0,0,400,400);
</script>
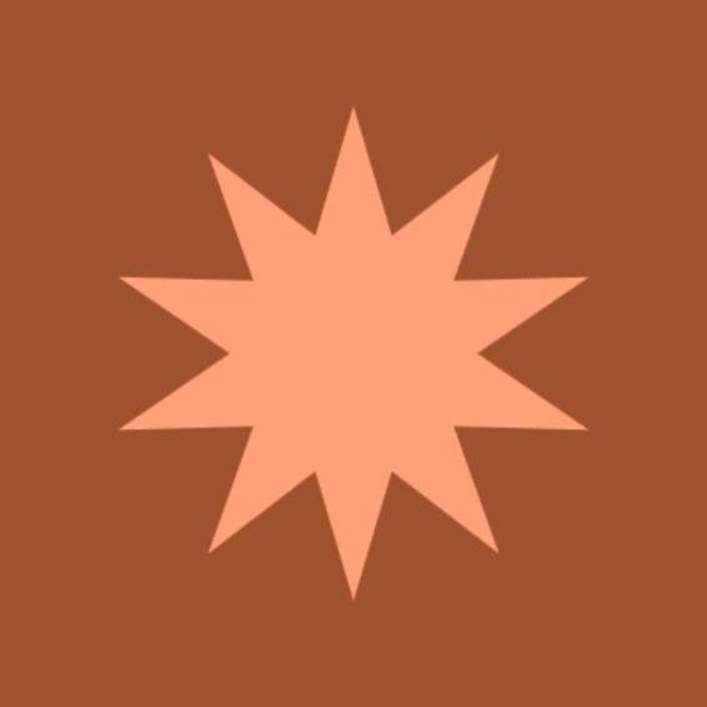
The resulting drawing is shown in Figure 6-5. Notice that even though the second ctx.fillRect() also fills the entire canvas, only the star-shaped region defined by the clipping path is actually modified. This example can be found in the file 05-clippingPath.html.
Figure 6-5: Clipping path example
Using advanced strokes and fill styles
So far, you’ve seen how to control the stroke color as well as the line width. You can use a few additional parameters to control the appearance of the stroke.
Line caps
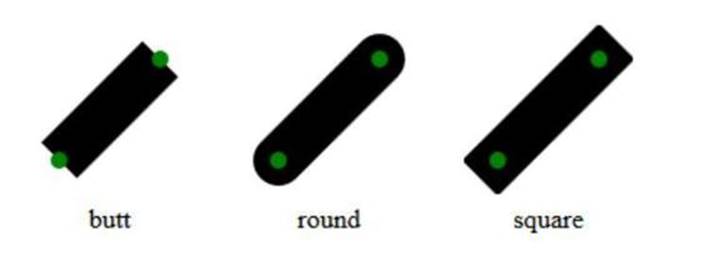
First up is the ctx.lineCap property. This property controls how the ends of open paths appear. There are three values:
• butt
• round
• square
The default value, butt, looks like a clean, perpendicular cut at the end of the stroke. The last point in the path is positioned in the center of the line cap. The round value rounds the end of the stroke by drawing a semicircle with the center positioned at the last point. Finally, the square value looks a bit like the butt line cap, but instead of cutting off right at the last point, the line is extended so the last point is positioned at the center of a square whose sides are equal to the line width. Figure 6-6 shows how the three different ctx.lineCap values alter the end of a stroke.
Figure 6-6: Line caps
Line joints
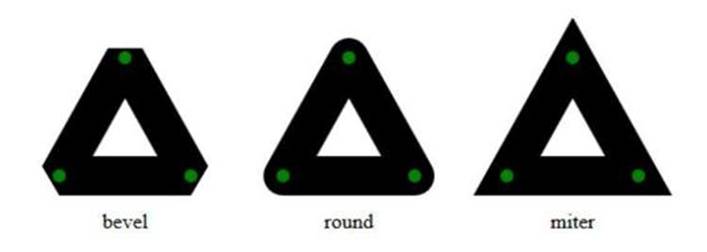
The ctx.lineJoin property is similar to ctx.lineCap but describes what to do whenever two consecutive path segments share the same point. As with ctx.lineCap, this property has three possible values:
• bevel
• round
• miter
All three values use the same, basic starting condition. Consider two lines that share a point in a path. Imagine that the lines terminate at the point using the butt method from the ctx.lineCap property. The strokes of these lines then have two edges each, an inner edge and an outer edge. These outer edges, together with the perpendicular line endings, define two outer corners of the joint.
The bevel value is the most basic of the three joints. This joint type simply fills the triangle defined by the meeting point and the two outer corners.
The round joint builds on the bevel and smoothes out the joint by rendering an arc connecting the outer corners.
The third value, miter, is the default value and is slightly more complicated. This value creates a miter joint at the meeting point. This is the type of joint used in, for example, picture frames where the ends of the four sides are cut at an angle to form the corner of the frame when connected. In the real world, these joints are often used to form 90-degree corners, but in the context of canvas, any angle works.
Extend the outer edges beyond the meeting point until the outer edges intersect. Fill the triangle defined by this miter point and the two corner points. Now, as you might imagine, path segments that meet at very acute angles could cause miter joints that extend far out from the meeting point. You can use the ctx.miterLimit property to control this issue. The miter limit determines the maximum allowed distance from the meeting point to the miter point. The value of the ctx.miterLimit property is specified in multiples of half line widths. For example, if the lineWidth is 3.0, actx.miterLimit value of 5.0 is equal to 7.5. That’s nice because you can change the line width without worrying about having to adjust the miter limit as well. If the distance to the miter point is greater than the limit, the joint falls back to using the bevel method. Initially, ctx.miterLimit is set to 10. Figure 6-7 shows examples of how the different join values appear.
Figure 6-7: Line joins
Using gradients
Fills and stroke styles need not be plain, solid colors. Canvas supports both linear and radial gradients. To use a gradient, you need to create a gradient object:
var gradient = ctx.createLinearGradient(
50, 50, 250, 400
);
This example creates a linear gradient along the line from (50, 50) to (250, 400). You can also create radial gradients:
var gradient = ctx.createRadialGradient(
100, 100, 10,
100, 100, 175
);
This example creates a radial gradient with an inner circle centered at (100, 100), a radius of 10, and an outer circle in the same spot but with a radius of 175. Both gradient objects expose an addColorStop() method that you can use to assign colors to the gradient:
gradient.addColorStop(0, “red”);
gradient.addColorStop(0.5, “green”);
gradient.addColorStop(1, “blue”);
This example sets three colors on the gradient: red at the start, green in the middle, and blue at the end. To use the gradient, you need to assign it to either the ctx.fillStyle or ctx.strokeStyle property. A full example of how to use gradients is shown in Listing 6.8.
Listing 6.8 Using Gradients
<canvas id=”canvas” width=”400” height=”400”></canvas>
<script>
var canvas = document.getElementById(“canvas”),
ctx = canvas.getContext(“2d”);
var linGrad = ctx.createLinearGradient(
50, 0, 250, 400
);
linGrad.addColorStop(0, “aquamarine”);
linGrad.addColorStop(1, “darkolivegreen”);
ctx.fillStyle = linGrad;
ctx.fillRect(0, 0, 400, 400);
var radGrad = ctx.createRadialGradient(
200, 200, 25, 200, 200, 150
);
radGrad.addColorStop(0, “white”);
radGrad.addColorStop(0.7, “yellow”);
radGrad.addColorStop(1, “orange”);
ctx.fillStyle = radGrad;
ctx.beginPath();
ctx.arc(230, 230, 150, 0, Math.PI * 2, false);
ctx.fill();
</script>
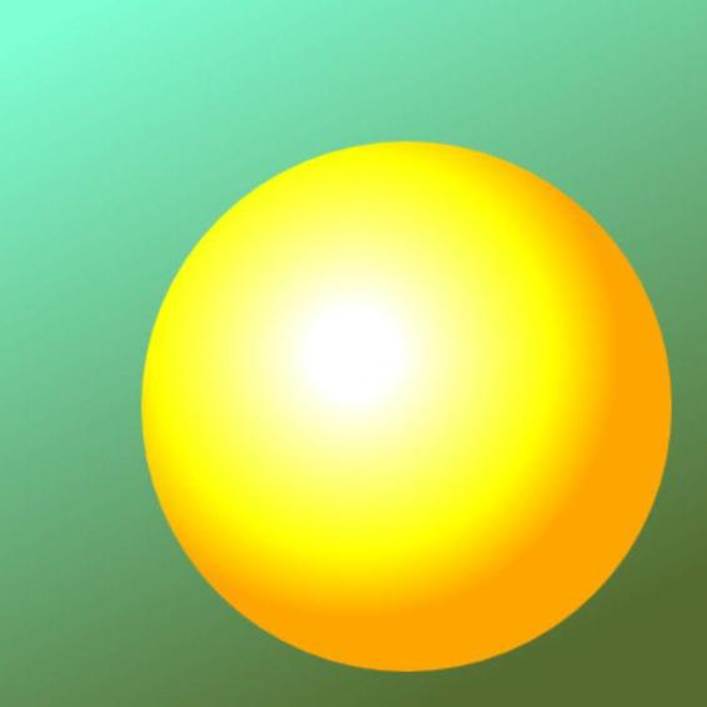
The example is available in the file 06-gradient.html. See Figure 6-8 for the result.
Figure 6-8: Gradient example
![]()
If you change the gradient after assigning it, you don’t need to reassign it. Any fill styles or stroke styles that use the gradient are automatically updated.
Using patterns
The last type of fill and stroke styles I discuss is patterns. You can use an existing image instead of a solid color or gradient. The image can be a regular image, a canvas element, or a video element. Start by creating a pattern object:
var gradient = ctx.createPattern (
document.getElementById(“myImage”),
“repeat”
);
The second argument specifies how the pattern should repeat. The possible values are
• repeat
• repeat-x
• repeat-y
• no-repeat
The default value is repeat, which makes the pattern repeat in both directions. The repeat-x and repeat-y values make the pattern repeat in only one direction, and if you choose no-repeat, no repetition is applied at all. The pattern is anchored at the origin of the coordinate space and is not affected by where you use it. This means that a pattern created from a small image with no repetition may not be visible in, for example, the bottom-right corner of the canvas.
The ctx.createPattern() method returns a pattern object that has no properties or methods. Just assign it to the ctx.strokeStyle or ctx.fillStyle, and you’re done.
Using transformations
When you create a new canvas element, the coordinate space used to draw content on it corresponds to the dimensions of the canvas element. That is, the pixel in the upper-left corner of the canvas is position (0, 0), and the pixel in the bottom-right corner is at position (w - 1, h - 1), where w and h are the width and height of the element. You can apply a number of different transformations such as scaling and rotation to this coordinate space to make certain operations easier.
Understanding the transformation matrix
At the heart of these transformations is a transformation matrix. Every point used by the canvas is multiplied by this matrix before it is used for rendering. Don’t worry if your linear algebra is a bit rusty; I don’t spend much time dwelling on the math.
Initially, the matrix is set to the identity matrix:
1 0 0
0 1 0
0 0 1
If you are comfortable with matrices, you can modify the transformation matrix directly using the ctx.transform() method:
ctx.transform(a, b, c, d, e, f);
This method multiplies the current matrix with the matrix
a c e
b d f
0 0 1
You can also use the ctx.setTransform() method to completely overwrite the current matrix:
ctx.setTransform(a, b, c, d, e, f);
This method essentially resets the transformation matrix to the identity matrix and uses ctx.transform() with the specified matrix parameters.
Translating
The ctx.translate() method of the context object adds a translation matrix to the transformation:
ctx.translate(x, y);
This method basically adds the x and y values to the coordinates of any points you draw. This means that
ctx.translate(50, 100);
ctx.fillRect(120, 130, 200, 200);
actually draws the rectangle with the upper-left corner in position (170, 230) on the canvas.
Scaling
You can also scale the coordinate space using the ctx.scale() method. This method takes two arguments, one for each axis. These values are used to scale the points drawn on the canvas. For example, changing the scale with
ctx.scale(2, 0.5);
would stretch any subsequent drawing to twice the width and half the height. You can achieve the same effect by applying this transformation:
ctx.transform(
2, 0,
0, 0.5,
0, 0
);
One neat trick that I sometimes use is to scale the coordinate space so that the entire canvas surface lies within 1 unit in the coordinate space. You can do that by scaling the coordinates using the dimensions of the canvas:
ctx.scale(1 / canvas.width, 1 / canvas.height);
All coordinates are now relative to the dimensions, and all visible points on the canvas lie between 0 and 1 on both axes. Drawing, for example, a rectangle that fills the upper-right quarter is now as easy as
ctx.fillRect(0.5, 0, 0.5, 0.5);
Rotating
The ctx.rotate() method adds a rotation operation to the transformation matrix. The angle is measured in radians and is a clockwise rotation:
ctx.rotate(t);
Using this method is essentially the same as applying the following transformation:
ctx.transform(
Math.cos(t), Math.sin(t),
- Math.sin(t), Math.cos(t),
0, 0
);
One issue you should be aware of is that the rotation always happens around the origin. If you want to rotate around a specific point, you should first translate the coordinate space so that point is placed at the origin. Then you can perform the rotation and reverse the translation, if necessary.
In general, you need to be careful when combining transformations. The order in which you apply the transformations can sometimes change the result. For example, performing a translation followed by a rotation does not produce the same result as doing it the other way around.
Adding text, images, and shadows
Apart from shapes and paths, you also can add both text and images to a canvas. You can draw images to the canvas using the ctx.drawImage() method on the context:
ctx.drawImage(image, dx, dy, dw, dh);
This method draws an img element, image, to the canvas. The dx, dy, dw, and dh arguments define the rectangle where the image should go. The upper-left corner is at (dx, dy), and the lower-right corner is at (dx + dw, dy + dh). The dw and dh arguments are optional and, if left out, default to the dimensions of the image. The ctx.drawImage() method can also take both a source and a destination rectangle:
ctx.drawImage(image, sx, xy, sw, sh, dx, dy, dw, dh);
You can use this argument pattern to draw only a subregion of an image to the canvas. The rectangle defined by sx, sy, sw, and sh is taken from the source image and drawn in the rectangle defined by dx, dy, dw, and dh on the destination canvas. If the dimensions of the two regions do not match, the copied area is stretched and scaled to fit the destination.
The image argument doesn’t have to be an img element. Both canvas elements and video elements are valid sources. If you use a video element, the current frame is drawn to the canvas.
Before drawing an image, you should make sure that image is completely loaded. Trying to draw an image that is not ready triggers an error. You can ensure the image is loaded either by checking the complete property on the image object or by only drawing from a load event handler attached to the image before setting the src property.
Adding text
The canvas element also lets you add text content to the canvas. However, you should always make sure that it is actually appropriate to use canvas to render the text. Because the canvas element behaves essentially like an image on the page, you can apply much of the same logic to text on canvas as you would to text in images. If it is possible to get the same or a similar result using CSS, perhaps you should reconsider going for a canvas-based approach. For example, regular HTML and CSS are often better suited for elements such as headings and buttons.
As with paths, you can draw text in two ways: one for filled text and one for drawing the outline or stroke of the text. First, however, you should specify the font with which you want to draw the text. You do this by setting the ctx.font property on the context. The value can be any font values as you know them from CSS. For example:
ctx.font = “italic 12px Arial, sans-serif”;
This line specifies a 12px Arial in italic style. If Arial is not present, the default sans serif typeface is used.
![]()
If you use embedded fonts, make sure that the font files are completely loaded before attempting to use them for canvas text. If the font file is not ready, the canvas uses a default font instead.
You can now draw the text using one of two methods:
ctx.fillText(“Hello World!”, 100, 50);
ctx.strokeText(“Hello World!”, 100, 50);
The ctx.fillText() method fills the specified text using the active ctx.fillStyle value, and ctx.strokeText() strokes the outline of the text using the active ctx.strokeStyle value. The second and third arguments specify the x and y coordinates where you want the text to go. You can change the text alignment using the ctx.textAlign property:
ctx.textAlign = “center”;
Possible values for ctx.textAlign are
• start
• end
• left
• center
• right
The left, center, and right values are trivial. The meaning of the start and end values depends on standard text direction of the current locale. For left-to-right locales, start is the same as left, and end is the same as right. For right-to-left locales, the situation is reversed. The default value for ctx.textAlign is start, so if you don’t want the text to adapt to the locale automatically, you should manually set the alignment.
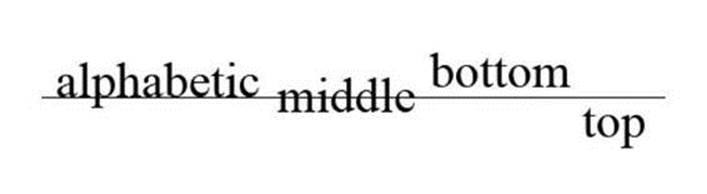
The vertical position of the text is determined by the y coordinate in ctx.fillText() and ctx.strokeText(), but it is also affected by the baseline of the text. You can control the baseline by setting the ctx.textBaseline property on the context:
ctx.textBaseline = “middle”;
Possible values for ctx.textBaseline are
• top
• middle
• bottom
• hanging
• alphabetic
• ideographic
Only the top, middle, bottom, and alphabetic values are fully supported in today’s browsers. See Figure 6-9 for an illustration of how the values affect the position of the text. The horizontal line is drawn at the same y coordinate as the text.
Figure 6-9: Text baseline examples
The ctx.fillText() and ctx.strokeText() methods both have an optional fourth argument, maxWidth. This is a numeric value that, if specified, constrains the text to a maximum width. If the rendered text would extend beyond that width in the specified font, the browser automatically shrinks the text so it fits. It’s up to the browser to see if a more condensed font is available or if the text can be scaled horizontally to fit.
One final method exists on the context related to text. The ctx.measureText() method takes one parameter, a string, and returns a text metrics object. This object has one property, width, which is the width of text if it were to be drawn on the canvas using the current font value.
var textWidth = ctx.measureText(“Hello World!”).width;
The ctx.measureText() method can be really useful if, for example, you have other content that depends on the size of the text or if you need to scale the canvas element to fit the rendered text.
Text drawn on a canvas has a few drawbacks compared to regular text on web pages. The browser doesn’t know that the pixels represent text, so the user can’t just select the text with the mouse. However, you can provide the text as fallback content for the canvas. This makes it possible for screen readers, for instance, to pick up the text. If the canvas content is interactive in some way, you can even put links in the fallback content. These links are then focusable when navigating the page with the keyboard:
<canvas id=”intro” width=400 height=400>
This is a fancy intro image.
<a href=”page2.html”>Click to go to page 2</a>
</canvas>
Unfortunately, using this approach does mean that you need to maintain the text content in both the canvas code as well as in the fallback content. Canvas accessibility is still being actively worked on, so in the future I hope this issue will be handled better.
![]()
At the time of writing, only Internet Explorer 9 implements the focusable fallback content for the canvas element.
Using shadow effects
You can use shadow effects to create a sense of depth in the image. The context object has four shadow-related properties. First, it has the shadow color:
ctx.shadowColor = “rgb(100,120,30)”;
The color value can be any valid CSS color. The offset of the shadow is controlled by two properties, one for each axis:
ctx.shadowOffsetX = 8;
ctx.shadowOffsetY = 8;
This example puts the shadow below and to the right of the content. Note that these are coordinate space units, so any transformations are also applied to these values. Finally, you can control the softness of the shadow with the ctx.shadowBlur property:
ctx.shadowBlur = 10;
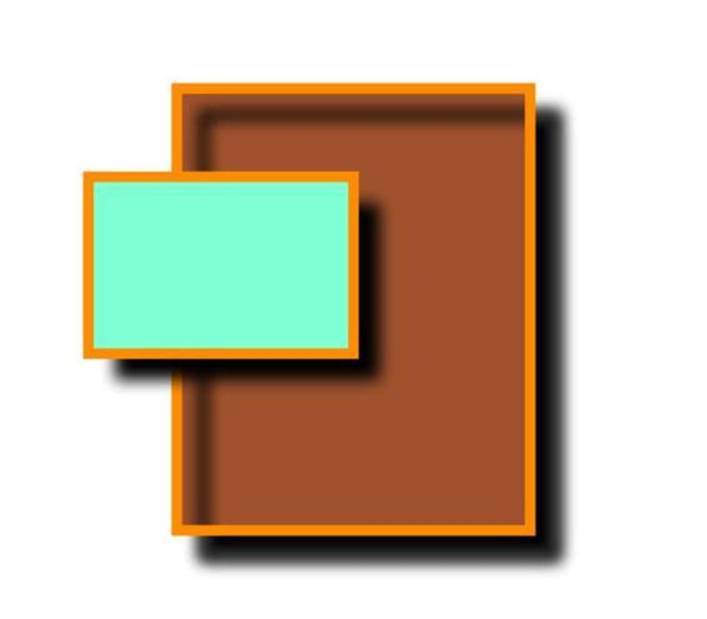
If you set a blur value of 0, you get a clean, sharp border rather than a soft shadow. Listing 6.9 shows an example of how shadows are used. You can find this example in the file 07-shadows.html.
Listing 6.9 Applying Shadow Effects
<canvas id=”canvas” width=400 height=350></canvas>
<script>
var canvas = document.getElementById(“canvas”),
ctx = canvas.getContext(“2d”);
ctx.shadowColor = “black”;
ctx.shadowOffsetX = 15;
ctx.shadowOffsetY = 15;
ctx.shadowBlur = 8;
ctx.lineWidth = 6;
ctx.strokeStyle = “darkorange”;
ctx.fillStyle = “sienna”;
ctx.fillRect(100,50,200,250);
ctx.strokeRect(100, 50, 200, 250);
ctx.fillStyle = “aquamarine”;
ctx.fillRect(50, 100, 150, 100);
ctx.shadowColor = “transparent”;
ctx.strokeRect(50, 100, 150, 100);
</script>
The resulting drawing is shown in Figure 6-10. As you can see on the sienna-colored rectangle, shadows can cause a bit of trouble if you use both strokes and fills on the same path. One solution is to disable the shadow while stroking, for example, by setting the shadow color to transparent.
Figure 6-10: Applying shadow effects
Managing the state stack
With so many different properties and values that affect how content is rendered on the canvas, keeping track of old values can be hard if you need to revert to a previous state after performing some task. Fortunately, the canvas has a built-in state stack that makes it easy to save all current values, do some drawing, and then revert to the previous values.
Almost all properties such as fill colors and text properties are part of the canvas state, so you don’t have to worry about overwriting old values as long as you save the state and restore it when you’re done. The components that make up the canvas state are
• The transformation matrix
• The clipping path
• strokeStyle, fillStyle
• lineWidth, lineCap, lineJoin, miterLimit
• globalAlpha, globalCompositeOperation
• shadowOffsetX, shadowOffsetY, shadowColor, shadowBlur
• font, textAlign, textBaseline
The current state is saved by called the ctx.save() method on the context object:
ctx.fillStyle = “black”;
...
ctx.save(); // save state with fill style
This example pushes the current state onto the stack, allowing you to safely modify any of the properties mentioned earlier. When you are done messing around with the canvas state, you can go back to the way things were before by calling the ctx.restore() method:
...
ctx.fillStyle = “white”;
...
ctx.restore(); // restore state, fill style is black again
The ctx.restore() method replaces the current state with the last saved state and removes that one from the stack. This capability can be useful when you don’t know the current value of all the properties. For example, when writing subroutines that need to change one or more properties, you can simply call ctx.save() at the beginning of the function and ctx.restore() before returning, thereby preserving the integrity of the canvas state.
Drawing the HTML5 logo
In this section, I show you a more complete example of how to draw using the canvas element. The target of this exercise is drawing the HTML5 logo. Before starting, take a look at Figure 6-11 to get a sense of what you will create in this section. You can find the complete example in the file 08-html5logo.html.
Figure 6-11: The HTML5 logo

First, make a nice background. Listing 6.10 shows the background function.
Listing 6.10 Drawing a Background
function drawBackground(canvas) {
var ctx = canvas.getContext(“2d”),
grad,
i;
ctx.save();
// scale coordinates to unit
ctx.scale(canvas.width, canvas.height);
grad = ctx.createRadialGradient(
0.5, 0.5, 0.125, 0.5, 0.5, 0.75
);
grad.addColorStop(0.1, ”rgb(170,180,190)”);
grad.addColorStop(0.9, ”rgb(50,60,70)”);
ctx.fillStyle = grad;
ctx.fillRect(0,0,1,1);
// draw a star shape by adding horizontal lines
// while rotating the coordinate space
ctx.beginPath();
ctx.translate(0.5,0.5);
for (i=0;i<60;i++) {
ctx.rotate(1 / 60 * Math.PI * 2);
ctx.lineTo(i % 2 ? 0.15 : 0.75, 0);
}
ctx.fillStyle = ”rgba(255,255,255,0.1)”;
ctx.fill();
ctx.restore();
}
Note how the state is saved at the beginning and restored at the end. Whatever you do to the state in the rest of the function, the state is returned as it was. Also note that the coordinate space is scaled using the full dimensions of the canvas. The upper-left corner is still (0, 0), but the lower-right corner is now (1, 1). That makes it much easier to work with coordinates without having to know the actual dimensions.
On to the actual logo. The logo is defined by a number of different shapes. The drawLogo() function in Listing 6.11 declares these shapes as lists of points at the beginning.
Listing 6.11 Path Data for the Logo Drawing Function
function drawLogo(canvas) {
var logo = [
[40,460], [0,0], [450,0], [410,460], [225,512]
],
five0 = [
[225,208], [225,265], [295,265], [288,338],
[225,355], [225,414], [341,382], [357,208]
],
five1 = [
[225,94], [225,150], [362,150], [367,94],
],
five2 = [
[225,208], [151,208], [146,150], [225,150],
[225,94], [84,94], [85,109], [99,265], [225,265]
],
five3 = [
[225,355], [162,338], [158,293], [128,293],
[102,293], [109,382], [225,414]
];
}
In a situation such as this, in which you have many different paths, having a helper function or two to save on the typing can be nice. Listing 6.12 shows a helper function that you can use to add a list of points to a path.
Listing 6.12 The Generalized Path Function
function makePath(ctx, points) {
ctx.moveTo(points[0][0], points[0][1]);
for (var i=1,len=points.length;i<len;i++) {
ctx.lineTo(points[i][0], points[i][1]);
}
}
The makePath() function just moves the position to the first point and then iterates through the rest of the list, adding line segments along the way. It doesn’t begin or close any paths, so you can create multiple subpaths in the same path. Now you can use that function and the path data to draw the logo. Listing 6.13 shows the logo function.
Listing 6.13 Drawing the Logo
function drawLogo(ctx) {
...
// save original state
ctx.save();
// translate the coordinate space to center of logo
ctx.translate(-225,-256);
// fill background of logo
ctx.beginPath();
makePath(ctx, logo);
ctx.fillStyle = “#e34c26”;
ctx.fill()
// add down-scaling at the center of the logo
ctx.save();
ctx.translate(225,256);
ctx.scale(0.8, 0.8);
ctx.translate(-225,-256);
// clip the right half of the logo
ctx.beginPath();
ctx.rect(225,0,225,512);
ctx.clip();
// paint a lighter, down-scaled logo on the right half
ctx.beginPath();
makePath(ctx, logo);
ctx.fillStyle = “#f06529”;
ctx.fill();
// restore scaling and clipping region
ctx.restore();
// restore original state
ctx.restore();
}
The drawLogo() function first translates the coordinates to place the origin in the center of the logo. This point is found by examining the path data. The rightmost point is at x = 450, and the bottommost point is at y = 512, which puts the center at (225, 256). Then the orange background part of the HTML5 logo is drawn using the makePath() function.
The inner part of the logo is a lighter shade of orange that fills only the right half, slightly downscaled. You can reuse the path from the first part by scaling the coordinate space and applying a clipping region to the canvas. To scale the coordinates correctly, the code translates the coordinates back before the scaling is applied. The coordinate space is once again translated to the center of the logo before a path spanning the entire right half of the canvas is clipped. When the logo path is filled again with a lighter shade, only the right half is actually drawn, creating the desired effect. It would arguably have been simpler to define the extra path data and just draw that as it is. Doing it this way demonstrates transformations, clipping regions, as well as how to use the state stack.
The white 5 in the middle of the logo is still missing. Drawing that part is just a matter of filling the relevant paths. Listing 6.14 shows the added paths.
Listing 6.14 Drawing the Rest of the Logo
function drawLogo(canvas) {
...
// restore scaling and clipping region
ctx.restore();
// fill white part of “5”
ctx.beginPath();
makePath(ctx, five0);
makePath(ctx, five1);
ctx.fillStyle = “#ffffff”;
ctx.fill();
// fill light grey part of “5”
ctx.beginPath();
makePath(ctx, five2);
makePath(ctx, five3);
ctx.fillStyle = “#ebebeb”
ctx.fill();
// restore original state
ctx.restore();
}
You can now put all these pieces together and draw the full logo on a canvas element. Listing 6.15 shows how.
Listing 6.15 Putting the Pieces Together
<canvas id=”canvas” width=”400” height=”400”></canvas>
<script>
function makePath(ctx, points) { ... }
function drawBackground(canvas) { ... }
function drawLogo(canvas) { ... }
var canvas = document.getElementById(“canvas”),
ctx = canvas.getContext(“2d”);
drawBackground(canvas);
ctx.translate(200, 200);
ctx.scale(0.5, 0.5);
drawLogo(canvas);
</script>
Note that the coordinate space is scaled and translated before drawLogo() is called. The reason is that drawLogo() doesn’t know where on the canvas it should draw the logo or how big it should be. By performing these transformations outside the function, you can control how and where the function places the logo. You could even rotate it or draw a whole bunch of logos on the same canvas. Listing 6.16 shows an example of how to draw multiple instances of the logo.
Listing 6.16 Drawing Multiple Logos
<canvas id=”canvas” width=400 height=400></canvas>
<script>
...
var canvas = document.getElementById(“canvas”),
ctx = canvas.getContext(“2d”);
drawBackground(canvas);
// draw 20 logos
for (var i=0;i<20;i++) {
ctx.save();
// calculate random rotation and scale
var x = Math.random() * canvas.width,
y = Math.random() * canvas.height,
angle = (Math.random() - 0.5) * Math.PI,
scale = 0.05 + Math.random() * 0.1;
// transform the coordinate space
ctx.translate(x, y);
ctx.scale(scale, scale);
ctx.rotate(angle);
drawLogo(ctx);
ctx.restore();
}
</script>
This example draws 20 instances of the HTML5 logo in random places on the canvas. Each logo has its own scaling and rotation. Because the state is saved and restored in each iteration of the loop, all instances are drawn independently. Figure 6-12 shows the resulting drawing.
Figure 6-12: Drawing random HTML5 logos

Compositing
You’ve already seen how you can use paths to define clipping regions that mask whatever you draw on the canvas. That is not the only way you can control how content is added to the canvas.
You can use the ctx.globalAlpha property, for example, to set a global alpha channel value. Any content that you draw on the canvas has its own transparency value multiplied by the ctx.globalAlpha value. For example, setting ctx.globalAlpha to 0.5 and then filling a path with the colorrgba(20, 85, 45, 0.7) results in a combined alpha value of 0.35. The ctx.globalAlpha setting can be useful when you want to draw shapes and images and make them semitransparent regardless of their own alpha channels.
In addition to ctx.globalAlpha, you also can use the ctx.globalCompositeOperation property. This property provides a number of different operations that alter the way the new source content is combined with the existing destination canvas. Table 6-1 shows a list of the possible values forctx.globalCompositeOperation. In the descriptions, A refers to the source content, and B refers to the destination.
Table 6-1 Composite operations
|
Value |
Description |
|
source-atop |
Renders A on top of B but only where B is not transparent. |
|
source-in |
Renders only A and only where B is not transparent. |
|
source-out |
Renders only A and only where B is transparent. |
|
source-over |
Renders A on top of B where A is not transparent. |
|
destination-atop |
Renders B on top of A but only where B is not transparent. |
|
destination-in |
Renders only B and only where A is not transparent. |
|
destination-out |
Renders only B and only where A is transparent. |
|
destination-over |
Renders B on top of A where A is not transparent. |
|
lighter |
Renders the sum of A and B. |
|
copy |
Disregards B and renders only A. |
|
xor |
Renders A where B is transparent and B where A is transparent. Renders transparent where neither A nor B is transparent. |
![]()
If you are familiar with computer graphics and image processing, you might recognize most of these as Porter-Duff operations. Except for the trivial copy operation, Porter and Duff describe all the composite operators in their 1984 paper, “Compositing Digital Images,” available at http://keithp.com/~keithp/porterduff/p253-porter.pdf.
The default operation is source-over, which paints the source content over the old, leaving the destination visible in only the transparent parts of the new. If the source content has parts that are semitransparent, the results for some of the operations can sometimes be difficult to imagine. For example, the destination-in operation renders the destination in the non-transparent parts of the source, but it also uses the alpha value of the source content. This means that filling a rectangle that spans the entire canvas with a fully transparent color would essentially clear the canvas.
Unfortunately, you can’t expect that all the operations are supported. Currently, only Firefox 4 and Internet Explorer 9 implement all operations correctly. WebKit browsers such as Chrome 12 and Safari 5 support only the following subset:
• source-atop
• source-over
• destination-out
• destination-over
• lighter
• xor
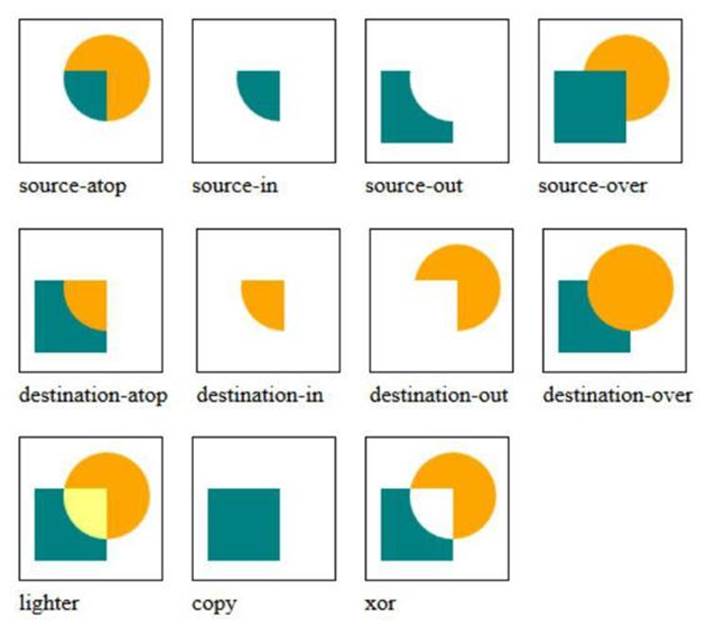
Until all browsers conform to the specification, you can safely use only this shorter list of operations. See Figure 6-13 for examples of all the composite operations as they should appear.
Figure 6-13: Composite operations
Accessing Image Data
Perhaps the most powerful feature of the canvas element is the ability to access and modify raw RGBA pixel values from the canvas. This low-level data access lets you modify the image in ways that are otherwise very difficult or even impossible to achieve.
Retrieving pixel values
The 2D context object provides a method called ctx.getImageData(). You can use this method to retrieve the data for a rectangular area of the image:
var imageData = ctx.getImageData(50, 75, 100, 200);
This example extracts the pixel data from a 100x200 rectangular region with the upper-left corner in position (50, 75). The ctx.getImageData() method returns an image data object that has the following properties:
• width
• height
• data
The width and height properties specify the dimensions of the data contained in the data object. These values might not be the same as the dimensions of the region specified in the ctx.getImageData() call. Depending on the device and display, the actual number of pixels used behind the scenes could differ from what is apparent from the element’s dimensions.
The data property is an array of RGBA color data. The length of the array depends on the dimensions of the data. Because each pixel requires four values — one for each of the red, green, and blue channels and one for the alpha channel — the length of the data array is equal to (width * height * 4). Each RGBA value is an integer in the range [0,255].
When iterating over the image data, you should use the width and height properties of the image data object and not those of the canvas element. Otherwise, you can’t be certain that you’re actually modifying all the data due to the difference between device pixels and CSS pixels.
Updating pixel values
Modifying the pixel data and saving it back to the canvas is just as easy. The ctx.putImageData() method takes an image data object and a set of coordinates indicating where the data should be placed. Usually, you just want to save the data back to where it came from, in which case the coordinates should be the upper-left corner of the rectangular area used in the ctx.getImageData() call. Listing 6.17 shows a basic example of how to modify the pixel data.
Listing 6.17 Creating a Pixel-based Pattern
<canvas id=”canvas” width=400 height=400></canvas>
<script>
var canvas = document.getElementById(“canvas”),
ctx = canvas.getContext(“2d”),
imageData = ctx.getImageData(
0,0,canvas.width,canvas.height),
w = imageData.width, h = imageData.height,
x, y, index;
for (y = 0; y < h; y++) {
for (x = 0; x < w; x++) {
index = (y * w + x) * 4;
var r = x / w * 255,
g = y / h * 255,
b = 128,
block = (56 * (1 - x*y/w/h));
imageData.data[index] = r - r % block;
imageData.data[index+1] = g - g % block;
imageData.data[index+2] = b - b % block;
imageData.data[index+3] = 255;
}
}
ctx.putImageData(imageData, 0, 0);
</script>
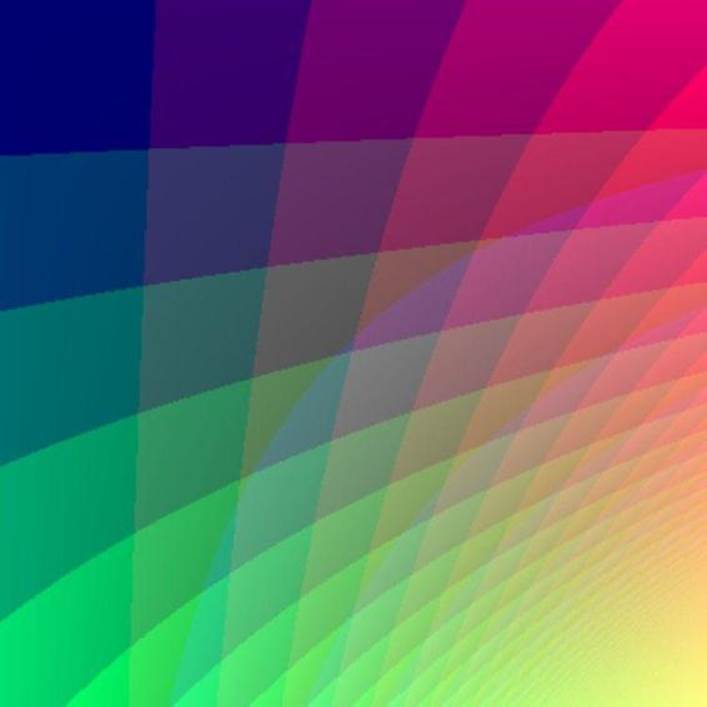
You can find this example in the file 09-imageData.html. Figure 6-14 shows the resulting canvas pattern.
The pattern algorithm itself is not that interesting and is just an example. However, note that the alpha channel (index+3) is set to the constant value 255. When you create a new canvas element, it is initially transparent black. That means all pixel values have the value 0. If you don’t alter the alpha value, the content you put back on the canvas with ctx.putImageData() is transparent as well, which is probably not what you want.
![]()
The image data methods are not affected by any compositing, clipping, or transformation settings. Pixels are accessed and updated directly, independent of the canvas state.
Figure 6-14: A simple pixel-based canvas effect
Exporting image file data
Sometimes you might need to convert the graphics on the canvas element to a real bitmap image. One way would be to grab all the pixel data and write your own functions for turning that into file data. Some image formats, such as BMP files, are relatively easy to implement, but others, such as JPEG and PNG, are more complicated. The canvas element has a method called canvas.toDataURL() that actually gives you the entire canvas as a PNG file in the form of a base64-encoded string. The content of the string looks something like this:
data:image/png;base64,...image data here...
The string is formatted as a data: URI, so you can use it as the source for a regular image element:
var data = canvas.toDataURL();
document.getElementById(“myImage”).src = data;
Other possible use cases include posting the data to a server-side script for further processing or storing it locally using Web Storage.
The canvas.toDataURL() method takes an optional argument that specifies the type of image that should be returned. The default value for this argument is image/png. PNG is the only format required by the specification, but some browsers also support, for example, JPEG images. Any relevant parameters for the specific encoder are passed after the image type:
var jpeg = canvas.toDataURL(“image/jpeg”, 0.7);
In browsers that support exporting JPEG files, this line would create a string with JPEG data using a quality level of 0.7. Realistically, you can expect only that PNG files work. The only way to test whether a given format is supported is to try calling canvas.toDataURL() and checking whether the beginning of the string includes the image type you expected.
Understanding security restrictions
When it comes to image data and pixel-level access, the canvas element comes with a few security-related restrictions. Just as the XMLHttpRequest object can’t access documents on other servers, the canvas element doesn’t let you read pixel values if it contains data that originates in a location other than where the document is located. The ctx.drawImage() method doesn’t stop you from drawing external images, but from that moment on, the canvas is marked as tainted. This means that the image data becomes write-only and any attempt to access the data withctx.getImageData() will throw a security exception. Using patterns with external data triggers the same situation as does using fonts from other origins.
The restrictions apply to any methods that could potentially leak information from external sources. The affected methods are ctx.measureText() if it uses an external font and canvas.toDataURL() and ctx.getImageData() if any external content has been drawn on the canvas.
You also can’t access any data from the user’s own local files. This applies even if you open the document locally as well, so you can’t use these features when running from a file:// URI.
![]()
If you absolutely need to use content from other domains, you can get around this limitation by writing a small proxy script in your favorite server-side language. If you can make the server download the file and relay it to the browser, it would appear to the canvaselement as if the file were from its own origin. The downside is that it puts extra load on your web server.
Creating pixel-based effects
Let’s look at another effect that uses the image data methods. This time, I used image data to create a twirl effect on an image file. The image is a bitmap version of the HTML5 logo you created earlier in this chapter. Listing 6.18 shows the code for the effect.
Listing 6.18 A Twirl Effect
<canvas id=”canvas” width=”400” height=”400”></canvas>
<script>
var canvas = document.getElementById(“canvas”),
ctx = canvas.getContext(“2d”),
image = new Image();
image.addEventListener(“load”, function() {
ctx.drawImage(this, 0, 0);
var cw = canvas.width, ch = canvas.height,
imgData = ctx.getImageData(0,0,cw,ch),
newData = ctx.getImageData(0,0,cw,ch),
w = imgData.width, h = imgData.height,
x, y, sx, sy,
dist, angle,
idx1, idx2,
amount = 20;
for (y = 0; y < h; y++) {
for (x = 0; x < w; x++) {
sx = x - w / 2,
sy = y - h / 2;
dist = Math.sqrt(sx * sx + sy * sy);
angle = Math.atan2(sy, sx) + dist / w * amount;
sx = Math.cos(angle) * dist;
sy = Math.sin(angle) * dist;
sx = Math.floor(sx + w / 2);
sy = Math.floor(sy + h / 2);
sx = Math.min(w-1, Math.max(0, sx));
sy = Math.min(h-1, Math.max(0, sy));
idx1 = (x + y * w) * 4;
idx2 = (sx + sy * w) * 4;
newData.data[idx1] = imgData.data[idx2];
newData.data[idx1+1] = imgData.data[idx2+1];
newData.data[idx1+2] = imgData.data[idx2+2];
}
}
ctx.putImageData(newData, 0, 0);
}, false);
// load the image
image.src = “html5.png”;
</script>
First, an image element is created, and the canvas drawing function is attached to its load event. When the image is ready, it is immediately drawn to the canvas so the image data can be accessed. In this example, you create two independent image data objects, each containing data of the entire canvas. Changing data in one image data object doesn’t affect any other objects, even if they are created from the same canvas. The newData object holds the modified content. The imgData object is not modified at all and is used only to read data. The nested loops access each pixel in the newData data and use a bit of math to calculate from where in imgData it should pick the pixel values. Working with two image data objects protects you from accidentally overwriting pixel values that you might need later in the algorithm. You can find this example in the file 10-twirl.html. Figure 6-15 shows the result.
Figure 6-15: The twirled HTML5 logo

![]()
For this example to work, you need to load the file from a web server. Drawing the image from a local file makes the canvas write-only. The image file must also reside on the same domain as the script due to the same-origin restrictions.
Summary
In this chapter, you got the grand tour of the canvas element. You saw pretty much all the features that the 2D drawing API has to offer, from drawing simple paths, shapes, and curves to creating advanced fills and strokes.
You also saw how the image data methods let you access pixels on an individual basis and saw examples of how to use that data to create complex effects and interesting patterns as well as how to use it to modify data from bitmap images.