Data Visualization with JavaScript (2015)
Chapter 9. Building Data-Driven Web Applications: Part 1
So far we’ve had a chance to see many of the tools and libraries for creating individual JavaScript visualizations, but we’ve considered them only in the context of a traditional web page. Today, of course, the Web is much more than traditional web pages. Especially on desktop computers, websites are effectively full-featured software applications. (Even on mobile devices many “apps” are really just websites enclosed in a thin wrapper.) When a web application is structured around data, there’s a good chance it can benefit from data visualizations. That’s exactly what we’ll consider in this final project: how to integrate data visualization into a true web application.
The sections that follow will walk through the development of an example application driven by data. The source of the data will be Nike’s Nike+ (http://nikeplus.com/) service for runners. Nike sells many products and applications that let runners track their activities and save the results for analysis and review. In this chapter and the next, we’ll build a web application to retrieve that data from Nike and present it to a user. Nike, of course, has its own web app for viewing Nike+ data, and that app is far superior to the simple example here. We’re certainly not trying to compete with Nike; rather, we’re just using the Nike+ service to structure our example.
NOTE
This sample project is based on the version of the interface at the time of this writing. There may have been changes to the interface since then.
Unlike most other chapters, this chapter won’t include multiple independent examples. Instead, it will walk through the main stages in the development and testing of a single data-driven application. We’ll see how to build up the basic structure and functionality of the web application. This includes the following:
§ How to structure a web application using a framework or library
§ How to organize an application into models and views
§ How to incorporate visualizations in views
In Chapter 10, we’ll focus on some of the finer details by dealing with several quirks of the Nike+ interface and adding some finishing touches to round out the single-page application.
NOTE
To use the Nike+ data in an actual product, you must register your application with Nike and get the necessary credentials and security keys. That process also grants you access to the full documentation for the service, which is not publicly available. Since we’re not building a real application in this example, we won’t cover that step. We will, however, base the application on the Nike+ API, which is documented publicly on Nike’s developer website (https://developer.nike.com/index.html). Because the example doesn’t include the credentials and security keys, it won’t be able to access the real Nike+ service. The book’s source code, however, does include actual Nike+ data that can be used to emulate the Nike+ service for testing and development.
Frameworks and Libraries
If we’re using JavaScript to add data visualizations to traditional web pages, we don’t have to worry too much about organizing and structuring our JavaScript. After all, it’s often a relatively small amount of code, especially compared to the HTML markup and CSS styles that are also part of the page. With web applications, however, the code can grow to be more extensive and more complex. To help keep our code organized and manageable, we’ll take advantage of a JavaScript application library, also called a framework.
Step 1: Select an Application Library
Deciding to use an application library might be easier than deciding which one to use. The number of these libraries has exploded in the past few years; there are now over 30 high-quality libraries from which to choose. A good place to see all the alternatives is TodoMVC (http://todomvc.com/), which shows how to implement a simple to-do application in each library.
There is an important question to ask that can help you narrow down the choices: is an application library a pure library or an application framework? Those terms are often used interchangeably, but there is a significant distinction. A pure library functions like jQuery or other libraries we’ve used throughout this book. It provides a set of tools for our application, and we can use as many—or as few—of those tools as we like. An application framework, on the other hand, dictates exactly how the application should work. The code that we write must follow the strictures and conventions of the framework. Fundamentally, the difference is about control. With a pure library, our code is in control and the library is at our disposal. With a framework, the framework code is in control, and we simply add the code that makes our application unique.
The main advantage of a pure library is flexibility. Our code is in control of the application, and we have full latitude to structure the application to our own requirements. That’s not always a good thing, however. The constraints of a framework can protect us from making poor design decisions. Some of the world’s best JavaScript developers are responsible for the popular frameworks, and they’ve put a lot of thought into what makes a good web application. There’s another benefit to frameworks: because the framework assumes more responsibility for the application, there’s generally less code we’re required to write.
It’s worth noting this distinction between frameworks and pure libraries, but almost any web application can be built effectively with either. Both approaches provide the organization and structure necessary for a high-quality application. For our example, we’ll use the Backbone.js (http://backbonejs.org/) library. It is by far the most popular of the pure (nonframework) libraries, and it’s used by dozens of the largest sites on the Web. The general approach that we’ll follow, however (including tools such as Yeoman), works well with almost any popular application library.
Step 2: Install Development Tools
When you start building your first real web application, deciding how to begin can be a bit intimidating. One tool that can be a big help at this stage is Yeoman (http://yeoman.io/), which describes itself as “The Web’s Scaffolding Tool for Modern Webapps.” That’s a pretty accurate description. Yeoman can define and initialize a project structure for a large number of different web application frameworks, including Backbone.js. As we’ll see, it also sets up and configures most of the other tools we’ll need during the application’s development.
Before we can use Yeoman, we must first install Node.js (http://nodejs.org/). Node.js is a powerful application development platform all by itself, but we won’t need to worry about the details here. It is, however, the application platform required by many modern web development tools like Yeoman. To install Node.js, follow the instructions on its website (http://nodejs.org/).
With Node.js installed, we can install the main Yeoman application as well as everything necessary to create a Backbone.js application (https://github.com/yeoman/generator-backbone/) with one command.
$ npm install -g generator-backbone
You can execute this command in the Terminal app (on Mac OS X) or from the Windows command prompt.
Step 3: Define a New Project
The development tools we just installed will make it easy to create a new web app project. First, with the following commands, we create a new folder (named running) for our application and then cd (change directory) into that folder.
$ mkdir running
$ cd running
From within that new folder, executing the command yo backbone will initialize the project structure.
$ yo backbone
As part of the initialization, Yeoman will ask for permission to send diagnostic information (mainly which frameworks and features our app uses) back to the Yeoman developers. It will then give us a choice to add a few more tools to the app. For our example, we’ll skip any of the suggested options.
Out of the box I include HTML5 Boilerplate, jQuery, Backbone.js and Modernizr.
[?] What more would you like? (Press <space> to select)
>![]() Bootstrap for Sass
Bootstrap for Sass
![]() Use CoffeeScript
Use CoffeeScript
![]() Use RequireJs
Use RequireJs
Yeoman will then do its magic, creating several subfolders, installing extra tools and applications, and setting up reasonable defaults. As you watch all the pages and pages of installation information scroll by in your window, you can be glad that Yeoman is doing all this work for you. When Yeoman finishes, you’ll have a project structure like the one shown in Figure 9-1. It may not look exactly like the figure here, since web applications may have changed since this text was written, but rest assured that it will follow the best practices and conventions.
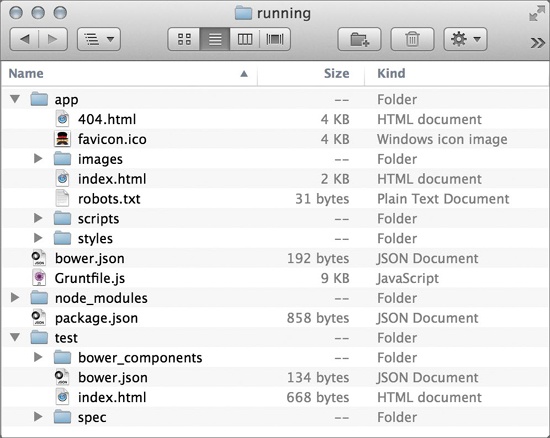
Figure 9-1. Yeoman creates a default project structure for a web application.
We’ll spend more time with most of these files and folders in the sections that follow, but here’s a quick overview of the project that Yeoman has set up for us.
§ app/. The folder that will contain all the code for our app
§ bower.json. A file that keeps track of all the third-party libraries our app uses
§ gruntfile.js. A file that controls how to test and build our app
§ node_modules/. A folder that contains the tools used to build and test our app
§ package.json. A file that identifies the tools used to build and test our app
§ test/. A folder that will contain the code we’ll write to test our app
At this point Yeoman has set up a complete web app (albeit one that doesn’t do anything). You can execute the command grunt serve from the command prompt to see it in a browser.
$ grunt serve
Running "serve" task
Running "clean:server" (clean) task
Running "createDefaultTemplate" task
Running "jst:compile" (jst) task
>> Destination not written because compiled files were empty.
Running "connect:livereload" (connect) task
Started connect web server on http://localhost:9000
Running "open:server" (open) task
Running "watch:livereload" (watch) task
Waiting...
The grunt command runs one of the tools that’s part of the Yeoman package. When passed the serve option, it cleans up the application folder, starts a web server to host the application, launches a web browser, and navigates to the skeleton app. You’ll see something like Figure 9-2 in your browser.
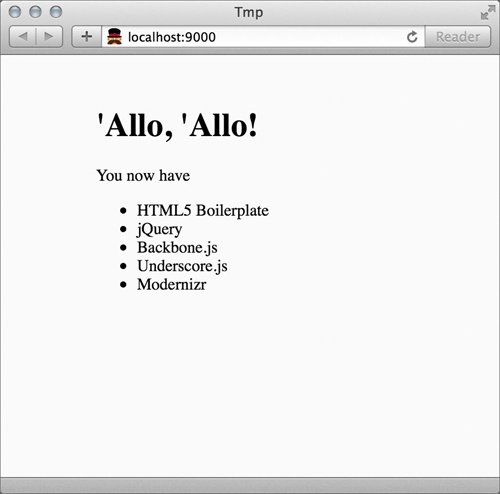
Figure 9-2. The default Yeoman web application runs in the browser.
Congratulations! Our web app, as basic as it is, is now running.
Step 4: Add Our Unique Dependencies
Yeoman sets up sensible defaults and tools for a new app, but our app needs a few JavaScript libraries that aren’t part of those defaults, such as Leaflet for maps and Flot for charts. The Moment.js (http://momentjs.com/) library for dealing with dates and times will also come in handy, as will the Underscore.string (http://epeli.github.io/underscore.string/) library. We can add these libraries to our project with some simple commands. The --save option tells the bower tool (which is part of the Yeoman package) to remember that our project depends on these libraries.
$ bower install leaflet --save
$ bower install flot --save
$ bower install momentjs --save
$ bower install underscore.string --save
Perhaps you’ve already begun to appreciate how tools like Yeoman make development easier. The simple commands shown here save us from having to find the libraries on the Web, download the appropriate files, copy them to the right place in our project, and so on.
Even more importantly, Yeoman (technically, the bower tool) automatically takes care of any additional libraries on which these libraries depend. The Flot library, for example, requires jQuery. When Yeoman installs Flot, it will also check and make sure that jQuery is installed in the project. In our case, it is because Backbone.js depends on it, but if jQuery weren’t already installed, Yeoman would automatically find it and install it as well.
For most libraries, bower can completely install all the necessary components and files. In the case of Leaflet, however, we need to perform a few extra steps. Change directory to the leaflet folder within app/bower_components. From there, run two commands to install the unique tools that Leaflet requires:
$ npm install
$ npm install jake -g
Executing the command jake will then run all of Leaflet’s tests and, provided they pass, create a Leaflet.js library for our app.
$ jake
Checking for JS errors...
Check passed.
Checking for specs JS errors...
Check passed.
Running tests...
...............................................................................
...............................................................................
...............................................................................
........................................
PhantomJS 1.9.7 (Mac OS X): Executed 280 of 280 SUCCESS (0.881 secs / 0.496 secs)
Tests ran successfully.
Concatenating and compressing 75 files...
Uncompressed: 217.22 KB (unchanged)
Compressed: 122.27 KB (unchanged)
Gzipped: 32.71 KB
All that’s left to do is add the other libraries into our HTML files. That’s easy enough. The main page for our app is index.html in the app folder. There’s already a block of code that includes jQuery, Underscore.js, and Backbone.js:
<!-- build:js scripts/vendor.js -->
<script src="bower_components/jquery/dist/jquery.js"></script>
<script src="bower_components/underscore/underscore.js"></script>
<script src="bower_components/backbone/backbone.js"></script>
<!-- endbuild -->
We can add our new libraries after Backbone.js.
<!-- build:js scripts/vendor.js -->
<script src="bower_components/jquery/dist/jquery.js"></script>
<script src="bower_components/underscore/underscore.js"></script>
<script src="bower_components/backbone/backbone.js"></script>
<script src="bower_components/flot/jquery.flot.js"></script>
<script src="bower_components/leaflet/dist/leaflet-src.js"></script>
<script src="bower_components/momentjs/moment.js"></script>
<script
src="bower_components/underscore.string/lib/underscore.string.js">
</script>
<!-- endbuild -->
Leaflet, as we saw in Chapter 6, also requires its own style sheet. We add that to the top of index.html just before main.css.
<!-- build:css(.tmp) styles/main.css -->
<link rel="stylesheet" href="bower_components/leaflet/dist/leaflet.css">
<link rel="stylesheet" href="styles/main.css">
<!-- endbuild -->
Now that we’ve set up the structure of our app and installed the necessary libraries, it’s time to start development.
Models and Views
There are many application libraries available for web apps, and each has its quirks, but most of the libraries agree on the key principles that should guide an app’s architecture. Perhaps the most fundamental of those principles is separating models from views. The code that keeps track of the core data for the app (the models) should be separate from the code that presents that data to the user (the views). Enforcing this separation makes it easier to update and modify either. If you want to present your data in a table instead of a chart, you can do that without any changes to the models. And if you need to change your data source from a local file to a REST API, you can do that without any changes to the views. We’ve been employing this principle in an informal way throughout the book. In all of the examples, we’ve isolated the steps required to obtain and format our data from the steps we used to visualize it. Using an application library like Backbone.js gives us the tools to manage models and views more explicitly.
Step 1: Define the Application’s Models
Our running app is designed to work with Nike+, which provides details about runs—training runs, interval workouts, trail runs, races, and so on. The data set we want consists of nothing but runs, so our app’s core model is, naturally, a run.
The Yeoman tool makes it very easy to define a model for our app. A simple command defines a new model and creates the JavaScript files and scaffolding for that model.
$ yo backbone:model run
create app/scripts/models/run.js
invoke backbone-mocha:model
create test/models/run.spec.js
That command creates two new files: run.js in the app/scripts/models/ folder and run.spec.js in the test/ folder. Let’s take a look at the file Yeoman created for our model. It’s quite short.
➊ /*Global Running, Backbone*/
➋ Running.Models = Running.Models || {};
(function () {
"use strict";
Running.Models.Run = Backbone.Model.extend({
url: "",
initialize: function() {
},
defaults: {
},
validate: function(attrs, options) {
},
parse: function(response, options) {
return response;
}
});
})();
At ➊ is a comment that lists the global variables our model requires. In this case there are only two: Running (that’s our app) and Backbone. Next, at ➋, this file creates a .Models property of the Running object unless that property already exists.
When the browser encounters this line, it will check to see if Running.Models exists. If it does, then Running.Models won’t be false, and the browser never has to consider the second clause of the logical or (||). The statement simply assigns Running.Models to itself, so it has no practical effect. If Running.Models does not exist, however, then it evaluates to false, and the browser will continue to the second clause, where it assigns an empty object ({}) to Running.Models. Ultimately, this statement makes sure that the object Running.Models exists.
The rest of the code in the file is enclosed within an immediately invoked function expression. If you haven’t seen this pattern before, it may look a little strange.
(function () {
/* Code goes here */
})();
If we rewrite the block as a single line, though, it might be easier to understand.
( function () { /* Code goes here */ } ) ();
The statement defines a JavaScript function with a function expression, function () { /* ... */ }, and then, with the concluding (), it calls (technically invokes) that newly created function. All we’re really doing, therefore, is putting our code inside a function and calling that function. You’ll see this pattern a lot in professional JavaScript because it protects a block of code from interfering with other code blocks in the application.
When you define a variable in JavaScript, it is a global variable, available everywhere in the code. As a consequence, if two different sections of code try to define the same global variable, those definitions will clash. This interaction can cause bugs that are very hard to find, as code in one section inadvertently interferes with code in a completely different section. To prevent this problem, we can avoid using global variables, and the easiest way to do that in JavaScript is to define our variables inside a function. That’s the purpose of an immediately invoked function expression. It makes sure that any variables our code defines are local to the function rather than global, and it prevents our code blocks from interfering with one another.
Step 2: Implement the Model
Our application really only needs this one model, and it’s already complete! That’s right: the scaffolding that Yeoman has set up for us is a complete and functioning model for a run. In fact, if it weren’t for some quirks in Nike’s REST API, we wouldn’t have to touch the model code at all. We’ll address those quirks in Chapter 10.
Before we move on to the next step, though, let’s look at what we can do with our newly created model. To do that we’ll make a temporary addition to the model code. We won’t use the following code in the final app; it’s only meant to show off what our model can already do.
First, let’s add the URL to retrieve details about a run (Nike+ uses the more general term activity). From the Nike+ documentation, we find that this URL is https://api.nike.com/v1/me/sport/activities/<activityId>.
Running.Models.Run = Backbone.Model.extend({
➊ url: "https://api.nike.com/v1/me/sport/activities/",
initialize: function() {
},
defaults: {
},
validate: function(attrs, options) {
},
parse: function(response, options) {
return response;
}
});
The final part of the URL depends on the specific activity, so here we add only the general part of the URL to our model (➊).
Now imagine that we want to get the details for a specific run from the Nike+ service. The run in question has a unique identifier of 2126456911. If the Nike+ API followed typical conventions, we could create a variable representing that run, and get all its data, with the hypothetical two statements that follow. (We’ll consider the quirks of the actual Nike+ interface in Step 7 of Connecting with the Nike+ Service.)
var run = new Running.Models.Run({id: 2126456911});
run.fetch();
Since many APIs do follow typical conventions, it’s worth spending some time understanding how that code works. The first statement creates a new instance of the Run model and specifies its identifier. The second statement tells Backbone to retrieve the model’s data from the server. Backbone will take care of all the communication with Nike+, including error handling, time-outs, parsing the response, and so on. Once the fetch completes, detailed information from that run will be available from the model. If we provide a callback function, we could output some of the details. Here’s an example:
var run = new Running.Models.Run({id: 2126456911});
run.fetch({success: function() {
console.log("Run started at ", run.get("startTime"));
console.log(" Duration: ", run.get("metricSummary").duration);
console.log(" Distance: ", run.get("metricSummary").distance);
console.log(" Calories: ", run.get("metricSummary").calories);
}});
The output in the browser’s console would be the following:
Run started at 2013-04-09T10:54:33Z
Duration: 0:22:39.000
Distance: 3.7524
Calories: 240
Not bad for a few simple lines of code! The code in this step, though, is really just a detour. Our application won’t use individual models in this way. Instead, we’ll use an even more powerful Backbone.js feature: collections.
Step 3: Define the Application’s Collections
The model we created is designed to capture the data for a single run. Our users, however, aren’t interested in just a single run. They’d like to see all of their runs—dozens, hundreds, possibly thousands of them. We can handle all of these runs with a collection, or group of models. The collection is one of the core concepts of Backbone.js, and it will be a big help for our app. Let’s define a collection for all of the user’s runs.
Yeoman makes it easy to define and set up scaffolding for our collection. We execute the single command yo backbone:collection runs from the command line. (Yes, we’re being very original and calling our collection of runs, well, runs.)
$ yo backbone:collection runs
create app/scripts/collections/runs.js
invoke backbone-mocha:collection
create test/collections/runs.spec.js
Yeoman does the same thing for collections as it did for models: it creates an implementation file (runs.js in the app/scripts/collections/ folder) and a test file. For now, let’s take a look at runs.js.
/*Global Running, Backbone*/
Running.Collections = Running.Collections || {};
(function () {
"use strict";
Running.Collections.Runs = Backbone.Collection.extend({
model: Running.Models.Runs
});
})();
This file is even simpler than our model; the default collection has only a single property to indicate what type of model the collection contains. Unfortunately, Yeoman isn’t smart enough to handle plurals, so it assumes the name of the model is the same as the name of the collection. That’s not true for our app, as our model is Run (singular) and the collection is Runs (plural). While we’re removing that s, we can also add a property to specify the REST API for the collection. That’s a URL from the Nike+ service.
Running.Collections.Runs = Backbone.Collection.extend({
url: "https://api.nike.com/v1/me/sport/activities/",
model: Running.Models.Run
});
With those two small changes, we’re ready to take advantage of our new collection (aside from handling a few quirks with the Nike+ API; we’ll ignore that complication for now and address it later). All we need to do is create a new instance of the Runs collection and then fetch its data.
var runs = new Running.Collections.Runs();
runs.fetch();
That’s all it takes to build a collection containing the user’s runs. Backbone.js creates a model for each and retrieves the model’s data from the server. Even better, those run models are stored in a true Underscore.js collection, which gives us access to many powerful methods to manipulate and search through the collection. Suppose, for example, we want to find the total distance for all of a user’s runs. That’s tailor-made for the Underscore.js reduce() function.
var totalDistance = runs.reduce( function(sum, run) {
return sum + run.get("metricSummary").distance;
}, 0);
That code could tell us, for example, that the user has logged a total of 3,358 kilometers with Nike+.
NOTE
As you may have noticed, we’re taking advantage of many utilities from Underscore.js in our Backbone.js application. That is not a coincidence. Jeremy Ashkenas is the lead developer for both projects.
Step 4: Define the Application’s Main View
Now that we have all the running data for a user, it’s time to present that data. We’ll do that with Backbone.js views. To keep our example simple, we’ll consider only two ways to show the running data. First we’ll display a table listing summary information about each run. Then, if the user clicks on a table row, we’ll show details about that specific run, including any visualizations. The main view of our application will be the summary table, so let’s focus on that first.
A Backbone.js view is responsible for presenting data to the user, and that data may be maintained in a collection or a model. For the main page of our app, we want to show summary information for all of a user’s runs. That view, therefore, is a view of the entire collection. We’ll call the view Summary.
The bulk of the table for this Summary view will be a series of table rows, where each row presents summary data about an individual run. That means we can simply create a view of a single Run model presented as a table row, and design our main Summary view to be made up (mostly) of many SummaryRow views. We can once again rely on Yeoman to set up the scaffolding for both of those types of views.
$ yo backbone:view summary
create app/scripts/templates/summary.ejs
create app/scripts/views/summary.js
invoke backbone-mocha:view
create test/views/summary.spec.js
$ yo backbone:view summaryRow
create app/scripts/templates/summaryRow.ejs
create app/scripts/views/summaryRow.js
invoke backbone-mocha:view
create test/views/summaryRow.spec.js
The scaffolding that Yeoman sets up is pretty much the same for each view; only the name varies. Here’s what a Summary view looks like.
/*Global Running, Backbone, JST*/
Running.Views = Running.Views || {};
(function () {
"use strict";
Running.Views.Summary = Backbone.View.extend({
template: JST["app/scripts/templates/summary.ejs"],
tagName: "div",
id: "",
className: "",
events: {},
initialize: function () {
this.listenTo(this.model, "change", this.render);
},
render: function () {
this.$el.html(this.template(this.model.toJSON()));
}
});
})();
The overall structure of the file is the same as our model and our collection, but there’s a bit more going on in the view itself. Let’s step through the view’s properties one at a time. The first property is template. That’s where we define the exact HTML markup for the view, and we’ll look at this in more detail in the next step.
The tagName property defines the HTML tag that our view will use as its parent. Yeoman defaults it to a generic <div>, but we know that in our case, it will be a <table>. We’ll change that in a moment.
The id and className properties specify HTML id attributes or class values to add to the main container (in our case, the <table>). We could, for example, base some CSS styles on these values. For our example, we’re not considering styles, so we can leave both properties blank or delete them entirely.
Next is the events property. This property identifies user events (such as mouse clicks) that are relevant for the view. In the case of the Summary view, there are no events, so we can leave the object empty or simply delete it.
The last two properties, initialize() and render(), are both methods. Before we consider those, let’s see the Summary view after we make the tweaks just mentioned. Now that we’ve omitted the properties we won’t be using, we’re down to just the template and tagName properties, plus the initialize() and render() methods:
Running.Views.Summary = Backbone.View.extend({
template: JST["app/scripts/templates/summary.ejs"],
tagName: "table",
initialize: function () {
this.listenTo(this.model, "change", this.render);
},
render: function () {
this.$el.html(this.template(this.model.toJSON()));
}
});
Now let’s look inside the last two methods, starting with initialize(). That method has a single statement (other than the return statement that we just added). By calling listenTo(), it tells Backbone.js that the view wants to listen for events. The first parameter, this.collection, specifies the event target, so the statement says that the view wants to listen to events affecting the collection. The second parameter specifies the type of events. In this case, the view wants to know whenever the collection changes. The final parameter is the function Backbone.js should call when the event occurs. Every time the Runs collection changes, we want Backbone.js to call the view’s render() method. That makes sense, because whenever the Runs collection changes, whatever we were displaying on the page is now out of date. To make it current, our view should refresh its contents.
Most of the real work of a view takes place in its render() method. After all, this is the code that actually creates the HTML markup for the web page. Yeoman has gotten us started with a template, but in the case of a collection view, that’s not enough. The template takes care of the HTML for the collection as a whole, but it doesn’t handle the models that are part of the collection. For the individual runs, we can use the each() function from Underscore.js to iterate through the collection and render each run.
As you can see from the following code, we’ve also added a return this; statement to each method. In a bit we’ll take advantage of this addition to chain together calls to multiple methods in a single, concise statement.
Running.Views.Summary = Backbone.View.extend({
template: JST["app/scripts/templates/summary.ejs"],
tagName: "table",
initialize: function () {
this.listenTo(this.collection, "change", this.render);
return this;
},
render: function () {
this.$el.html(this.template());
this.collection.each(this.renderRun, this);
return this;
}
});
Now we have to write the renderRun() method that handles each individual run. Here’s what we want that function to do:
1. Create a new SummaryRow view for the run.
2. Render that SummaryRow view.
3. Append the resulting HTML to the <tbody> in the Summary view.
The code to implement those steps is straightforward, but it’s helpful to take each step one at a time.
1. Create a new SummaryRow view: new SummaryRow({model: run})
2. Render that SummaryRow view: .render()
3. Append the result: this.$("tbody").append();
When we put the steps together, we have the renderRun() method.
renderRun: function (run) {
this.$("tbody").append(new Running.Views.SummaryRow({
model: run
}).render().el);
}
Most of the changes we made to the Summary view are also appropriate for the SummaryRow view, although we don’t need to add anything to the render() method. Here’s our first implementation of the SummaryRow. Note that we’ve set the tagName property to "tr" because we want each run model presented as a table row.
Running.Views.SummaryRow = Backbone.View.extend({
template: JST["app/scripts/templates/summaryRow.ejs"],
tagName: "tr",
events: {},
initialize: function () {
this.listenTo(this.model, "change", this.render);
return this;
},
render: function () {
this.$el.html(this.template(this.model.toJSON()));
return this;
}
});
Now we have all the JavaScript code we need to show the main summary view for our app.
Step 5: Define the Main View Templates
So far we’ve developed the JavaScript code to manipulate our Summary and SummaryRow views. That code doesn’t generate the actual HTML markup, though. For that task we rely on templates. Templates are skeletal HTML markup with placeholders for individual values. Confining HTML markup to templates helps keep our JavaScript code clean, well structured, and easy to maintain.
Just as there are many popular JavaScript application libraries, there are also many template languages. Our application doesn’t require any fancy template functionality, however, so we’ll stick with the default template process that Yeoman has set up for us. That process relies on a JST tool (https://github.com/gruntjs/grunt-contrib-jst/) to process templates, and the tool uses the Underscore.js template language (http://underscorejs.org/#template/). It’s easy to see how this works through an example, so let’s dive in.
The first template we’ll tackle is the template for a SummaryRow. In our view, we’ve already established that the SummaryRow is a <tr> element, so the template needs to supply only the content that lives within that <tr>. We’ll get that content from the associated Run model, which, in turn, comes from the Nike+ service. Here’s an example activity that Nike+ could return.
{
"activityId": "2126456911",
"activityType": "RUN",
"startTime": "2013-04-09T10:54:33Z",
"activityTimeZone": "GMT-04:00",
"status": "COMPLETE",
"deviceType": "IPOD",
"metricSummary": {
"calories": 240,
"fuel": 790,
"distance": 3.7524,
"steps": 0,
"duration": "0:22:39.000"
},
"tags": [/* Data continues... */],
"metrics": [/* Data continues... */],
"gps": {/* Data continues... */}
}
For a first implementation, let’s show the time of the run, as well as its duration, distance, and calories. Our table row, therefore, will have four cells, with each cell holding one of these values. We can find the template, summaryRow.ejs, in the app/scripts/templates folder. By default, Yeoman sets it to a simple paragraph.
<p>Your content here.</p>
Let’s replace that with four table cells.
<td></td>
<td></td>
<td></td>
<td></td>
As placeholders for the cells’ content, we can use model attributes enclosed in special <%= and %> delimiters. The full SummaryRow template is as follows.
<td><%= startTime %></td>
<td><%= metricSummary.duration %></td>
<td><%= metricSummary.distance %></td>
<td><%= metricSummary.calories %></td>
The other template we need to supply is the Summary template. Since we’ve already set the view’s main tag to be a <table>, this template should specify the content within that <table>: a table header row plus an empty <tbody> element (whose individual rows will come from the Run models).
<thead>
<tr>
<th>Time</th>
<th>Duration</th>
<th>Distance</th>
<th>Calories</th>
</tr>
</thead>
<tbody></tbody>
Now we’re finally ready to construct the main view for our runs. The steps are quite straightforward:
1. Create a new Runs collection.
2. Fetch the data for that collection from the server.
3. Create a new Summary view for the collection.
4. Render the view.
Here’s the JavaScript code for those four steps:
var runs = new Running.Collection.Runs();
runs.fetch();
var summaryView = new Running.Views.Summary({collection: runs});
summaryView.render();
We can access the constructed <table> as the el (short for element) property of the view. It will look something like the following:
<table>
<thead>
<tr>
<th>Time</th>
<th>Duration</th>
<th>Distance</th>
<th>Calories</th>
</tr>
</thead>
<tbody>
<tr>
<td>2013-04-09T10:54:33Z</td>
<td>0:22:39.000</td>
<td>3.7524</td>
<td>240</td>
</tr>
<tr>
<td>2013-04-07T12:34:40Z</td>
<td>0:44:59.000</td>
<td>8.1724</td>
<td>569</td>
</tr>
<tr>
<td>2013-04-06T13:28:36Z</td>
<td>1:28:59.000</td>
<td>16.068001</td>
<td>1200</td>
</tr>
</tbody>
</table>
When we insert that markup in the page, our users can see a simple summary table listing their runs, as shown in Figure 9-3.
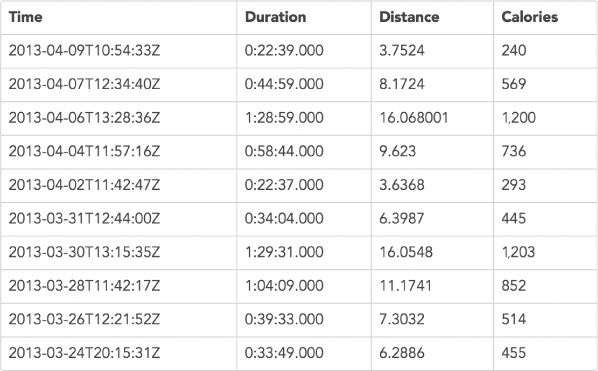
Figure 9-3. A simple table with a summary of run information
Step 6: Refine the Main View
Now we’re starting to get somewhere, though the table contents could use some tweaking. After all, does the last digit in a run of 16.068001 kilometers really matter? Since Nike+ determines the attributes of our Run model, it might seem like we have no control over the values passed to our template. Fortunately, that’s not the case. If we look at the SummaryView’s render() method, we can see how the template gets its values.
render: function () {
this.$el.html(this.template(this.model.toJSON()));
return this;
}
The template values come from a JavaScript object that we’re creating directly from the model. Backbone.js provided the toJSON() method, which returns a JavaScript object corresponding to the model’s attributes. We can actually pass any JavaScript object to the template, even one we create ourselves within the render() method. Let’s rewrite that method to provide a more user-friendly Summary view. We’ll take the model’s attributes one at a time.
First is the date of the run. A date of “2013-04-09T10:54:33Z” isn’t very readable for average users, and it’s probably not even in their time zone. Working with dates and times is actually quite tricky, but the excellent Moment.js library (http://momentjs.com/) can handle all of the complexity. Since we added that library to our app in an earlier section, we can take advantage of it now.
render: function () {
var run = {};
run.date = moment(this.model.get("startTime")).calendar();
NOTE
In the interest of brevity, we’re cheating a little with the preceding code because it converts the UTC timestamp to the local time zone of the browser. It would probably be more correct to convert it to the time zone for the run, which Nike+ provides in the data.
Next up is the run’s duration. It’s doubtful that we need to show the fractions of seconds that Nike+ includes, so let’s simply drop them from the attribute. (It would be more precise to round up or down, but assuming our users are not Olympic athletes in training, a second here or there won’t matter. Besides, Nike+ seems to always record these subsecond durations as “.000” anyway.)
run.duration = this.model.get("metricSummary").duration.split(".")[0];
The distance property can also use some adjustment. In addition to rounding it to a reasonable number of decimal places, we can convert from kilometers to miles for our US users. A single statement takes care of both.
run.distance = Math.round(62. *
this.model.get("metricSummary").distance)/100 +
" Miles";
The calories property is fine as it is, so we’ll just copy it into our temporary object.
run.calories = this.model.get("metricSummary").calories;
Finally, if you’re an avid runner, you might have noticed that there’s an important value missing from the Nike+ attributes: the average pace for the run in minutes per mile. We have the data to calculate it, so let’s add that as well.
var secs = _(run.duration.split(":")).reduce(function(sum, num) {
return sum*60+parseInt(num,10); }, 0);
var pace = moment.duration(1000*secs/parseFloat(run.distance));
run.pace = pace.minutes() + ":" + _(pace.seconds()).pad(2, "0");
Now we have a new object to pass to the template.
this.$el.html(this.template(run));
We’ll also need to modify both templates to match the new markup. Here’s the updated template for SummaryRows.
<td><%= date %></td>
<td><%= duration %></td>
<td><%= distance %></td>
<td><%= calories %></td>
<td><%= pace %></td>
And here’s the Summary template with the additional column for Pace.
<thead>
<tr>
<th>Date</th>
<th>Duration</th>
<th>Distance</th>
<th>Calories</th>
<th>Pace</th>
</tr>
</thead>
<tbody></tbody>
Now we have a much-improved summary table for our users, shown in Figure 9-4.
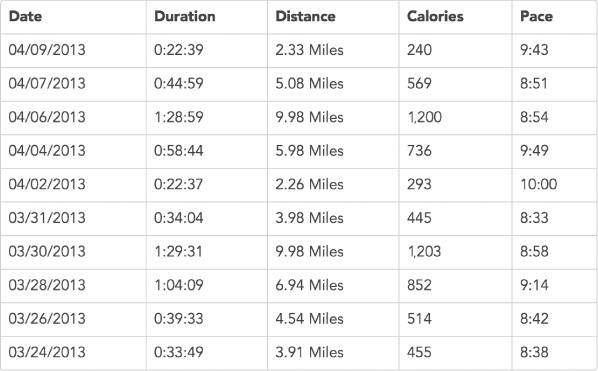
Figure 9-4. An improved summary table with cleaner-looking data
Views for Visualizations
Now that we’ve seen how to use Backbone.js views to separate data from its presentation, we can consider how to use the same approach for data visualizations. When the presentation is simple HTML markup—as in the previous section’s tables—it’s easy to use templates to view a model. But templates aren’t sophisticated enough to handle data visualizations, so we’ll need to modify our approach for those.
The data from the Nike+ service offers lots of opportunity for visualizations. Each run, for example, may include a record of the user’s heart rate, instantaneous pace, and cumulative distance, recorded every 10 seconds. Runs may also include the user’s GPS coordinates captured every second. That type of data lends itself to both charts and maps, and in this section, we’ll add both to our application.
Step 1: Define the Additional Views
As we did in the previous section, we’ll rely on Yeoman to create the scaffolding for our additional views. One view, which we’ll call Details, will act as the overall view for the details of an individual run. Within that view, we’ll create three additional views, each showing a different aspect of the run. We can think of these views in a hierarchy.
§ Details. A detailed view of a single run
§ Properties. The full set of properties associated with the run
§ Chart. Charts showing performance during the run
§ Map. A map of the run’s route
To start the development of these views, we return to the command line and execute four Yeoman commands.
$ yo backbone:view details
$ yo backbone:view properties
$ yo backbone:view charts
$ yo backbone:view map
Step 2: Implement the Details View
The Details view is really nothing more than a container for its three children, so its implementation is about as easy as it gets. We create a new view for each of the children, render the view, and add the resulting markup to the Details. Here is the complete code for this view:
Running.Views.Details = Backbone.View.extend({
render: function () {
this.$el.empty();
this.$el.append(
new Running.Views.Properties({model: this.model}).render().el
);
this.$el.append(
new Running.Views.Charts({model: this.model}).render().el
);
this.$el.append(
new Running.Views.Map({model: this.model}).render().el
);
return this;
}
});
Unlike the previous views we’ve created, this view doesn’t have an initialize() method. That’s because the Details view doesn’t have to listen for changes to the model, so there’s nothing to do during initialization. In other words, the Details view itself doesn’t actually depend on any of the properties of the Run model. (The child views, on the other hand, depend greatly on those properties.)
The render() method itself first clears out any existing content from its element. This line makes it safe to call the render() method multiple times. The next three statements create each of the child views. Notice that all of the child views have the same model, which is the model for the Details view as well. This capability is the power of the model/view architecture; one data object—in our case, a run—can be presented in many different ways. While the render() method creates each of these child views, it also calls their render() methods, and it appends the resulting content (their el properties) into its own el.
Step 3: Implement the Properties View
For the Properties view, we want to show all of the properties that Nike+ has associated with the run. Those properties are determined by the data returned by the Nike+ service; here’s an example:
{
"activityId": "2126456911",
"activityType": "RUN",
"startTime": "2013-04-09T10:54:33Z",
"activityTimeZone": "GMT-04:00",
"status": "COMPLETE",
"deviceType": "IPOD",
"metricSummary": {
"calories": 240,
"fuel": 790,
"distance": 3.7524,
"steps": 0,
"duration": "0:22:39.000"
},
"tags": [
{ "tagType": "WEATHER", "tagValue": "SUNNY" },
{ "tagType": "NOTE" },
{ "tagType": "TERRAIN", "tagValue": "TRAIL" },
{ "tagType": "SHOES", "tagValue": "Neo Trail" },
{ "tagType": "EMOTION", "tagValue": "GREAT" }
],
"metrics": [
{ "intervalMetric": 10, "intervalUnit": "SEC",
"metricType": "SPEED", "values": [/* Data continues... */] },
{ "intervalMetric": 10, "intervalUnit": "SEC",
"metricType": "HEARTRATE", "values": [/* Data continues... */] },
{ "intervalMetric": 10, "intervalUnit": "SEC",
"metricType": "DISTANCE", "values": [/* Data continues... */] },
],
"gps": {
"elevationLoss": 114.400024,
"elevationGain": 109.00003,
"elevationMax": 296.2,
"elevationMin": 257,
"intervalMetric": 10,
"intervalUnit": "SEC",
"waypoints": [/* Data continues... */]
}
}
That data can certainly benefit from a bit of cleanup to make it more user-friendly. To do that we’ll take advantage of the Underscore.string library we added to the project before. We can make sure that library is available by “mixing it into” the main Underscore.js library. We’ll do that right at the start of the JavaScript file for the Properties view.
/*Global Running, Backbone, JST, _*/
_.mixin(_.str.exports());
Running.Views = Running.Views || {};
// Code continues...
Notice that we’ve also added the global variable for Underscore.js (_) to the initial comment in the file.
The most straightforward way to present this information in HTML is with a description list (<dl>). Each property can be an individual item in the list, with a description term (<dt>) holding the property name and the description data (<dd>) its value. To implement this, we set the tagName property of the view to be "dl", and we create a generic list item template. Here’s the start of our Properties view code:
Running.Views.Properties = Backbone.View.extend({
template: JST["app/scripts/templates/properties.ejs"],
tagName: "dl",
initialize: function () {
this.listenTo(this.model, "change", this.render);
return this;
},
render: function () {
// More code goes here
return this;
}
});
And here’s the simple template that the view will use.
<dt><%= key %></dt>
<dd><%= value %></dd>
A quick glance at the Nike+ data shows that it contains nested objects. The metricSummary property of the main object is itself an object. We need a function that will iterate through all the properties in the input object, building the HTML markup as it does. A recursive function can be particularly effective here, since it can call itself whenever it reaches another nested object. Next, we add an obj2Html() method to our view. At its core, this method will use the Underscore.js reduce() function, which is well suited to the task at hand.
obj2Html: function(obj) {
return (
_(obj).reduce(function(html, value, key) {
// Create the markup for the current
// key/value pair and add it to the html variable
return html;
}, "", this)
);
}
As we process each property, the first thing we can do is improve the key name. For example, we’d like to replace startTime with Start Time. That’s where Underscore.string comes in. Its humanize() function turns camelCase into separate words, and its titleize() function ensures that each word begins with an uppercase letter. We’ll use chaining to perform both operations in one statement.
key = _.chain(key).humanize().titleize().value();
Now we can consider the value. If it is an array, we’ll replace it with a string that shows the array length.
if (_(value).isArray()) {
value = "[" + value.length + " items]";
}
Next we check to see if the value is an object. If it is, then we’ll call the obj2Html() method recursively.
if (_(value).isObject()) {
html += this.obj2Html(value);
For other types, we convert the value to a string, format it a bit with Underscore.string, and make use of our template.
} else {
value = _(value.toString().toLowerCase()).titleize();
html += this.template({ key: key, value: value });
}
There are a few other minor improvements we can make to the presentation, which you can find in the book’s source code. The last piece of the view is implementing the render() method. In that method, we use toJSON() to get an object corresponding to the Run model, and then we start the obj2Html() recursion with that object.
render: function () {
this.$el.html(this.obj2Html(this.model.toJSON()));
return this;
}
The result is a complete picture of the properties of the run, shown in Figure 9-5.
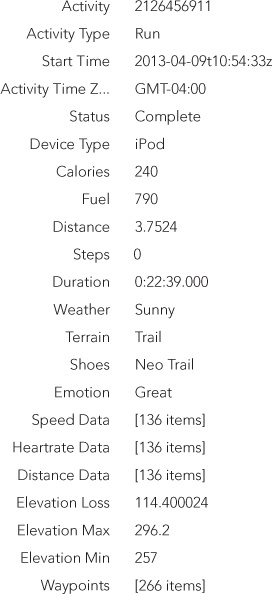
Figure 9-5. The completed Properties view shows all of the data associated with a run.
Step 4: Implement the Map View
To show users maps of their runs, we rely on the Leaflet library from Chapter 6. Using the library will require some small modifications to the normal Backbone.js view implementation, but, as we’ll see, those same modifications will come in handy for other views as well. Leaflet builds its maps in a containing element in the page (typically a <div>), and that containing element must have an id attribute so that Leaflet can find it. Backbone.js will take care of adding that id if we include an id property in the view. That’s easy enough.
Running.Views.Map = Backbone.View.extend({
id: "map",
With <div id="map"></div> available in the page’s markup, we can create a Leaflet map with the following statement:
var map = L.map(this.id);
We might be tempted to do that directly in the view’s render() method, but there’s a problem with that approach. Adding (and removing) elements in a web page requires a lot of computation by the browser. When JavaScript code does that frequently, the performance of the page can suffer significantly. To reduce this problem, Backbone.js tries to minimize the number of times it adds (or removes) elements, and one way to do that is to add many elements at once rather than adding each element independently. It employs that approach when it implements a view’s render() method. Before adding any elements to the page, it lets the view finish constructing its entire markup; only then does it add that markup to the page.
The problem here is that when render() is called the first time, there won’t (yet) be a <div id="map"></div> anywhere in the page. If we call Leaflet, it won’t be able to find the container for its map, and it will generate an error. What we need to do is defer the part of render() that draws the map until after Backbone.js has added the map container to the page.
Fortunately, Underscore.js has a utility function called defer() to do just that. Instead of drawing the map directly in the render() method, we’ll create a separate method. Then, in the render() method, we’ll defer execution of that new method. Here’s what the code to do that looks like:
render: function () {
_.defer(_(function(){ this.drawMap(); }).bind(this));
},
drawMap: function () {
var map = L.map(this.id);
// Code continues...
}
As you can see, we’re actually using a couple of Underscore.js functions in our render() method. In addition to defer(), we also take advantage of bind(). The latter function ensures that the this value when drawMap() is eventually called is the same as the this value within the view.
There’s one change we can make to further improve this implementation. Although there won’t be a <div id="map"></div> in the page when render() is first called, that element will exist in subsequent calls to render(). In those cases, we don’t need to defer the execution of drawMap(). That leads to the following code for our render() method.
render: function () {
if (document.getElementById(this.id)) {
this.drawMap();
} else {
_.defer(_(function(){ this.drawMap(); }).bind(this));
}
return this;
},
As long as we’re making optimizations, let’s also change the initialize() method slightly. The default method that Yeoman creates is this:
initialize: function () {
this.listenTo(this.model, "change", this.render);
},
For the Map view, however, we don’t really care if any property of the Run model changes. The only property the view needs is gps, so we can tell Backbone. js to bother us only if that specific property changes.
initialize: function () {
this.listenTo(this.model, "change:gps", this.render);
return this;
},
You might be wondering, “Why would the gps property of the Run model ever change?” I’ll get to that when I cover the quirks of the Nike+ REST API in Chapter 10.
With the preliminaries out of the way, we can implement the drawMap() function, which turns out to be a very easy implementation. The steps are as follows:
1. Make sure the model has a gps property and there are waypoints associated with it.
2. If an old map exists, remove it.
3. Extract the GPS coordinates from the waypoints array.
4. Create a path using those coordinates.
5. Create a map that contains that path, and draw the path on the map.
6. Add the map tiles.
The resulting code is a straightforward implementation of those steps.
drawMap: function () {
if (this.model.get("gps") && this.model.get("gps").waypoints) {
if (this.map) {
this.map.remove();
}
var points = _(this.model.get("gps").waypoints).map(function(pt) {
return [pt.latitude, pt.longitude];
});
var path = new L.Polyline(points, {color: "#1788cc"});
this.map = L.map(this.id).fitBounds(path.getBounds())
.addLayer(path);
var tiles = L.tileLayer(
"http://server.arcgisonline.com/ArcGIS/rest/services/Canvas/"+
"World_Light_Gray_Base/MapServer/tile/{z}/{y}/{x}",
{
attribution: "Tiles © Esri — "+
"Esri, DeLorme, NAVTEQ",
maxZoom: 16
}
);
this.map.addLayer(tiles);
}
}
As you can see from the code, we’re storing a reference to the Leaflet map object as a property of the view. From within the view, we can access that object using this.map.
The result is a nice map of the run’s route, shown in Figure 9-6.
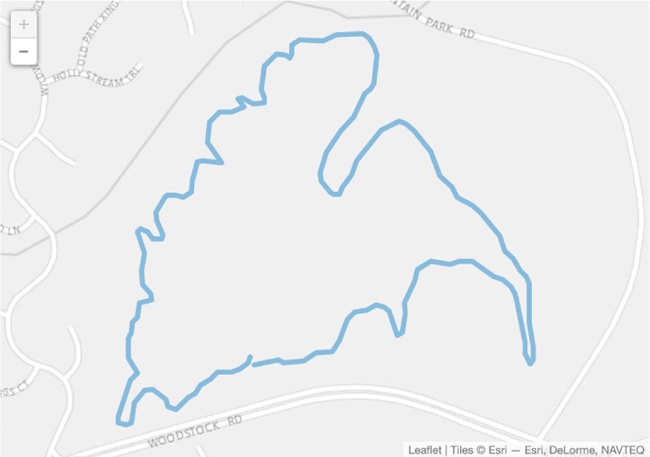
Figure 9-6. A map view shows the route of a run.
Step 5: Implement the Charts View
The last remaining view that we need to implement is the Charts view, where we want to show pace, heart rate, and elevation during the run. This view is the most complex, but nearly all of the code is identical to the example in Tracking Data Values, so there’s no need to repeat it here.
You can see the interactive result in Figure 9-7.
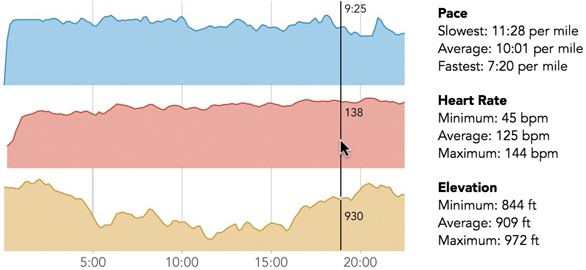
Figure 9-7. An alternative view shows charts of the run.
The source code for the book includes the complete implementation. If you’re looking in detail at that implementation, there a few points to note:
§ Just as with Leaflet and the map container, Flot expects a container for its chart to be present in the web page. We can use the same defer trick to prevent Flot errors.
§ Nike+ returns at least four types of charts as metrics: distance, heart rate, speed, and GPS signal strength. We really only care about the first two. At first, it might seem easiest to calculate pace from speed, but speed isn’t present in all activities. Distance, however, is present, and we can derive pace from distance and time.
§ If GPS waypoint data is available, we can also graph elevation, but that data is in a separate attribute of the model (not the metrics attribute).
§ As of this writing, there’s a bit of a bug in Nike’s response for GPS data. It claims that the measurements are on the same time scale as the other metrics (every 10 seconds), but in fact the GPS measurements are reported on different intervals. To work around this bug, we ignore the reported interval and calculate one ourselves. Also, we want to normalize the elevation graph to the same time scale as all the others. Doing that will give us the additional benefit of averaging the GPS elevation data; averaging is useful here because GPS elevation measurements aren’t generally very accurate.
Summing Up
In this chapter, we’ve starting building an entire web application based on data and data visualizations. To help organize and coordinate our application, we based it on the Backbone.js library, and we relied on the Yeoman tool to create the application’s scaffolding and boilerplate code and templates. Backbone.js lets us separate our application into models and views so that the code responsible for managing the data doesn’t have to worry about how that data is presented (and vice versa).
In the next chapter, we’ll enable our application to communicate with the Nike+ interface, and we’ll add some finishing touches to improve user interaction with the page.
All materials on the site are licensed Creative Commons Attribution-Sharealike 3.0 Unported CC BY-SA 3.0 & GNU Free Documentation License (GFDL)
If you are the copyright holder of any material contained on our site and intend to remove it, please contact our site administrator for approval.
© 2016-2025 All site design rights belong to S.Y.A.