Exam Ref 70-417 Upgrading Your Skills to Windows Server 2012 R2 (2014)
Chapter 5. Deploy, manage, and maintain servers
This chapter contains a single objective: Monitor servers. The vast majority of this topic is probably already familiar to you: Data Collector Sets, event forwarding and collection, alerts, performance counters, and network monitoring: None of these features has changed in any significant way since Windows Server 2008. That’s not to say you shouldn’t brush up on these topics if you don’t feel confident about them. You absolutely should.
But if the question is what’s new in server monitoring in Windows Server 2012 and Windows Server 2012 R2, there’s really just one development you need to know about, and it relates to Resource Metering. We’ve already covered Resource Metering of virtual machines in Chapter 3, “Configure Hyper-V,” and this chapter builds on that knowledge by introducing the related topic of virtual machine (VM) resource pools.
Objectives in this chapter:
![]() Objective 5.1: Monitor servers
Objective 5.1: Monitor servers
Objective 5.1: Monitor servers
Windows Server 2012 and Windows Server 2012 R2 introduce Windows PowerShell cmdlets to measure virtual machine resource pools, allowing you to monitor usage by all VMs of various resources on a Hyper-V host. The VM resource metering introduced in Chapter 3 is used to measure resource usage by individual VMs. VM resource pools, in contrast, are more useful for measuring usage of a host’s resources by all guest VMs.
For the exam, you should learn how to configure and use this new feature.
This section covers the following topics:
![]() Virtual machine resource pools
Virtual machine resource pools
![]() Monitoring servers through Windows PowerShell
Monitoring servers through Windows PowerShell
![]() Reviewing older monitoring features
Reviewing older monitoring features
Virtual machine resource pools
Each Hyper-V host includes predefined VM resource pools that correspond to the individual host resource types—such as processor, Ethernet, memory, and disk (VHD)—that are available to the guest VMs on that host. You can use these resource pools to monitor aggregate usage of each resource by all VMs, or you can create new resource pools that measure some subset of a resource, such as a particular set of VHDs. To see the list of all VM resource pools, type Get-VMResourcePool at a Windows PowerShell prompt. The following shows a sample output:
Name ResourcePoolType ParentName ResourceMeteringEnabled
---- ---------------- ---------- -----------------------
Primordial Processor False
Primordial Ethernet False
Primordial FibreChannelConnection False
FCSAN FibreChannelConnection {Primordial} False
Primordial FibreChannelPort False
Primordial Memory False
Primordial VHD False
Primordial ISO False
Primordial VFD False
Predefined resource pools are named “Primordial” because they represent the total amount of a resource available on the host machine, as opposed to a user-defined subset of that resource. The ResourceMeteringEnabled status of all the resource pools in the preceding example is labeled False because Resource Metering hasn’t yet been enabled.
Metering virtual machine resource pools
As with VM Resource Metering, covered in Chapter 3, resource pool metering is intended only to provide raw data to be captured by applications developed either in-house or by third-party developers. Still, you can use Windows PowerShell to test the functionality of VM resource pools and view usage data associated with them.
To begin metering usage of a resource pool, first use the Enable-VMResourceMetering cmdlet. Specify the resource pool by name with the -ResourcePoolName parameter and by type with the -ResourcePoolType parameter. For example, to enable metering of the primordial memory resource pool, type the following:
Enable-VMResourceMetering –ResourcePoolName Primordial –ResourcePoolType Memory
You can also use the wildcard “*” symbol in place of a specific name and ignore the -ResourcePoolType parameter if instead you want to enable all resource pools that can possibly be enabled:
Enable-VMResourceMetering -ResourcePoolName *
A predefined resource pool can still remain disabled after you run this previous command only if no corresponding resource is found on the host computer. After you run the preceding command, the output of Get-VMResourcePool in this example thus changes to the following:
Name ResourcePoolType ParentName ResourceMeteringEnabled
---- ---------------- ---------- -----------------------
Primordial Processor True
Primordial VHD True
Primordial Ethernet True
Primordial FibreChannelPort False
Primordial FibreChannelConnection False
Primordial VFD False
Primordial Memory True
Primordial ISO False
FCSAN FibreChannelConnection {Primordial} False
You can measure the resource usage associated with a resource pool after metering is enabled on it. To do so, use the Measure-VMResourcePool cmdlet. For example, the following command will provide usage for network data:
Measure-VMResourcePool -Name * -ResourcePoolType Ethernet
Sample output is shown here in an abbreviated format:
Name ResourcePoolType NetworkInbound(M) NetworkOutbound(M)
---- ---------------- ----------------- ------------------
Primordial {Ethernet} 20 4
Creating virtual machine resource pools
Instead of measuring primordial pool usage, you can use the New-VMResourcePool cmdlet to create resource pools for monitoring and reporting usage of a subset of resources.
For example, the following command creates a new VM resource pool associated with multiple VHD files:
PS C:\> New-VMResourcePool "New Resource Pool" VHD -Paths "D:\Hyper-V\Virtual Hard
Disks"
Name ResourcePoolType ParentName ResourceMeteringEnabled
---- ---------------- ---------- -----------------------
New Resource Pool VHD {Primordial} False
As with the primordial resource pools, you can then enable Resource Metering on new VM resource pools and measure their usage.
Monitoring servers through Windows PowerShell
The 70-417 exam is likely to test your knowledge of Windows PowerShell far more than did the exams you took to earn your Windows Server 2008 certification. For this reason, it’s a good idea to review the cmdlets related to monitoring.
Two of these cmdlets are new to Windows Server 2012 and Windows Server 2012 R2 and they both relate to virtual machine eventing, a minor feature that is still not well documented at the time of this writing. According to Get-Help and Windows PowerShell documentation athttp://technet.microsoft.com/en-us/library/hh848462, “[v]irtual machine eventing keeps Hyper-V PowerShell objects updated without polling the virtual machine host.” You should also be aware that it is enabled by default, and you can use the cmdlets Enable-VMEventing and Disable-VMEventing to reenable and disable the feature, respectively.
Use Table 5-1 to review some of the more important Windows PowerShell cmdlets and other commands that relate to server monitoring. (More cmdlets are available to manage events. For a full list, type get-command *event* | sort noun,verb at a Windows PowerShell prompt.)
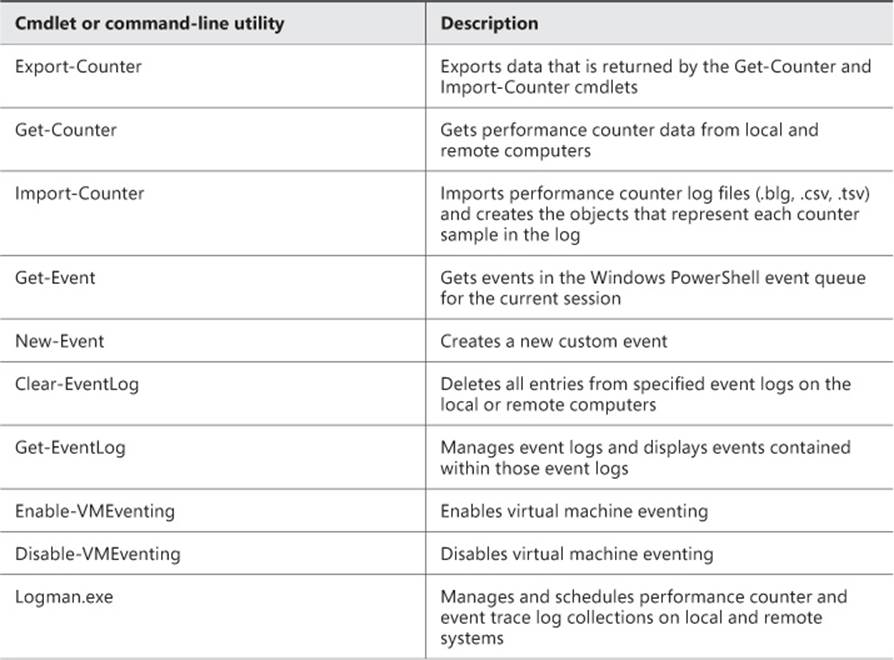
TABLE 5-1 Common command-line tools for server monitoring
 Exam Tip
The Deploy, Manage, and Maintain Servers domain is taken from the 70-411 exam. In its original form, it includes two additional objectives covering Windows Deployment Services (WDS) and Windows Server Update Services (WSUS), respectively. Even though these objectives aren’t officially indicated for the 70-417 exam, don’t be surprised if you see a question about either of these topics on this test. For WDS, you can review its features new to Windows Server 2012 at http://technet.microsoft.com/en-us/library/hh974416.aspx and its features new to Windows Server 2012 R2 at http://technet.microsoft.com/en-us/library/dn281955.aspx. For WSUS, you can install the server role and browse the options available through the Options node. Pay special attention to the Update Files options described athttp://technet.microsoft.com/en-us/library/cc708431(v=ws.10).aspx.
Reviewing older monitoring features
More than with other objectives, you should expect the Monitor servers objective on the 70-417 exam to be represented by questions about older topics that have not changed since Windows Server 2008. The topic of monitoring virtual machines (as distinct from Resource Metering in Hyper-V) is otherwise too narrow to account for a proportional representation of this objective on the exam. For this reason, make sure you review the older topics also indicated for this objective on the official exam page on the Microsoft website. (You can visit this page athttp://www.microsoft.com/learning/en-us/exam-70-417.aspx.) These topics include configuring Data Collector Sets (DCS), configuring alerts, monitoring real-time performance, monitoring events, configuring event subscriptions, configuring network monitoring, and scheduling performance monitoring. These are all topics you have already learned well enough to achieve your current certification.
In this section, we’ll point out two of these older topics that are particularly important for review.
Creating a Data Collector Set manually
When you create a new Data Collector Set in Performance Monitor in Windows Server 2012 or Windows Server 2012 R2, just as in Windows Server 2008, you are provided with two options: to create the new Data Collector Set from a template, or to create it manually.
If you choose to create the Data Collector Set manually, you are prompted to specify the type of data you want to include. You are provided with the following four options, which have not changed since Windows Server 2008:
![]() Performance Counter This option uses any set of performance counters you specify to gather and save data about the system’s performance.
Performance Counter This option uses any set of performance counters you specify to gather and save data about the system’s performance.
![]() Event Trace Data This option provides information about activities and system events, as opposed to performance counters.
Event Trace Data This option provides information about activities and system events, as opposed to performance counters.
![]() System Configuration Information This option allows you to record the value of specified registry keys as they change.
System Configuration Information This option allows you to record the value of specified registry keys as they change.
![]() Performance Counter Alert This option allows you to configure an action to take place (such as running a program) when a selected performance counter crosses a threshold value you specify.
Performance Counter Alert This option allows you to configure an action to take place (such as running a program) when a selected performance counter crosses a threshold value you specify.
Make sure you remember the purpose of all four of these data collection types for the 70-417 exam.
More Info
For additional information about creating a Data Collector Set manually, visit http://technet.microsoft.com/en-us/library/cc766404.aspx.
Exam Tip
Be prepared to answer questions in which you need to diagnose performance problems based on performance counter data. Remember the following guidelines:
![]() Memory\Pages/sec A sustained value of higher than 5 suggests a possible memory bottleneck
Memory\Pages/sec A sustained value of higher than 5 suggests a possible memory bottleneck
![]() PhysicalDisk\%Disk Time A sustained value of higher than 50% suggests a possible disk bottleneck
PhysicalDisk\%Disk Time A sustained value of higher than 50% suggests a possible disk bottleneck
![]() Processor\%Processor Time A sustained value of higher than 65% suggests a possible CPU bottleneck
Processor\%Processor Time A sustained value of higher than 65% suggests a possible CPU bottleneck
![]() A combination of high memory and processor usage, or a set of seemingly contradictory measurements, suggests a malfunctioning process.
A combination of high memory and processor usage, or a set of seemingly contradictory measurements, suggests a malfunctioning process.
Configuring and managing Data Collector Sets
After you create a new Data Collector Set, you can modify its settings and options. (These settings have not changed since Windows Server 2008.) For example, you can use the Data Manager settings on the shortcut (Actions) menu of a Data Collector Set to specify how (but not where) data is stored for each Data Collector Set. For example, you can configure Data Manager settings to automatically delete the data collected by a Data Collector Set when that data reaches a certain age or folder size.
Another option on the shortcut (Actions) menu of a Data Collector Set is the Save Template option. The Save Template option lets you export a Data Collector Set as an .xml file, which you can then import later on another computer.
For the 70-417 exam, also be sure to review the Data Collector Set properties tabs. You use the Directory tab, for example, to set a directory to store performance log data. You use the Stop Condition tab to determine when the Data Collector Set should stop running.
More Info
For more information about Data Manager settings, you can visit http://technet.microsoft.com/en-us/library/cc765998.aspx.
Objective summary
![]() In Windows Server 2012 and Windows Server 2012 R2, you can meter usage of resource pools (such as memory, processor, or Ethernet) on a VM host.
In Windows Server 2012 and Windows Server 2012 R2, you can meter usage of resource pools (such as memory, processor, or Ethernet) on a VM host.
![]() Use the Get-VMResourcePool cmdlet to display a list of all resource pools on a Hyper-V host running Windows Server 2012 or Windows Server 2012 R2.
Use the Get-VMResourcePool cmdlet to display a list of all resource pools on a Hyper-V host running Windows Server 2012 or Windows Server 2012 R2.
![]() Hyper-V hosts running Windows Server 2012 or Windows Server 2012 R2 have preconfigured resource pools, each named Primordial, that correspond to the aggregate amount of a resource on the host. You can create new resource pools that correspond to a subset of these primordial resource pools.
Hyper-V hosts running Windows Server 2012 or Windows Server 2012 R2 have preconfigured resource pools, each named Primordial, that correspond to the aggregate amount of a resource on the host. You can create new resource pools that correspond to a subset of these primordial resource pools.
![]() To configure Resource Metering of a resource pool, use the Enable-VMResourceMetering cmdlet and specify the name and type of the resource pool with the -ResourcePoolName and -ResourcePoolType parameters, respectively. Then, to view usage of the resource pool, use the Measure-VMResourcePool cmdlet.
To configure Resource Metering of a resource pool, use the Enable-VMResourceMetering cmdlet and specify the name and type of the resource pool with the -ResourcePoolName and -ResourcePoolType parameters, respectively. Then, to view usage of the resource pool, use the Measure-VMResourcePool cmdlet.
![]() Use the Enable-VMEventing and Disable-VMEventing cmdlets to enable and disable the feature called virtual machine eventing. Virtual machine eventing keeps Hyper-V PowerShell objects updated without polling the VM host.
Use the Enable-VMEventing and Disable-VMEventing cmdlets to enable and disable the feature called virtual machine eventing. Virtual machine eventing keeps Hyper-V PowerShell objects updated without polling the VM host.
![]() More than with other objectives officially listed for the 70-417 exam, it is important to review the older features about monitoring servers (such as Data Collector Sets and Event Subscriptions) that you learned for your Windows Server 2008 certification.
More than with other objectives officially listed for the 70-417 exam, it is important to review the older features about monitoring servers (such as Data Collector Sets and Event Subscriptions) that you learned for your Windows Server 2008 certification.
Objective review
Answer the following questions to test your knowledge of the information in this objective. You can find the answers to these questions and explanations of why each answer choice is correct or incorrect in the “Answers” section at the end of the chapter.
1. The Hyper-V server role has been installed on a server named HYPV01, which is hosting 10 VMs and has been configured with 32 GB of RAM. You want to determine average usage of the host server RAM over time by all of your guest VMs together. You have not yet configured Resource Metering of any resource pool or of any VMs.
You want to view the usage of the primordial RAM resource pool on HYPV01, and you want to do so with the greatest amount of administrative efficiency. Which of the following Windows PowerShell cmdlets should you use to achieve your goal? (Choose all that apply.)
A. Enable-VMResourceMetering
B. New-VMResourcePool
C. Measure-VM
D. Measure-VMResourcePool
2. The Hyper-V server role has been installed on a server named HYPV02, which is hosting six VMs and has been configured with 16 GB of RAM. One of the guest VMs that is running on HYPV02 is named DBSrv1. DBSrv1 has been allocated 8 GB of RAM. You are concerned that more RAM than necessary has been allocated to DBSrv1.
You want to measure average RAM usage by DBSrv1 during a period of high load, and you want to do so from a command-line interface on HYPV02. You have not yet configured Resource Metering of any resource pool or of any VMs.
Which of the following Windows PowerShell commands or cmdlets can you use to measure RAM usage by DBSrv1? (Choose all that apply.)
A. Enable-VMResourceMetering -ResourcePoolName DBSrv1 -ResourcePoolType Memory
B. Enable-VMResourceMetering -VMName DBSrv1
C. Measure-VM
D. Measure-VMResourcePool
3. You want to ensure that Hyper-V PowerShell objects are updated without polling the VM host. Which Windows PowerShell cmdlet can you use to achieve this goal?
A. Enable-VMEventing
B. Register-EngineEvent
C. Register-ObjectEvent
D. Get-EventSubscriber
 Thought experiment: Monitoring servers at Contoso
You are a network administrator for Contoso.com. One of Contoso’s application servers is named App1, which is running a Server Core installation of Windows Server 2012 R2. Company policy dictates that App1 be managed remotely only, and only through Windows PowerShell. None of the firewall exceptions have been enabled on App1 that would be required for remote management through graphical administration consoles.
You can find the answers to these questions in the “Answers” section.
1. Which Windows PowerShell cmdlet should you use to review individual event logs such as the System log on App1?
2. Which command-line utility can you use to create daily counter collection queries on App1?
3. Which Windows PowerShell cmdlet should you use to delete all entries from a specified event log on App1?
4. Which Windows PowerShell cmdlet should you use to display current performance counter data from App1?
Answers
This section contains the answers to the Objective Review and the Thought Experiment.
Objective 5.1: Review
1. Correct answers: A, D
A. Correct: If Resource Metering has not yet been configured, you will need to enable it on the primordial RAM resource pool before you can measure its usage.
B. Incorrect: You don’t need to create a new resource pool because you want to measure the usage of a primordial resource pool, which is built-in.
C. Incorrect: You would use the Measure-VM cmdlet if you wanted to measure usage of a particular VM, not of a particular resource pool. You could use the command Measure-VM * to display average RAM usage by each individual VM, but this is not the most efficient solution because it would require you then to add these values together to derive the aggregate RAM usage.
D. Correct: To view total usage of a resource pool by all VMs, use the Measure-VMResourcePool cmdlet.
2. Correct answers: B, C
A. Incorrect: This command would enable Resource Metering of a memory resource pool named DBSrv1. The question does not state that a resource with such a name has been created. In addition, you couldn’t use such a command to measure RAM usage by any one VM unless only one VM is running (which is not the case in this question).
B. Correct: This command would enable metering of all resources (including RAM) by the VM named DBSrv1.
C. Correct: This cmdlet allows you to measure resource usage by a particular VM. In this case, you would enter the command Measure-VM DBSrv1.
D. Incorrect: This cmdlet allows you to measure resource usage of a particular resource pool by all guest VMs. You cannot use it to measure resource usage by just one VM unless only one VM is running (which is not the case in this question).
3. Correct answer: A
A. Correct: The Enable-VMEventing cmdlet enables virtual machine eventing, which keeps Hyper-V PowerShell objects updated without polling the VM host. Virtual machine eventing is enabled by default, but running this command lets you ensure that it is enabled.
B. Incorrect: The Register-EngineEvent cmdlet enables you to subscribe to events that are generated by the Windows PowerShell engine and by the New-Event cmdlet. It doesn’t allow you to keep Hyper-V PowerShell objects updated without polling the VM host.
C. Incorrect: The Register-ObjectEvent cmdlet enables you to subscribe to the events that are generated by a Microsoft .NET Framework object. It doesn’t allow you to keep Hyper-V PowerShell objects updated without polling the VM host.
D. Incorrect: The Get-EventSubscriber cmdlet gets the event subscribers in the current session. It doesn’t allow you to keep Hyper-V PowerShell objects updated without polling the VM host.
Thought experiment
1. Get-EventLog. (You would normally use parameters to limit the output. For example, the command Get-EventLog System -Newest 25 retrieves only the most recent 25 events in the System event log.)
2. Logman.exe
3. Clear-EventLog
4. Get-Counter