PHP Advanced and Object-Oriented Programming (2013)
Visual Quickpro Guide
14. Debugging, Testing, and Performance
In This Chapter
Debugging Tools
Unit Testing
Profiling Scripts
Improving Performance
Review and Pursue
To conclude this book, I want to discuss three concepts you’ll most likely want to begin implementing as you go forward. By now you’re certainly comfortable with debugging, and so, first, it’s time to learn how to use third-party tools to make debugging easier. Second, there’s the concept of unit testing, which can greatly change how you write, and test, software. Finally, there is the subject of profiling and performance enhancing.
Note that most of this chapter’s material will require that you’re able to install software on your server. This can—and often should—be your own development computer, though.
Debugging Tools
When you first start programming, learning how to debug effectively is difficult. This is unfortunately ironic, because when you’re just starting, you’re doing a lot of debugging. Over time, however, you will pick up basic debugging skills and better understand the common causes of errors. And, hopefully, you’ll become a better programmer who writes code with fewer errors in the first place.
As you start doing more sophisticated programming, particularly that involving objects, the basic debugging approaches may no longer suffice. At some point, it becomes time to pick up a third-party debugging tool that will offer you more bang for your proverbial buck. The three most common PHP debugging tools are:
• Advanced PHP Debugger (APD; www.php.net/apd/)
• DBG (www.php-debugger.com/dbg/)
• Xdebug (www.xdebug.org)
All are reasonably good choices, but in this chapter, I want to discuss Xdebug. It has the features you’ll need and is well maintained (it was created by one of the core PHP developers, Derick Rethans). I’ll first explain how to install Xdebug, and then introduce some of its basic usage.
That being said, if you’re using a particular text editor or IDE for your PHP development, you ought to see if it supports Xdebug or another debugging tool. If so, you should enable and learn that debugger. By using a debugger enabled in your programming application, you will likely get other useful debugging features, such as the ability to create breakpoints and debug a PHP script as it runs.
Installing Xdebug
In order for you to use Xdebug, it must be installed and enabled in PHP. I’ll explain how to do that in the next sequence of steps. As with the installation of pretty much any software, the particulars will vary depending on the operating system in use. In the steps, I’ll explain how to install Xdebug on Windows. If you’re using a version of *nix, including Mac OS X, see the sidebar.
Installing Xdebug on *nix
Installing Xdebug on *nix systems, including Linux and Mac OS X, can either be stunningly easy or painfully hard, depending on many factors. In any case, you’ll need command-line access and the ability to execute commands as the super user. If you don’t already know what these mean, installing Xdebug on your system may not be for you.
Xdebug can be installed on *nix systems using PECL (http://pecl.php.net). Assuming you have PECL installed, then it’s just a matter of executing
pecl install xdebug
or
sudo pecl install xdebug
In theory, this will work. However, on my Mac, I had to take many, many steps to get this to work properly (largely because the tools PECL needs to work were not installed already).
If you also have problems, I’d recommend searching the Web or using my support forums for assistance.
To install Xdebug on Windows
1. Run a phpinfo() script to confirm that Xdebug is not already installed.
Xdebug is not likely to be installed, but it’s best to check nonetheless. The rest of the steps assume Xdebug is not already installed.
2. Check if the Xdebug extension already exists on your computer.
For example, if you installed XAMPP (www.apachefriends.org), the php_xdebug.dll file can be found in your <XAMPP install directory>\php\ext directory (e.g., C:\xamppp\php\ext).
If that DLL file or another usable Xdebug DLL file does exist on your computer, skip to Step 5.
3. If the Xdebug extension does not already exist on your computer, download it from www.xdebug.org.
Prebuilt Windows extensions are available in several flavors from the downloads page  . If you’re unsure which variant you should download, see the custom installation instructions page. On that page, you can paste the output from a phpinfo() script, and it will tell you precisely which file to download.
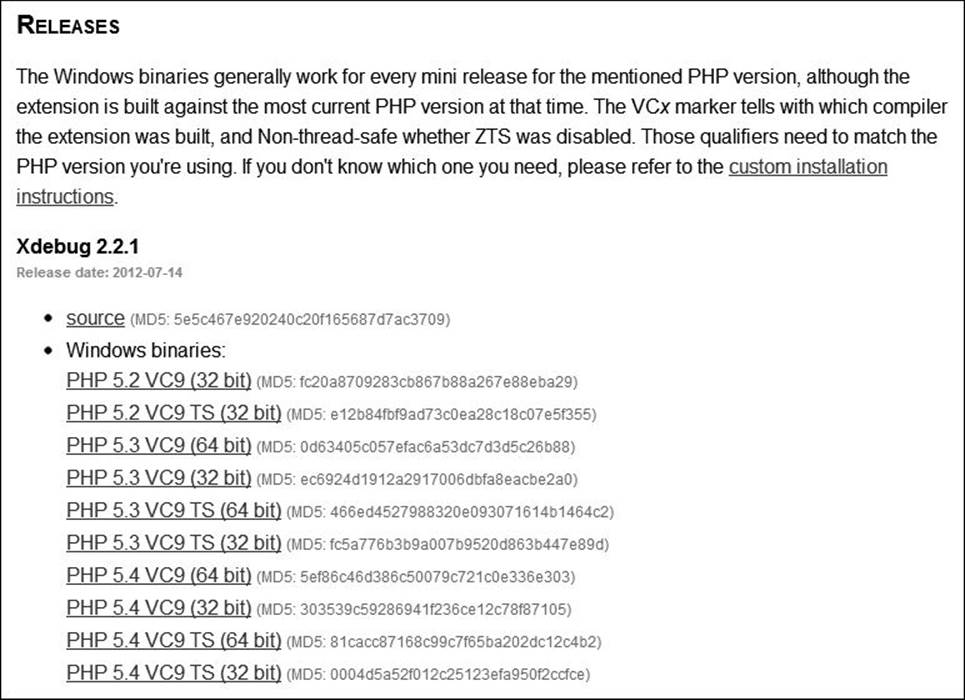
 Download a prebuilt version of Xdebug that matches your Web server configuration.
4. Move the downloaded file into a logical directory on your computer.
It’d make the most sense to place it in the same directory as your other PHP extensions.
5. Open your PHP configuration file in a text editor or IDE.
If you don’t know what your active PHP configuration file is, check the output from a phpinfo() script.
6. Enable the Xdebug extension by adding this line:
zend_extension = "C:\xampp\php\ext\php_xdebug.dll"
You should first search the file to see if Xdebug isn’t already referenced. For example, using XAMPP, that line already exists but is commented out (i.e., it’s prefaced by a semicolon). In that case, enabling the extension is just a matter of removing the semicolon.
If Xdebug is not referenced, you need to add that line.
In any case, make sure that the path to the DLL file is accurate for your system.
7. Save the PHP configuration file.
8. Restart your Web server.
9. Rerun a phpinfo() script to confirm that Xdebug is enabled  .
.
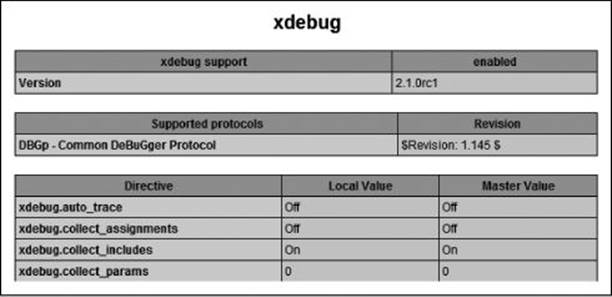
Xdebug is now enabled!
Tip
Xdebug will conflict with some other PHP extensions and can adversely affect performance of scripts and the Web server. For these reasons, I recommend that you not install Xdebug on a production server.
Tip
Although Xdebug is open source, and therefore free, “support agreements” are available. These are essentially donations to Derick Rethans for the work he has done creating and supporting Xdebug.
Using Xdebug
Once you’ve successfully installed Xdebug, you can start using it in your scripts. There’s really not much to that—Xdebug does all the heavy lifting for you. The following will explain how to use the new features Xdebug adds to your PHP installation.
To use Xdebug
• Use var_dump() to learn more about any particular variable  .
.
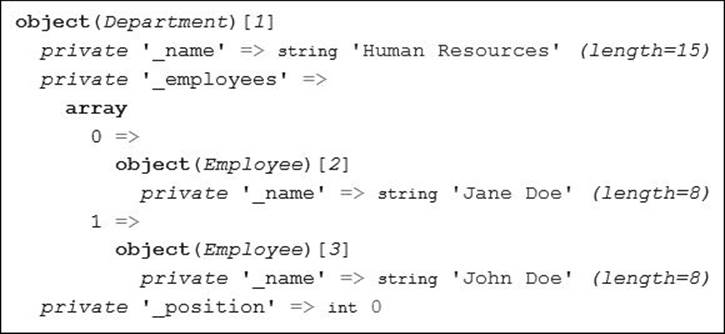
 Xdebug makes the var_dump() output more information and easier to use.
The first feature that Xdebug adds that you should take advantage of is a more useful and attractive var_dump() output:
# Iterator.php - Script 9.9
// other code
var_dump($hr);
Presumably, you’re already using var_dump() as a debugging tool, and now it’s just better.
• If you’re specifically interested in the values of any global variables, invoke the xdebug_dump_superglobals() function  :
:
xdebug_dump_superglobals();
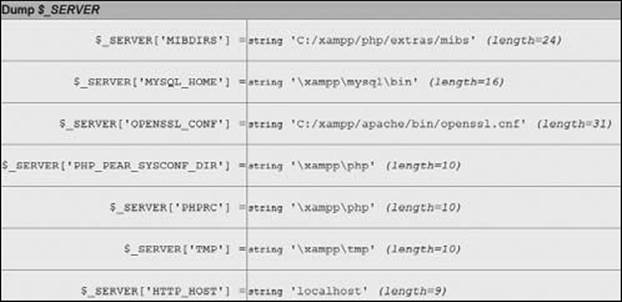
 A pretty display of the global variables and values received by a page.
• To adjust what specific global variables are shown, change how Xdebug runs:
ini_set('xdebug.dump.SERVER', '*');
ini_set('xdebug.dump.GET', 'something');
Xdebug can be configured in a couple of ways (see the sidebar), but using ini_set() within the script is simple and direct. The previous two lines of code say that you want to see all of the $_SERVER values but only $_GET['something'].
To be clear, those lines need to be added before the xdebug_dump_superglobals() function call.
• To show undefined values, too, add this code:
ini_set('xdebug.dump.undefined', 'on');
By default, the xdebug_dump_superglobals() function does not show undefined values. To change that behavior, turn that setting on.
• To see what else Xdebug does for you, manually create a (non-parse) error and rerun the script  .
.
Another benefit of using Xdebug arises without adding any extra code to a script. When an error occurs, Xdebug will automatically output a very useful stack trace  . This is equivalent to invoking debug_print_backtrace(), plus some HTML formatting.
 Error messages are now displayed in a prettier, and slightly more informative, format.
There are a couple of caveats about this, however. Xdebug will not print stack traces if the following is true:
Customizing Xdebug
You can customize how Xdebug runs in one of two ways. The first is to use the ini_set() function. This function can be used to change many different PHP settings, including those in Xdebug. Alternatively, you can directly edit the PHP configuration file.
The arguments for doing the latter are first, that you only have to make changes once and they’ll apply to all scripts. Second, the changes will apply even if the script has a parse error. The negatives are that you have to have permission to edit the PHP configuration file—and be comfortable doing so, and that you have to restart the Web server with every change.
It’s easier to use ini_set(), but you have to add the necessary code to every file, or create an includable file that does the same. Invocations of ini_set() also have no effect if the PHP script has a parse error.
However you decide to customize Xdebug’s behavior, see the Xdebug documentation for all of the possible options.
• The display_errors setting is disabled (which should not be the case on a development server anyway).
• You’re using your own custom error handler.
• Exceptions are thrown.
The next two bullets explain how to circumvent these last two issues.
• To use Xdebug output in your own error handler, call
xdebug_get_function_stack();
This function returns the Xdebug output for you.
• To enable Xdebug handling of exceptions, use this  :
:
 Xdebug’s stack trace for a thrown exception.
ini_set('xdebug.show_exception_trace', 'on');
• To have Xdebug report on the values passed to functions, use this  :
:
 Xdebug’s more detailed information about a specific function call
  .
.
ini_set('xdebug.collect_params', '4');
There are other possible values, from the default of 0 (if you do not want to show those values) to 4, which shows the most amount of information.
• For even more information about function calls, have Xdebug show the value of local variables:
ini_set('xdebug.show_local_vars', 'on');
Tip
An alternative way to use Xdebug is to have it write all the data to a trace log. This is a separate file that you would then need to review.
Unit Testing
Unit testing is a relative newcomer to programming, but it is an approach that many developers have embraced. The premise of unit testing is that you define tests to confirm that particular bits of code work as needed.
Here are a few of the benefits of unit testing:
• Tests will minimize bugs (this is the most obvious benefit).
• Tests can help you improve your design.
• Tests can assist in creating documentation for your code.
• You are less likely to break code and introduce errors as you make changes down the line.
Learning how to implement unit testing involves syntax and theory. I’ll introduce both in this chapter.
As for unit testing theory, unit tests should
• Be easy to write, read, and execute.
• Be as atomic as possible (i.e., specific and small).
• Check that code works as intended.
• Not be used to validate user input.
• Not be used to handle problems that could possibly arise during the live execution of a site.
To put these ideas in context, remember that error and exception handling in your code should watch for bad things that could possibly happen. This might be poor user input or an inability to open a file. Unit testing, as a comparison, should test for what absolutely should happen and what absolutely shouldn’t. You’ll see specific examples shortly.
As the scope of the application increases, and as you add and modify the code, you continue to write tests for the new code, while still checking all of the original code against the existing tests, too. By doing this, you ensure that the introduction of new and modified code doesn’t break something that was previously working.
The best way to implement unit testing is to use one of the many libraries available for the purpose. The de facto standard is PHPUnit (www.phpunit.de). Over the next several pages, I’ll explain how to define tests and run your code against them.
Tip
A popular alternative to PHPUnit is Simpletest (www.simpletest.org).
Test-Driven Development
In this chapter, the focus is on writing unit tests to validate existing code. Another approach is called test-driven development (TDD). It takes the opposite stance: you define your tests and then write code that passes those tests.
Although this approach may be counterintuitive, there’s a lot to be said for it. Besides the unit-testing benefits already outlined, TDD also means:
• You won’t end up writing tests to match the code (which, therefore, defeats the purpose of testing).
• You have targets to shoot for, in terms of features needed and what isn’t required.
• You know when the code is done, because all the tests pass.
• You’re less likely to experience “coder’s block,” because you’ll have a running list of what to code next.
TDD is related to the concept of extreme programming, which, as you might imagine, is an entirely different way of creating software.
Installing PHPUnit
In order to use PHPUnit, you must first install it. It’s available through PEAR (http://pear.php.net). If you haven’t used PEAR before, check out the PEAR manual (or search the Web, or ask in my support forums) for more instructions.
To install PHPUnit
1. Access your computer via a command-line interface.
If you’re not accustomed to using the command line, these steps may be a bit advanced for you.
2. Upgrade PEAR  :
:
pear upgrade-all
Upgrading PEAR and all the other packages.
PHPUnit recommends that you upgrade PEAR before installing PHPUnit. This command will upgrade all the PEAR packages (including PEAR itself).
Note that on non-Windows operating systems, you may need to preface this command with sudo:
sudo pear upgrade-all
You may also need to provide a full path to PEAR:
sudo /path/to/pear upgrade-all
Or (on Windows with XAMPP):
C:\xampp\php\pear upgrade-all
Again, search online or use the support forums if you have difficulty with this.
3. Install PHPUnit :
PHPUnit has been successfully installed.
pear config-set auto_discover 1
pear install pear.phpunit.de/PHPUnit
PHPUnit does not reside in the normal PEAR locations (aka, channels), so the first command is necessary in order to download PHPUnit from the PHPUnit.de Web site.
Again, you may need to preface these commands with sudo and/or the full path to PEAR.
You should see a message  upon successful completion.
Defining tests
Unit tests are defined using assertions. An assertion is a programming concept that simply says: confirm that this is the case.
In theory, you could define your own assertion functions, but one of the benefits of a unit-testing framework such as PHPUnit is the number of assertion functions it defines for you:
• assertContains()
• assertCount()
• assertEquals()
• assertFalse()
• assertFileExists()
• assertGreaterThanOrEqual()
• assertNull()
• assertRegExp()
• assertSame()
• assertTrue()
That’s just a smattering of the assertion functions that exist. For a full listing, and to see how each is used, see the PHPUnit manual.
To create a unit test, you need to match an assertion function with the goal of the particular test. For example, the following code would assert that $needle is found in $haystack:
assertContains($needle, $haystack);
Because this is an assertion, this test would fail if the needle is not found within the haystack. This is functionally equivalent to
if (!in_array($needle, $haystack)) {
echo 'The test has failed!';
}
As another example, this code asserts that $var equals PHPUnit:
assertEquals('PHPUnit', $var);
Using code examples from this book, the check_urls.php file (Script 11.2) has a check_url() function that is supposed to return an array containing two elements. You can test for that:
$results = check_url($url);
assertCount(2, $results);
Or, as another example, the getName() method of the Employee class (used in various formats in various chapters) should return the given Employee object’s name. Here’s that test:
$e = new Employee('Chuck');
assertEquals('Chuck', $e->getName());
This may seem a bit silly and redundant, but that’s kind of the point: let’s confirm that the code does exactly—and only—what it’s supposed to do.
Assertions are at the heart of unit testing: what is it that must be the case. In theory, each test should assert one specific idea, although sometimes a test may assert a couple of very similar ideas.
Tip
PHPUnit is also capable of validating output (what would be printed) via PHP’s output buffering. See the PHPUnit manual for details.
Tip
Most PHP errors will also equate to a test failure in PHPUnit.
Creating test cases
Tests in PHPUnit get grouped together in a suite of test cases. Normally, one suite of test cases would be created for each class you’ve defined. Understand that unit testing is not specific to object-oriented programming but is more commonly used with OOP than with procedural programming, particularly when frameworks are involved.
With PHPUnit installed, you create a test suite by extending the PHPUnit_Framework_TestCase class:
class SomeClassTest extends PHPUnit_Framework_TestCase {
}
Conventionally, you’ll name the new class a combination of the name of the class being tested, followed by Test.
Within this class, create one new public method for each test. Each method’s name should start with test:
function testSomething() {
// Actual test.
}
There won’t be a one-to-one correlation between the number of test methods defined and the number of methods in the class being tested. This is because class methods may be complex and do multiple things, whereas unit tests are intended to be small and specific.
The last thing to know before getting into an example is that you must invoke all the assertion methods via $this:
function testSomething() {
$this->assertTrue($var);
}
Using the $this object is necessary because when PHPUnit goes to run the tests, it will create an object of the class type. Through that object, the tests will be run, and the assertion functions will be accessible via $this.
To demonstrate unit testing, let’s create some unit tests for the Rectangle class, first introduced in Chapter 4, “Basic Object-Oriented Programming.” In this next sequence of steps, you’ll create just a single test and then learn how to run that. Subsequently, you’ll create all the requisite tests.
To create a test case
1. Begin a new PHP script in your text editor or IDE, to be named RectangleTest.php (Script 14.1):
<?php # RectangleTest.php - Script 14.1
2. Include the Rectangle class:
require('Rectangle.php');
In order to actually test the class, this class will need to make objects of that class type. Therefore, this page must also include that class definition.
Script 14.1. This shell defines one unit test.
1 <?php # RectangleTest.php - Script 14.1
2 // This page defines the RectangleTest class.
3
4 // Need the Rectangle class in order to work:
5 require('Rectangle.php');
6
7 // Define the class:
8 class RectangleTest extends PHPUnit_Framework_TestCase {
9
10 // Test the getArea() method:
11 function testGetArea() {
12
13 // Need a Rectangle:
14 $r = new Rectangle(8,9);
15
16 // The assertion tests the math:
17 $this->assertEquals (72, $r->getArea());
18
19 } // End of testGetArea() method.
20
21 } // End of RectangleTest class.
3. Begin defining the test class:
class RectangleTest extends PHPUnit_Framework_TestCase {
This class inherits from the PHPUnit_Framework_TestCase class.
4. Start defining the getArea() test method:
function testGetArea() {
This test will verify that the Rectangle class’s getArea() method works as it should. Remember that all tests must begin with the word test.
5. Create a Rectangle object:
$r = new Rectangle(8,9);
The test needs this object in order to access the method being tested.
6. Define the assertion:
$this->assertEquals(72, $r->getArea());
The getArea() method of the Rectangle class should return the value of the rectangle’s height times its width. With dimensions of 8 and 9, that value should be 72. This assertion says that it’s expected that 72 is the result of the getArea() call.
7. Complete the method and the class:
} // End of testGetArea() method.
} // End of RectangleTest class.
8. Save the file as RectangleTest.php.
As you’re about to see, the tests themselves will be run from the command line, so the file does not need to be saved to your Web directory.
9. Save a copy of Rectangle.php in the same directory as RectangleTest.php.
Tip
Xdebug supports the ability to check the amount of code coverage: how much of the written code is covered by unit testing. See the Xdebug manual for details.
Running tests
Once you’ve created a suite of tests, they can be run. This is normally done through the command line by executing the phpunit command:
phpunit SomeTest
This code will run the tests defined in SimpleTest.php and output the results. That’s all there is to it! Note that you don’t have to include the .php extension, as long as the test name is the same as the file it’s in.
To run your tests
1. Access your computer via a command-line interface.
2. Move to the directory where you stored RectangleTest.php:
cd /path/to/dir
Obviously, you’ll need to change this to be correct for your system.
3. Run the tests  :
:
phpunit RectangleTest
The one test successfully passed!
Again, depending on your computer, you may need to provide a full path to the PHPUnit utility.
4. Fix your code until it passes every test.
In the output, a period indicates success and an F indicates failure . E means error and I means incomplete, or not yet implemented.
If there was a bug in the code, the test would have failed.
5. Celebrate!
Tip
There are ways to run PHPUnit tests using code in your Web browser. Search online for examples.
Tip
Although it may seem like a pain to run tests through the command line (as opposed to the Web browser), you can easily automate the process. When you have a lot of tests to run for a lot of classes, this is a much easier option.
Tip
Depending on the operating system and the PHPUnit configuration, you may or may not need to include the class definition of the class being tested.
Script 14.2. How you might use a setUp() method to help test the WriteToFile class from Chapter 8.
1 <?php # WriteToFileTest.php - Script 14.2
2 // This page defines the WriteToFileTest class.
3
4 // Need the WriteToFile class in order to work:
5 require('WriteToFile.php');
6
7 // Define the class:
8 class WriteToFileTest extends PHPUnit_Framework_TestCase {
9
10 // Need this information:
11 private $_fp = NULL;
12 private $_file = 'somefile.txt';
13 private $_data = 'test data';
14
15 // Open the file for writing:
16 function setUp() {
17 $this->_fp = fopen($this->_file, 'w');
18 }
19
20 // Write and test:
21 function testWrite() {
22 fwrite($this->_fp, $this->_data);
23 $this->assertEquals($this->_data, file_get_contents($this->_file));
24 }
25
26 // Close the file:
27 function tearDown() {
28 fclose($this->_fp);
29 }
30
31 } // End of class.
Setting up tests
One of the hardest aspects of unit testing is accurately replicating how the code will be used in the real world. For example, almost always, something will have to happen before an assertion can be made, even something as simple as the creation of an object in order to test its methods. You can see an example of this in the RectangleTest suite. Those things you need in order to perform a test are called “fixtures” in unit-testing parlance.
In theory, you could create your fixtures in the testing method, as in the testGetArea() example. But if multiple tests all require the same fixture, there’s a better alternative: define a setUp() method:
function setUp() {
// Create object or whatever.
}
The setUp() method will automatically be called before each test is run. There is a corresponding tearDown() method that will be called after each test is run. For example, the setUp() method might open a file for writing, the test will confirm that the file can be written to successfully, andtearDown() would close the file (Script 14.2).
Note that you won’t need tearDown() methods as often as you will setUp(). Also, each of these methods will be called before and after each individual test, not at the beginning and end of the entire test suite.
Let’s complete the Rectangle class suite by adding a setUp() method and more tests.
To use a setUp() method
1. Open RectangleTest.php (Script 14.1) in your text editor or IDE, if it is not already.
2. Add an attribute that will store a Rectangle object (Script 14.3):
protected $r;
This variable will be instantiated in the setUp() method.
3. Define the setUp() method:
function setUp() {
$this->r = new Rectangle(8,9);
}
This method creates a new object and assigns it to the attribute. To make this class even easier to read and use, you could place the width and height dimensions in class attributes, too.
4. Change the testGetArea() method so that it uses the attribute:
function testGetArea() {
$this->assertEquals(72, $this->r->getArea());
}
Now this method can refer to the class attribute, instead of creating its own object.
5. Define the getPerimeter() test:
function testGetPerimeter() {
$this->assertEquals(34, $this->r->getPerimeter());
}
This is similar to the getArea() test, but the math is different.
6. Define the isSquare() test:
function testIsSquare() {
$this->assertFalse($this->r->isSquare());
$this->r->setSize(5,5);
$this->assertTrue($this->r->isSquare());
}
The original rectangle object will not be a square, and the first assertion confirms that. To test that the method works properly when it should be a square, the rectangle is first resized.
Script 14.3. The complete suite of tests for the Rectangle class.
1 <?php # RectangleTest.php - Script 14.3 #2
2 // This page defines the RectangleTest class.
3
4 // Need the Rectangle class in order to work:
5 require('Rectangle.php');
6
7 // Define the class:
8 class RectangleTest extends PHPUnit_Framework_TestCase {
9
10 // For storing the Rectangle object:
11 protected $r;
12
13 // Create an object to use:
14 function setUp() {
15 $this->r = new Rectangle(8,9);
16 }
17
18 // Test the getArea() method:
19 function testGetArea() {
20 $this->assertEquals(72, $this->r->getArea());
21 }
22
23 // Test the getPerimeter() method:
24 function testGetPerimeter() {
25 $this->assertEquals(34, $this->r->getPerimeter());
26 }
27
28 // Test the isSquare() method:
29 function testIsSquare() {
30
31 // Should not be a square in this case!
32 $this->assertFalse($this->r->isSquare());
33
34 // Make it a square and test again:
35 $this->r->setSize(5,5);
36 $this->assertTrue($this->r->isSquare());
37
38 }
39
40 // Test the setSize() method:
41 function testSetSize() {
42 $w = 5;
43 $h = 8;
44 $this->r->setSize($w, $h);
45 $this->assertEquals($w, $this->r->width);
46 $this->assertEquals($h, $this->r->height);
47 }
48
49 } // End of RectangleTest class.
7. Define the setSize() test:
function testSetSize() {
$w = 5;
$h = 8;
$this->r->setSize($w, $h);
$this->assertEquals($w, $this->r->width);
$this->assertEquals($h, $this->r->height);
}
You don’t want to just assume that any method, including something as simple as setSize(), works properly. So this test first changes the rectangle’s size and then confirms the results.
8. Save the file and run the tests .
All of the new tests have been run and successfully passed.
Tip
Unit testing involving databases requires a fair amount of extra knowledge. See the PHPUnit manual for specifics and examples.
Profiling Scripts
Moving on from debugging and testing, a more advanced skill to pick up is profiling your scripts. Profiling is the process of analyzing a script to see where there may be performance problems: slow bits of code and process bottlenecks. Once you’ve got a script completely working, profiling in order to make performance improvements is a prudent next step.
There are several profiling tools available for PHP, starting with the debugging utilities already mentioned: APD, DBG, and Xdebug. Since I’ve already explained how to install Xdebug, let’s use it.
However, profiling in Xdebug requires that you install another tool. Xdebug outputs its profiling data in a “cachegrind” format. Historically, this was readable by utilities such as KCacheGrind, originally written for Linux. While there are other utilities now available, it may be easiest to install webgrind (https://github.com/jokkedk/webgrind).
The next sequence will explain how to configure Xdebug to perform profiling, and how to install webgrind. In the following section of the chapter, you’ll learn what to do with the results.
To use Xdebug with webgrind
1. Download webgrind.
The webgrind package is hosted at Github. You can download it from there, using the URL already mentioned.
2. Unzip webgrind.
Webgrind comes as a zip file that must be expanded.
3. Move the resulting webgrind folder into your Web server directory.
Webgrind is written in PHP, which means it needs to be on a PHP-enabled server and accessed through a Web browser.
4. Open your php.ini file in a text editor or IDE.
The next step is to enable Xdebug in your PHP configuration file.
5. Add these lines of code :
xdebug.profiler_enable = 1
xdebug.profiler_output_name = cachegrind.out.%t.%p
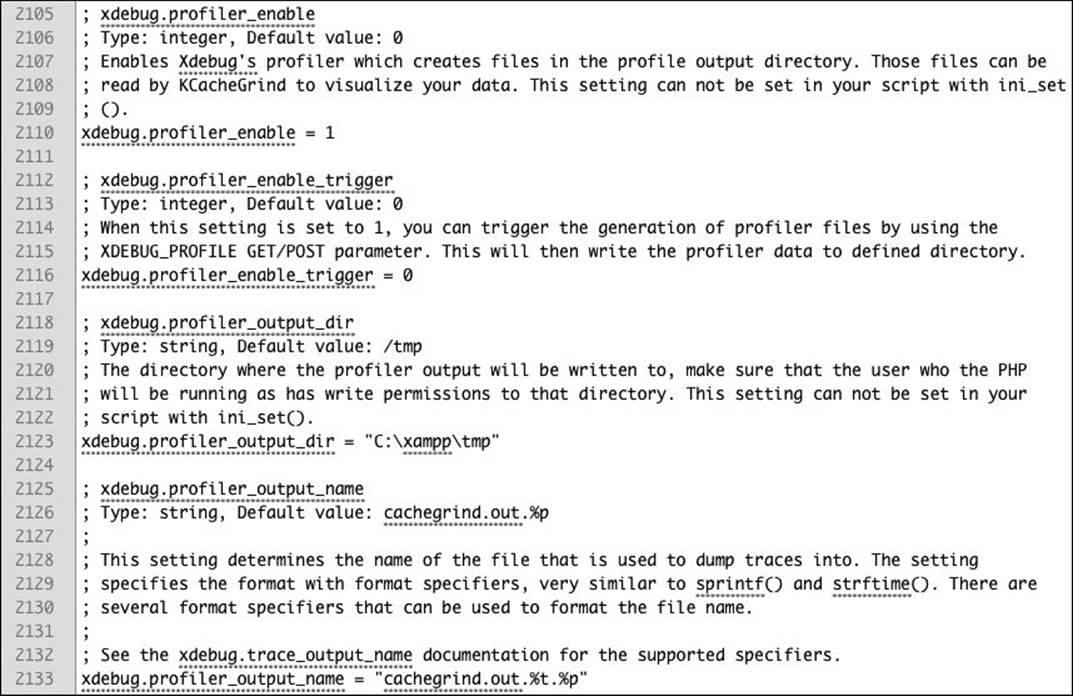
The relevant Xdebug configuration area of the php.ini file.
The first line turns the profiler on. The second line specifies the filename format for the profiling output. The filename will be cachegrind.out followed by a timestamp, followed by the process id.
You may also need to set the profiler_output_dir to a writable temporary directory  .
.
6. Save the php.ini file.
7. Restart your Web server.
8. Run any PHP script to have Xdebug profile it.
Tip
There’s a strong argument for profiling your scripts as they run on the production server. But after doing so, be sure to disable Xdebug for better overall performance.
Tip
Profile data files can get quite large. You’ll want to watch the profiling output directory to clear those out once they’re no longer needed.
Tip
Xdebug can be configured to only profile a script if a certain value is passed in the URL or a cookie, which is a good idea.
Tip
You probably won’t need to configure how webgrind itself works, as it uses Xdebug’s configuration by default. But if you do, just open the webgrind config.php file.
Improving Performance
Once you’ve started profiling your Web applications and scripts, you’ll start to see how you can improve their performance. In looking at the profiling output, you can identify where the bottlenecks are. I’ll explain the simple steps for viewing the profiling output in a moment, but first I’ll explain what you should be watching for in the profiling results.
Start by looking at two possible indicators of inefficiency:
• Processes that take disproportionately more time than the others
• Processes that take disproportionately more time than they should
You should not focus on the specific amount of time different bits of code require to execute. Those times are unlikely to be that accurate. At the very least, the mere act of profiling a script is going to drag down its performance. Instead, look at the time a process takes relative to the whole script. There will be processes that you would expect to take a lot of time, but there will also be those that shouldn’t. Look at the first category in hopes of making significant gains; look at the second because something may be amiss.
Implementing Server Caches
A great, but more advanced, way to improve the performance of your script is to implement server-side caching. Just as browsers cache resources so they don’t have to be re-downloaded, you can have a server cache different Web components so that they don’t have to be re-executed.
There are several types of caches you can implement. To start, you can cache the output of a script, which is to say the generated HTML. Once cached, the server can provide the static HTML file upon request, rather than rerun the underlying PHP script.
Second, you can implement opcode caching. PHP is an interpreted language. This means that at runtime—when a user requests a page, the server must read the PHP code and compile it into another code format, which is then executed. Opcode caching stores a version of the compiled code in server memory. This stored version can then be executed upon subsequent requests, saving the time and processing required to perform the compilation.
Depending on your database application, you may have query caching, too. There are variations on this, starting with having the database store the results of a query so that the query does not need to be executed again. Similarly, many database applications can “remember” or internally optimize queries. In such cases, the queries will still need to be executed, but they can be executed more efficiently.
For many of these caches, good PEAR classes and PECL extensions are available, such as the Alternative PHP Cache (APC). You can also see the documentation for your database application and look online for other tutorials.
Over time, by profiling and tweaking your code, you’ll begin to pick up patterns. In particular, input/output operations will normally be the most expensive:
• Working with files
• Interacting with databases
• Networking (i.e., communicating with other servers)
• Interacting with the server (this includes working with files and databases, of course, as well as sending emails, calling other utilities, and so forth)
Your code is probably not unnecessarily doing any of these things, but they’re worth investigating to see if you can’t minimize or optimize those interactions.
You’ll also find that user-defined functions can have a significant performance impact. In the profiling data, take a look at the function call counts: how many times a function is called. Then look into optimizing those that are called most frequently.
Other bottlenecks will arise from loops and working with large sets of data, such as XML or a big array.
Most importantly, make sure you don’t introduce bugs as you make optimization tweaks. Of course, having unit testing in place will guard against doing so!
Just like you (hopefully) make fewer mistakes the longer you’ve been programming, in time you should be writing more efficient code after you’ve been profiling for a while.
To view the profile log in webgrind
1. Load webgrind in your browser.
This should be just a matter of going to http://<domain>/<webgrinddir>.
(The downloaded file from Github has a longer name, but I rename the directory webgrind.)
2. Use the form at the time of the page to select what profile you want to view .
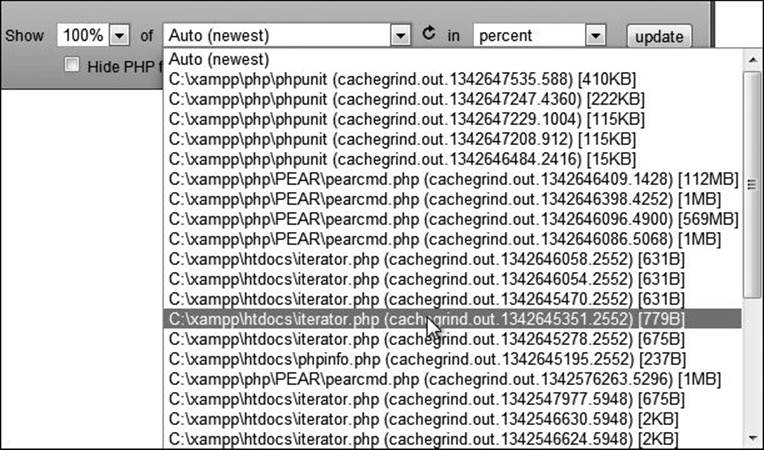
The webgrind interface for choosing a script profile data to view.
At first, you’ll probably want to view 100% of the profile data. Use the second select menu to choose the script being profiled. Then make sure you’re viewing information in percent, as already explained.
3. Use the columns at the top of the table to sort by different criteria .
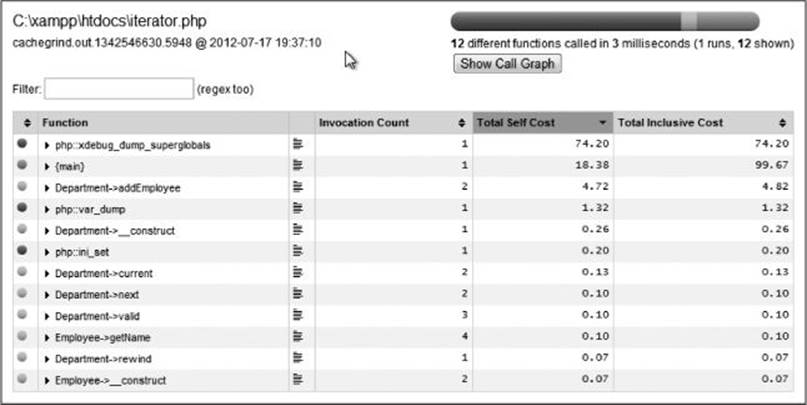
The profile data for the iterator.php script, run while using Xdebug.
Start by looking at the total self cost. This is the time required to execute a given function, not counting any function calls that function may make. The total inclusive cost also reflects the time taken to execute functions that are called.
Next, look at the invocation count. A high invocation count with a low total self cost is good; the opposite may be a problem.
4. Click the arrow next to a function reference to see more information.
You’ll see that the format presents PHP’s own functions using the syntax php::function_name. Class methods are presented using ClassName->method Name. The code outside of any function or class is listed under {main}.
For a comparison of self cost vs. inclusive cost, you’ll see that {main} will have a total cost of nearly 100%, which makes sense, because {main} represents all of the code being executed. However, the self cost for {main} will be much lower, as the primary code invokes lots of other functions and methods.
5. Find a potential problem, attempt to optimize the code, and re-profile.
6. Repeat Step 5!
Tip
You can normally make the biggest performance difference by throwing money at the problem. This includes buying new hardware (e.g., multiple servers) or upgrading the hardware you have. That’s not always feasible, however.
Review and Pursue
If you have any problems with these sections, either in answering the questions or pursuing your own endeavors, turn to the book’s supporting forum (www.LarryUllman.com/forums/).
Review
• What is Xdebug? What useful features does it provide? (See pages 457 through 459.)
• What is unit testing? What are the benefits of unit testing? (See page 460.)
• What are some of the properties that unit tests should exhibit? (See page 460.)
• What is TDD? (See page 461.)
• What are assertions? How do you invoke the assertion methods within the test class? (See page 462.)
• How do you create a test case (a suite of tests) using PHPUnit? How do you create an individual test? (See pages 463–464.)
• What is profiling? What is webgrind? (See page 471.)
• What kinds of things should you be watching for in profile data? (See pages 473 and 474.)
Pursue
• If you’re not entirely satisfied or impressed with Xdebug, consider installing and trying an alternative debugging or profiling tool.
• Begin using Xdebug as you develop new projects.
• Do more research on unit testing.
• Do more research on PHPUnit.
• Apply unit testing to as many script examples as you want from this book, or to your own code.
• If you like the concept of unit testing, look into TDD.
• Profile some of your own scripts and see what improvements can be made.
• Look into server-side caching.
More Application Testing
There are many ways of testing a script or application’s performance, from benchmarking (simple timing of a script) to profiling to load testing. Load testing is where you emulate multiple concurrent users to see how the whole server responds.
Many utilities are available to help you perform load testing, including ab (ApacheBench), httperf, and siege. On the other side of the equation, I recommend using a utility such as YSlow! (this is a Firefox Web browser extension) to analyze the HTML and other resources the browser is required to download for your site. Many online sites can also run performance tests on a single page request and make decent recommendations on the results.
In This Chapter
Debugging Tools
Unit Testing
Profiling Scripts
Improving Performance
Review and Pursue
To conclude this book, I want to discuss three concepts you’ll most likely want to begin implementing as you go forward. By now you’re certainly comfortable with debugging, and so, first, it’s time to learn how to use third-party tools to make debugging easier. Second, there’s the concept of unit testing, which can greatly change how you write, and test, software. Finally, there is the subject of profiling and performance enhancing.
Note that most of this chapter’s material will require that you’re able to install software on your server. This can—and often should—be your own development computer, though.
Debugging Tools
When you first start programming, learning how to debug effectively is difficult. This is unfortunately ironic, because when you’re just starting, you’re doing a lot of debugging. Over time, however, you will pick up basic debugging skills and better understand the common causes of errors. And, hopefully, you’ll become a better programmer who writes code with fewer errors in the first place.
As you start doing more sophisticated programming, particularly that involving objects, the basic debugging approaches may no longer suffice. At some point, it becomes time to pick up a third-party debugging tool that will offer you more bang for your proverbial buck. The three most common PHP debugging tools are:
• Advanced PHP Debugger (APD; www.php.net/apd/)
• DBG (www.php-debugger.com/dbg/)
• Xdebug (www.xdebug.org)
All are reasonably good choices, but in this chapter, I want to discuss Xdebug. It has the features you’ll need and is well maintained (it was created by one of the core PHP developers, Derick Rethans). I’ll first explain how to install Xdebug, and then introduce some of its basic usage.
That being said, if you’re using a particular text editor or IDE for your PHP development, you ought to see if it supports Xdebug or another debugging tool. If so, you should enable and learn that debugger. By using a debugger enabled in your programming application, you will likely get other useful debugging features, such as the ability to create breakpoints and debug a PHP script as it runs.
Installing Xdebug
In order for you to use Xdebug, it must be installed and enabled in PHP. I’ll explain how to do that in the next sequence of steps. As with the installation of pretty much any software, the particulars will vary depending on the operating system in use. In the steps, I’ll explain how to install Xdebug on Windows. If you’re using a version of *nix, including Mac OS X, see the sidebar.
Installing Xdebug on *nix
Installing Xdebug on *nix systems, including Linux and Mac OS X, can either be stunningly easy or painfully hard, depending on many factors. In any case, you’ll need command-line access and the ability to execute commands as the super user. If you don’t already know what these mean, installing Xdebug on your system may not be for you.
Xdebug can be installed on *nix systems using PECL (http://pecl.php.net). Assuming you have PECL installed, then it’s just a matter of executing
pecl install xdebug
or
sudo pecl install xdebug
In theory, this will work. However, on my Mac, I had to take many, many steps to get this to work properly (largely because the tools PECL needs to work were not installed already).
If you also have problems, I’d recommend searching the Web or using my support forums for assistance.
To install Xdebug on Windows
1. Run a phpinfo() script to confirm that Xdebug is not already installed.
Xdebug is not likely to be installed, but it’s best to check nonetheless. The rest of the steps assume Xdebug is not already installed.
2. Check if the Xdebug extension already exists on your computer.
For example, if you installed XAMPP (www.apachefriends.org), the php_xdebug.dll file can be found in your <XAMPP install directory>\php\ext directory (e.g., C:\xamppp\php\ext).
If that DLL file or another usable Xdebug DLL file does exist on your computer, skip to Step 5.
3. If the Xdebug extension does not already exist on your computer, download it from www.xdebug.org.
Prebuilt Windows extensions are available in several flavors from the downloads page ![]() . If you’re unsure which variant you should download, see the custom installation instructions page. On that page, you can paste the output from a phpinfo() script, and it will tell you precisely which file to download.
. If you’re unsure which variant you should download, see the custom installation instructions page. On that page, you can paste the output from a phpinfo() script, and it will tell you precisely which file to download.
![]() Download a prebuilt version of Xdebug that matches your Web server configuration.
Download a prebuilt version of Xdebug that matches your Web server configuration.
4. Move the downloaded file into a logical directory on your computer.
It’d make the most sense to place it in the same directory as your other PHP extensions.
5. Open your PHP configuration file in a text editor or IDE.
If you don’t know what your active PHP configuration file is, check the output from a phpinfo() script.
6. Enable the Xdebug extension by adding this line:
zend_extension = "C:\xampp\php\ext\php_xdebug.dll"
You should first search the file to see if Xdebug isn’t already referenced. For example, using XAMPP, that line already exists but is commented out (i.e., it’s prefaced by a semicolon). In that case, enabling the extension is just a matter of removing the semicolon.
If Xdebug is not referenced, you need to add that line.
In any case, make sure that the path to the DLL file is accurate for your system.
7. Save the PHP configuration file.
8. Restart your Web server.
9. Rerun a phpinfo() script to confirm that Xdebug is enabled ![]() .
.
![]() Xdebug is now enabled!
Xdebug is now enabled!
Tip
Xdebug will conflict with some other PHP extensions and can adversely affect performance of scripts and the Web server. For these reasons, I recommend that you not install Xdebug on a production server.
Tip
Although Xdebug is open source, and therefore free, “support agreements” are available. These are essentially donations to Derick Rethans for the work he has done creating and supporting Xdebug.
Using Xdebug
Once you’ve successfully installed Xdebug, you can start using it in your scripts. There’s really not much to that—Xdebug does all the heavy lifting for you. The following will explain how to use the new features Xdebug adds to your PHP installation.
To use Xdebug
• Use var_dump() to learn more about any particular variable ![]() .
.
![]() Xdebug makes the var_dump() output more information and easier to use.
Xdebug makes the var_dump() output more information and easier to use.
The first feature that Xdebug adds that you should take advantage of is a more useful and attractive var_dump() output:
# Iterator.php - Script 9.9
// other code
var_dump($hr);
Presumably, you’re already using var_dump() as a debugging tool, and now it’s just better.
• If you’re specifically interested in the values of any global variables, invoke the xdebug_dump_superglobals() function ![]() :
:
xdebug_dump_superglobals();
![]() A pretty display of the global variables and values received by a page.
A pretty display of the global variables and values received by a page.
• To adjust what specific global variables are shown, change how Xdebug runs:
ini_set('xdebug.dump.SERVER', '*');
ini_set('xdebug.dump.GET', 'something');
Xdebug can be configured in a couple of ways (see the sidebar), but using ini_set() within the script is simple and direct. The previous two lines of code say that you want to see all of the $_SERVER values but only $_GET['something'].
To be clear, those lines need to be added before the xdebug_dump_superglobals() function call.
• To show undefined values, too, add this code:
ini_set('xdebug.dump.undefined', 'on');
By default, the xdebug_dump_superglobals() function does not show undefined values. To change that behavior, turn that setting on.
• To see what else Xdebug does for you, manually create a (non-parse) error and rerun the script ![]() .
.
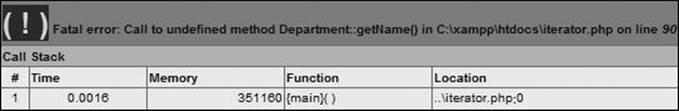
Another benefit of using Xdebug arises without adding any extra code to a script. When an error occurs, Xdebug will automatically output a very useful stack trace ![]() . This is equivalent to invoking debug_print_backtrace(), plus some HTML formatting.
. This is equivalent to invoking debug_print_backtrace(), plus some HTML formatting.
![]() Error messages are now displayed in a prettier, and slightly more informative, format.
Error messages are now displayed in a prettier, and slightly more informative, format.
There are a couple of caveats about this, however. Xdebug will not print stack traces if the following is true:
Customizing Xdebug
You can customize how Xdebug runs in one of two ways. The first is to use the ini_set() function. This function can be used to change many different PHP settings, including those in Xdebug. Alternatively, you can directly edit the PHP configuration file.
The arguments for doing the latter are first, that you only have to make changes once and they’ll apply to all scripts. Second, the changes will apply even if the script has a parse error. The negatives are that you have to have permission to edit the PHP configuration file—and be comfortable doing so, and that you have to restart the Web server with every change.
It’s easier to use ini_set(), but you have to add the necessary code to every file, or create an includable file that does the same. Invocations of ini_set() also have no effect if the PHP script has a parse error.
However you decide to customize Xdebug’s behavior, see the Xdebug documentation for all of the possible options.
• The display_errors setting is disabled (which should not be the case on a development server anyway).
• You’re using your own custom error handler.
• Exceptions are thrown.
The next two bullets explain how to circumvent these last two issues.
• To use Xdebug output in your own error handler, call
xdebug_get_function_stack();
This function returns the Xdebug output for you.
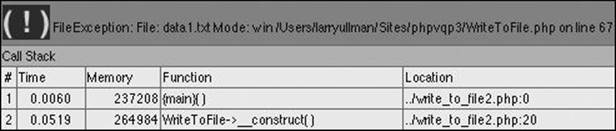
• To enable Xdebug handling of exceptions, use this ![]() :
:
![]() Xdebug’s stack trace for a thrown exception.
Xdebug’s stack trace for a thrown exception.
ini_set('xdebug.show_exception_trace', 'on');
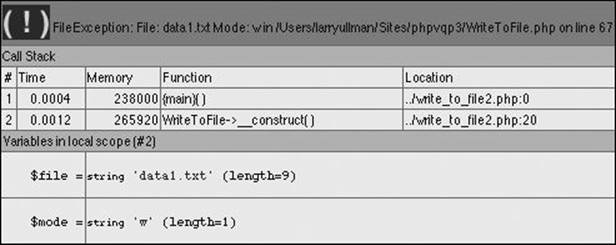
• To have Xdebug report on the values passed to functions, use this ![]() :
:
![]() Xdebug’s more detailed information about a specific function call
Xdebug’s more detailed information about a specific function call ![]() .
.
ini_set('xdebug.collect_params', '4');
There are other possible values, from the default of 0 (if you do not want to show those values) to 4, which shows the most amount of information.
• For even more information about function calls, have Xdebug show the value of local variables:
ini_set('xdebug.show_local_vars', 'on');
Tip
An alternative way to use Xdebug is to have it write all the data to a trace log. This is a separate file that you would then need to review.
Unit Testing
Unit testing is a relative newcomer to programming, but it is an approach that many developers have embraced. The premise of unit testing is that you define tests to confirm that particular bits of code work as needed.
Here are a few of the benefits of unit testing:
• Tests will minimize bugs (this is the most obvious benefit).
• Tests can help you improve your design.
• Tests can assist in creating documentation for your code.
• You are less likely to break code and introduce errors as you make changes down the line.
Learning how to implement unit testing involves syntax and theory. I’ll introduce both in this chapter.
As for unit testing theory, unit tests should
• Be easy to write, read, and execute.
• Be as atomic as possible (i.e., specific and small).
• Check that code works as intended.
• Not be used to validate user input.
• Not be used to handle problems that could possibly arise during the live execution of a site.
To put these ideas in context, remember that error and exception handling in your code should watch for bad things that could possibly happen. This might be poor user input or an inability to open a file. Unit testing, as a comparison, should test for what absolutely should happen and what absolutely shouldn’t. You’ll see specific examples shortly.
As the scope of the application increases, and as you add and modify the code, you continue to write tests for the new code, while still checking all of the original code against the existing tests, too. By doing this, you ensure that the introduction of new and modified code doesn’t break something that was previously working.
The best way to implement unit testing is to use one of the many libraries available for the purpose. The de facto standard is PHPUnit (www.phpunit.de). Over the next several pages, I’ll explain how to define tests and run your code against them.
Tip
A popular alternative to PHPUnit is Simpletest (www.simpletest.org).
Test-Driven Development
In this chapter, the focus is on writing unit tests to validate existing code. Another approach is called test-driven development (TDD). It takes the opposite stance: you define your tests and then write code that passes those tests.
Although this approach may be counterintuitive, there’s a lot to be said for it. Besides the unit-testing benefits already outlined, TDD also means:
• You won’t end up writing tests to match the code (which, therefore, defeats the purpose of testing).
• You have targets to shoot for, in terms of features needed and what isn’t required.
• You know when the code is done, because all the tests pass.
• You’re less likely to experience “coder’s block,” because you’ll have a running list of what to code next.
TDD is related to the concept of extreme programming, which, as you might imagine, is an entirely different way of creating software.
Installing PHPUnit
In order to use PHPUnit, you must first install it. It’s available through PEAR (http://pear.php.net). If you haven’t used PEAR before, check out the PEAR manual (or search the Web, or ask in my support forums) for more instructions.
To install PHPUnit
1. Access your computer via a command-line interface.
If you’re not accustomed to using the command line, these steps may be a bit advanced for you.
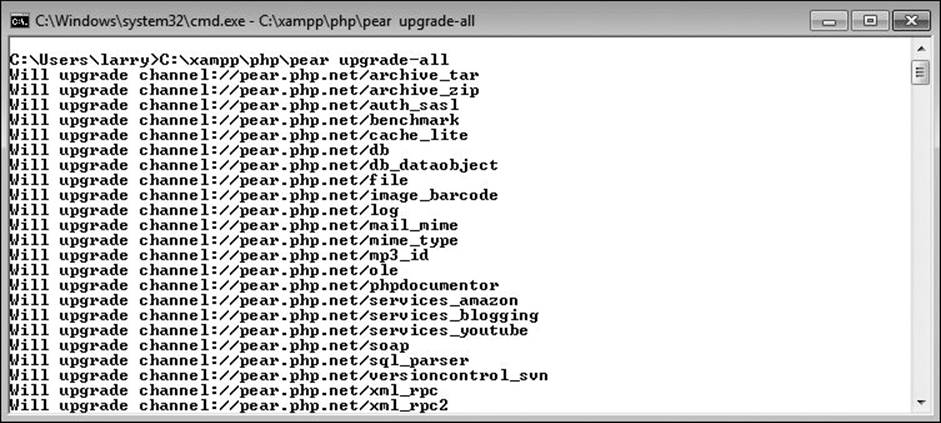
2. Upgrade PEAR ![]() :
:
pear upgrade-all
![]() Upgrading PEAR and all the other packages.
Upgrading PEAR and all the other packages.
PHPUnit recommends that you upgrade PEAR before installing PHPUnit. This command will upgrade all the PEAR packages (including PEAR itself).
Note that on non-Windows operating systems, you may need to preface this command with sudo:
sudo pear upgrade-all
You may also need to provide a full path to PEAR:
sudo /path/to/pear upgrade-all
Or (on Windows with XAMPP):
C:\xampp\php\pear upgrade-all
Again, search online or use the support forums if you have difficulty with this.
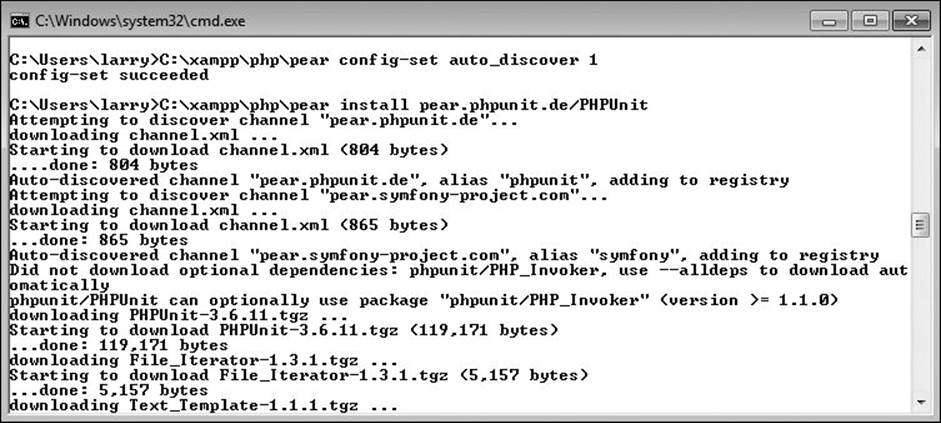
3. Install PHPUnit ![]() :
:
![]() PHPUnit has been successfully installed.
PHPUnit has been successfully installed.
pear config-set auto_discover 1
pear install pear.phpunit.de/PHPUnit
PHPUnit does not reside in the normal PEAR locations (aka, channels), so the first command is necessary in order to download PHPUnit from the PHPUnit.de Web site.
Again, you may need to preface these commands with sudo and/or the full path to PEAR.
You should see a message ![]() upon successful completion.
upon successful completion.
Defining tests
Unit tests are defined using assertions. An assertion is a programming concept that simply says: confirm that this is the case.
In theory, you could define your own assertion functions, but one of the benefits of a unit-testing framework such as PHPUnit is the number of assertion functions it defines for you:
• assertContains()
• assertCount()
• assertEquals()
• assertFalse()
• assertFileExists()
• assertGreaterThanOrEqual()
• assertNull()
• assertRegExp()
• assertSame()
• assertTrue()
That’s just a smattering of the assertion functions that exist. For a full listing, and to see how each is used, see the PHPUnit manual.
To create a unit test, you need to match an assertion function with the goal of the particular test. For example, the following code would assert that $needle is found in $haystack:
assertContains($needle, $haystack);
Because this is an assertion, this test would fail if the needle is not found within the haystack. This is functionally equivalent to
if (!in_array($needle, $haystack)) {
echo 'The test has failed!';
}
As another example, this code asserts that $var equals PHPUnit:
assertEquals('PHPUnit', $var);
Using code examples from this book, the check_urls.php file (Script 11.2) has a check_url() function that is supposed to return an array containing two elements. You can test for that:
$results = check_url($url);
assertCount(2, $results);
Or, as another example, the getName() method of the Employee class (used in various formats in various chapters) should return the given Employee object’s name. Here’s that test:
$e = new Employee('Chuck');
assertEquals('Chuck', $e->getName());
This may seem a bit silly and redundant, but that’s kind of the point: let’s confirm that the code does exactly—and only—what it’s supposed to do.
Assertions are at the heart of unit testing: what is it that must be the case. In theory, each test should assert one specific idea, although sometimes a test may assert a couple of very similar ideas.
Tip
PHPUnit is also capable of validating output (what would be printed) via PHP’s output buffering. See the PHPUnit manual for details.
Tip
Most PHP errors will also equate to a test failure in PHPUnit.
Creating test cases
Tests in PHPUnit get grouped together in a suite of test cases. Normally, one suite of test cases would be created for each class you’ve defined. Understand that unit testing is not specific to object-oriented programming but is more commonly used with OOP than with procedural programming, particularly when frameworks are involved.
With PHPUnit installed, you create a test suite by extending the PHPUnit_Framework_TestCase class:
class SomeClassTest extends PHPUnit_Framework_TestCase {
}
Conventionally, you’ll name the new class a combination of the name of the class being tested, followed by Test.
Within this class, create one new public method for each test. Each method’s name should start with test:
function testSomething() {
// Actual test.
}
There won’t be a one-to-one correlation between the number of test methods defined and the number of methods in the class being tested. This is because class methods may be complex and do multiple things, whereas unit tests are intended to be small and specific.
The last thing to know before getting into an example is that you must invoke all the assertion methods via $this:
function testSomething() {
$this->assertTrue($var);
}
Using the $this object is necessary because when PHPUnit goes to run the tests, it will create an object of the class type. Through that object, the tests will be run, and the assertion functions will be accessible via $this.
To demonstrate unit testing, let’s create some unit tests for the Rectangle class, first introduced in Chapter 4, “Basic Object-Oriented Programming.” In this next sequence of steps, you’ll create just a single test and then learn how to run that. Subsequently, you’ll create all the requisite tests.
To create a test case
1. Begin a new PHP script in your text editor or IDE, to be named RectangleTest.php (Script 14.1):
<?php # RectangleTest.php - Script 14.1
2. Include the Rectangle class:
require('Rectangle.php');
In order to actually test the class, this class will need to make objects of that class type. Therefore, this page must also include that class definition.
Script 14.1. This shell defines one unit test.
1 <?php # RectangleTest.php - Script 14.1
2 // This page defines the RectangleTest class.
3
4 // Need the Rectangle class in order to work:
5 require('Rectangle.php');
6
7 // Define the class:
8 class RectangleTest extends PHPUnit_Framework_TestCase {
9
10 // Test the getArea() method:
11 function testGetArea() {
12
13 // Need a Rectangle:
14 $r = new Rectangle(8,9);
15
16 // The assertion tests the math:
17 $this->assertEquals (72, $r->getArea());
18
19 } // End of testGetArea() method.
20
21 } // End of RectangleTest class.
3. Begin defining the test class:
class RectangleTest extends PHPUnit_Framework_TestCase {
This class inherits from the PHPUnit_Framework_TestCase class.
4. Start defining the getArea() test method:
function testGetArea() {
This test will verify that the Rectangle class’s getArea() method works as it should. Remember that all tests must begin with the word test.
5. Create a Rectangle object:
$r = new Rectangle(8,9);
The test needs this object in order to access the method being tested.
6. Define the assertion:
$this->assertEquals(72, $r->getArea());
The getArea() method of the Rectangle class should return the value of the rectangle’s height times its width. With dimensions of 8 and 9, that value should be 72. This assertion says that it’s expected that 72 is the result of the getArea() call.
7. Complete the method and the class:
} // End of testGetArea() method.
} // End of RectangleTest class.
8. Save the file as RectangleTest.php.
As you’re about to see, the tests themselves will be run from the command line, so the file does not need to be saved to your Web directory.
9. Save a copy of Rectangle.php in the same directory as RectangleTest.php.
Tip
Xdebug supports the ability to check the amount of code coverage: how much of the written code is covered by unit testing. See the Xdebug manual for details.
Running tests
Once you’ve created a suite of tests, they can be run. This is normally done through the command line by executing the phpunit command:
phpunit SomeTest
This code will run the tests defined in SimpleTest.php and output the results. That’s all there is to it! Note that you don’t have to include the .php extension, as long as the test name is the same as the file it’s in.
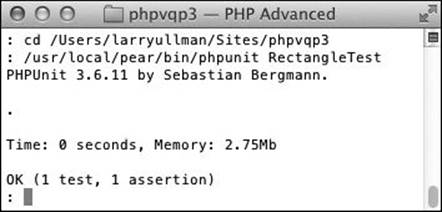
To run your tests
1. Access your computer via a command-line interface.
2. Move to the directory where you stored RectangleTest.php:
cd /path/to/dir
Obviously, you’ll need to change this to be correct for your system.
3. Run the tests ![]() :
:
phpunit RectangleTest
![]() The one test successfully passed!
The one test successfully passed!
Again, depending on your computer, you may need to provide a full path to the PHPUnit utility.
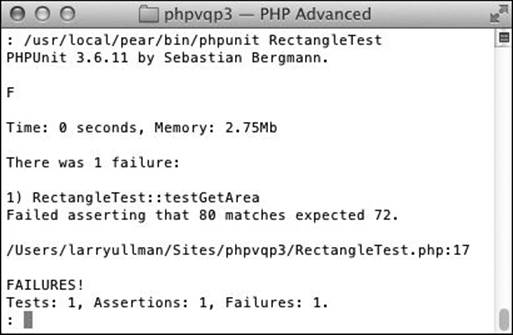
4. Fix your code until it passes every test.
In the output, a period indicates success and an F indicates failure ![]() . E means error and I means incomplete, or not yet implemented.
. E means error and I means incomplete, or not yet implemented.
![]() If there was a bug in the code, the test would have failed.
If there was a bug in the code, the test would have failed.
5. Celebrate!
Tip
There are ways to run PHPUnit tests using code in your Web browser. Search online for examples.
Tip
Although it may seem like a pain to run tests through the command line (as opposed to the Web browser), you can easily automate the process. When you have a lot of tests to run for a lot of classes, this is a much easier option.
Tip
Depending on the operating system and the PHPUnit configuration, you may or may not need to include the class definition of the class being tested.
Script 14.2. How you might use a setUp() method to help test the WriteToFile class from Chapter 8.
1 <?php # WriteToFileTest.php - Script 14.2
2 // This page defines the WriteToFileTest class.
3
4 // Need the WriteToFile class in order to work:
5 require('WriteToFile.php');
6
7 // Define the class:
8 class WriteToFileTest extends PHPUnit_Framework_TestCase {
9
10 // Need this information:
11 private $_fp = NULL;
12 private $_file = 'somefile.txt';
13 private $_data = 'test data';
14
15 // Open the file for writing:
16 function setUp() {
17 $this->_fp = fopen($this->_file, 'w');
18 }
19
20 // Write and test:
21 function testWrite() {
22 fwrite($this->_fp, $this->_data);
23 $this->assertEquals($this->_data, file_get_contents($this->_file));
24 }
25
26 // Close the file:
27 function tearDown() {
28 fclose($this->_fp);
29 }
30
31 } // End of class.
Setting up tests
One of the hardest aspects of unit testing is accurately replicating how the code will be used in the real world. For example, almost always, something will have to happen before an assertion can be made, even something as simple as the creation of an object in order to test its methods. You can see an example of this in the RectangleTest suite. Those things you need in order to perform a test are called “fixtures” in unit-testing parlance.
In theory, you could create your fixtures in the testing method, as in the testGetArea() example. But if multiple tests all require the same fixture, there’s a better alternative: define a setUp() method:
function setUp() {
// Create object or whatever.
}
The setUp() method will automatically be called before each test is run. There is a corresponding tearDown() method that will be called after each test is run. For example, the setUp() method might open a file for writing, the test will confirm that the file can be written to successfully, andtearDown() would close the file (Script 14.2).
Note that you won’t need tearDown() methods as often as you will setUp(). Also, each of these methods will be called before and after each individual test, not at the beginning and end of the entire test suite.
Let’s complete the Rectangle class suite by adding a setUp() method and more tests.
To use a setUp() method
1. Open RectangleTest.php (Script 14.1) in your text editor or IDE, if it is not already.
2. Add an attribute that will store a Rectangle object (Script 14.3):
protected $r;
This variable will be instantiated in the setUp() method.
3. Define the setUp() method:
function setUp() {
$this->r = new Rectangle(8,9);
}
This method creates a new object and assigns it to the attribute. To make this class even easier to read and use, you could place the width and height dimensions in class attributes, too.
4. Change the testGetArea() method so that it uses the attribute:
function testGetArea() {
$this->assertEquals(72, $this->r->getArea());
}
Now this method can refer to the class attribute, instead of creating its own object.
5. Define the getPerimeter() test:
function testGetPerimeter() {
$this->assertEquals(34, $this->r->getPerimeter());
}
This is similar to the getArea() test, but the math is different.
6. Define the isSquare() test:
function testIsSquare() {
$this->assertFalse($this->r->isSquare());
$this->r->setSize(5,5);
$this->assertTrue($this->r->isSquare());
}
The original rectangle object will not be a square, and the first assertion confirms that. To test that the method works properly when it should be a square, the rectangle is first resized.
Script 14.3. The complete suite of tests for the Rectangle class.
1 <?php # RectangleTest.php - Script 14.3 #2
2 // This page defines the RectangleTest class.
3
4 // Need the Rectangle class in order to work:
5 require('Rectangle.php');
6
7 // Define the class:
8 class RectangleTest extends PHPUnit_Framework_TestCase {
9
10 // For storing the Rectangle object:
11 protected $r;
12
13 // Create an object to use:
14 function setUp() {
15 $this->r = new Rectangle(8,9);
16 }
17
18 // Test the getArea() method:
19 function testGetArea() {
20 $this->assertEquals(72, $this->r->getArea());
21 }
22
23 // Test the getPerimeter() method:
24 function testGetPerimeter() {
25 $this->assertEquals(34, $this->r->getPerimeter());
26 }
27
28 // Test the isSquare() method:
29 function testIsSquare() {
30
31 // Should not be a square in this case!
32 $this->assertFalse($this->r->isSquare());
33
34 // Make it a square and test again:
35 $this->r->setSize(5,5);
36 $this->assertTrue($this->r->isSquare());
37
38 }
39
40 // Test the setSize() method:
41 function testSetSize() {
42 $w = 5;
43 $h = 8;
44 $this->r->setSize($w, $h);
45 $this->assertEquals($w, $this->r->width);
46 $this->assertEquals($h, $this->r->height);
47 }
48
49 } // End of RectangleTest class.
7. Define the setSize() test:
function testSetSize() {
$w = 5;
$h = 8;
$this->r->setSize($w, $h);
$this->assertEquals($w, $this->r->width);
$this->assertEquals($h, $this->r->height);
}
You don’t want to just assume that any method, including something as simple as setSize(), works properly. So this test first changes the rectangle’s size and then confirms the results.
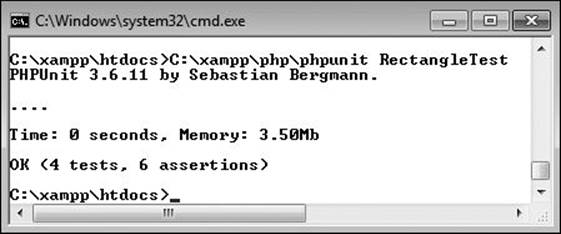
8. Save the file and run the tests ![]() .
.
![]() All of the new tests have been run and successfully passed.
All of the new tests have been run and successfully passed.
Tip
Unit testing involving databases requires a fair amount of extra knowledge. See the PHPUnit manual for specifics and examples.
Profiling Scripts
Moving on from debugging and testing, a more advanced skill to pick up is profiling your scripts. Profiling is the process of analyzing a script to see where there may be performance problems: slow bits of code and process bottlenecks. Once you’ve got a script completely working, profiling in order to make performance improvements is a prudent next step.
There are several profiling tools available for PHP, starting with the debugging utilities already mentioned: APD, DBG, and Xdebug. Since I’ve already explained how to install Xdebug, let’s use it.
However, profiling in Xdebug requires that you install another tool. Xdebug outputs its profiling data in a “cachegrind” format. Historically, this was readable by utilities such as KCacheGrind, originally written for Linux. While there are other utilities now available, it may be easiest to install webgrind (https://github.com/jokkedk/webgrind).
The next sequence will explain how to configure Xdebug to perform profiling, and how to install webgrind. In the following section of the chapter, you’ll learn what to do with the results.
To use Xdebug with webgrind
1. Download webgrind.
The webgrind package is hosted at Github. You can download it from there, using the URL already mentioned.
2. Unzip webgrind.
Webgrind comes as a zip file that must be expanded.
3. Move the resulting webgrind folder into your Web server directory.
Webgrind is written in PHP, which means it needs to be on a PHP-enabled server and accessed through a Web browser.
4. Open your php.ini file in a text editor or IDE.
The next step is to enable Xdebug in your PHP configuration file.
5. Add these lines of code ![]() :
:
xdebug.profiler_enable = 1
xdebug.profiler_output_name = cachegrind.out.%t.%p
![]() The relevant Xdebug configuration area of the php.ini file.
The relevant Xdebug configuration area of the php.ini file.
The first line turns the profiler on. The second line specifies the filename format for the profiling output. The filename will be cachegrind.out followed by a timestamp, followed by the process id.
You may also need to set the profiler_output_dir to a writable temporary directory ![]() .
.
6. Save the php.ini file.
7. Restart your Web server.
8. Run any PHP script to have Xdebug profile it.
Tip
There’s a strong argument for profiling your scripts as they run on the production server. But after doing so, be sure to disable Xdebug for better overall performance.
Tip
Profile data files can get quite large. You’ll want to watch the profiling output directory to clear those out once they’re no longer needed.
Tip
Xdebug can be configured to only profile a script if a certain value is passed in the URL or a cookie, which is a good idea.
Tip
You probably won’t need to configure how webgrind itself works, as it uses Xdebug’s configuration by default. But if you do, just open the webgrind config.php file.
Improving Performance
Once you’ve started profiling your Web applications and scripts, you’ll start to see how you can improve their performance. In looking at the profiling output, you can identify where the bottlenecks are. I’ll explain the simple steps for viewing the profiling output in a moment, but first I’ll explain what you should be watching for in the profiling results.
Start by looking at two possible indicators of inefficiency:
• Processes that take disproportionately more time than the others
• Processes that take disproportionately more time than they should
You should not focus on the specific amount of time different bits of code require to execute. Those times are unlikely to be that accurate. At the very least, the mere act of profiling a script is going to drag down its performance. Instead, look at the time a process takes relative to the whole script. There will be processes that you would expect to take a lot of time, but there will also be those that shouldn’t. Look at the first category in hopes of making significant gains; look at the second because something may be amiss.
Implementing Server Caches
A great, but more advanced, way to improve the performance of your script is to implement server-side caching. Just as browsers cache resources so they don’t have to be re-downloaded, you can have a server cache different Web components so that they don’t have to be re-executed.
There are several types of caches you can implement. To start, you can cache the output of a script, which is to say the generated HTML. Once cached, the server can provide the static HTML file upon request, rather than rerun the underlying PHP script.
Second, you can implement opcode caching. PHP is an interpreted language. This means that at runtime—when a user requests a page, the server must read the PHP code and compile it into another code format, which is then executed. Opcode caching stores a version of the compiled code in server memory. This stored version can then be executed upon subsequent requests, saving the time and processing required to perform the compilation.
Depending on your database application, you may have query caching, too. There are variations on this, starting with having the database store the results of a query so that the query does not need to be executed again. Similarly, many database applications can “remember” or internally optimize queries. In such cases, the queries will still need to be executed, but they can be executed more efficiently.
For many of these caches, good PEAR classes and PECL extensions are available, such as the Alternative PHP Cache (APC). You can also see the documentation for your database application and look online for other tutorials.
Over time, by profiling and tweaking your code, you’ll begin to pick up patterns. In particular, input/output operations will normally be the most expensive:
• Working with files
• Interacting with databases
• Networking (i.e., communicating with other servers)
• Interacting with the server (this includes working with files and databases, of course, as well as sending emails, calling other utilities, and so forth)
Your code is probably not unnecessarily doing any of these things, but they’re worth investigating to see if you can’t minimize or optimize those interactions.
You’ll also find that user-defined functions can have a significant performance impact. In the profiling data, take a look at the function call counts: how many times a function is called. Then look into optimizing those that are called most frequently.
Other bottlenecks will arise from loops and working with large sets of data, such as XML or a big array.
Most importantly, make sure you don’t introduce bugs as you make optimization tweaks. Of course, having unit testing in place will guard against doing so!
Just like you (hopefully) make fewer mistakes the longer you’ve been programming, in time you should be writing more efficient code after you’ve been profiling for a while.
To view the profile log in webgrind
1. Load webgrind in your browser.
This should be just a matter of going to http://<domain>/<webgrinddir>.
(The downloaded file from Github has a longer name, but I rename the directory webgrind.)
2. Use the form at the time of the page to select what profile you want to view ![]() .
.
![]() The webgrind interface for choosing a script profile data to view.
The webgrind interface for choosing a script profile data to view.
At first, you’ll probably want to view 100% of the profile data. Use the second select menu to choose the script being profiled. Then make sure you’re viewing information in percent, as already explained.
3. Use the columns at the top of the table to sort by different criteria ![]() .
.
![]() The profile data for the iterator.php script, run while using Xdebug.
The profile data for the iterator.php script, run while using Xdebug.
Start by looking at the total self cost. This is the time required to execute a given function, not counting any function calls that function may make. The total inclusive cost also reflects the time taken to execute functions that are called.
Next, look at the invocation count. A high invocation count with a low total self cost is good; the opposite may be a problem.
4. Click the arrow next to a function reference to see more information.
You’ll see that the format presents PHP’s own functions using the syntax php::function_name. Class methods are presented using ClassName->method Name. The code outside of any function or class is listed under {main}.
For a comparison of self cost vs. inclusive cost, you’ll see that {main} will have a total cost of nearly 100%, which makes sense, because {main} represents all of the code being executed. However, the self cost for {main} will be much lower, as the primary code invokes lots of other functions and methods.
5. Find a potential problem, attempt to optimize the code, and re-profile.
6. Repeat Step 5!
Tip
You can normally make the biggest performance difference by throwing money at the problem. This includes buying new hardware (e.g., multiple servers) or upgrading the hardware you have. That’s not always feasible, however.
Review and Pursue
If you have any problems with these sections, either in answering the questions or pursuing your own endeavors, turn to the book’s supporting forum (www.LarryUllman.com/forums/).
Review
• What is Xdebug? What useful features does it provide? (See pages 457 through 459.)
• What is unit testing? What are the benefits of unit testing? (See page 460.)
• What are some of the properties that unit tests should exhibit? (See page 460.)
• What is TDD? (See page 461.)
• What are assertions? How do you invoke the assertion methods within the test class? (See page 462.)
• How do you create a test case (a suite of tests) using PHPUnit? How do you create an individual test? (See pages 463–464.)
• What is profiling? What is webgrind? (See page 471.)
• What kinds of things should you be watching for in profile data? (See pages 473 and 474.)
Pursue
• If you’re not entirely satisfied or impressed with Xdebug, consider installing and trying an alternative debugging or profiling tool.
• Begin using Xdebug as you develop new projects.
• Do more research on unit testing.
• Do more research on PHPUnit.
• Apply unit testing to as many script examples as you want from this book, or to your own code.
• If you like the concept of unit testing, look into TDD.
• Profile some of your own scripts and see what improvements can be made.
• Look into server-side caching.
More Application Testing
There are many ways of testing a script or application’s performance, from benchmarking (simple timing of a script) to profiling to load testing. Load testing is where you emulate multiple concurrent users to see how the whole server responds.
Many utilities are available to help you perform load testing, including ab (ApacheBench), httperf, and siege. On the other side of the equation, I recommend using a utility such as YSlow! (this is a Firefox Web browser extension) to analyze the HTML and other resources the browser is required to download for your site. Many online sites can also run performance tests on a single page request and make decent recommendations on the results.