Introducing Microsoft SQL Server 2014: Technical Overview, 1st Edition (2014)
PART II. Business intelligence development
CHAPTER 6. Big data solutions
Big data, the term generally used to characterize very large sets of data, has seen increasing use the past few years. In this chapter, we review the various ways that big data is described and how Hadoop developed as a technology commonly used to process big data. In addition, we introduce Microsoft HDInsight, an implementation of Hadoop available as a Windows Azure service. Then we explore Microsoft PolyBase, an on-premises solution that integrates relational data stored in Microsoft SQL Server Parallel Data Warehouse (PDW) with nonrelational data stored in a Hadoop Distributed File System (HDFS).
Big data
For several decades, many organizations have been analyzing data generated by transactional systems. This data has usually been stored in relational database management systems. A common step in the development of a business-intelligence solution is weighing the cost of transforming, cleansing, and storing this data in preparation for analysis against the perceived value that insights derived from the analysis of the data could deliver. As a consequence, decisions are made about what data to keep and what data to ignore. Meanwhile, the data available for analysis continues to proliferate from a broad assortment of sources, such as server log files, social media, or instrument data from scientific research. At the same time, the cost to store high volumes of data on commodity hardware has been decreasing, and the processing power necessary for complex analysis of all this data has been increasing. This confluence of events has given rise to new technologies that support the management and analysis of big data.
Describing big data
The point at which data becomes big data is still the subject of much debate among data-management professionals. One approach to describing big data is known as the 3Vs: volume, velocity, and variety. This model, introduced by Gartner analyst Doug Laney in 2001, has been extended with a fourth V, variability. However, disagreement continues, with some people considering the fourth V to be veracity.
Although it seems reasonable to associate volume with big data, how is a large volume different from the very large databases (VLDBs) and extreme workloads that some industries routinely manage? Examples of data sources that fall into this category include airline reservation systems, point of sale terminals, financial trading, and cellular-phone networks. As machine-generated data outpaces human-generated data, the volume of data available for analysis is proliferating rapidly. Many techniques, as well as software and hardware solutions such as PDW, exist to address high volumes of data. Therefore, many people argue that some other characteristic must distinguish big data from other classes of data that are routinely managed.
Some people suggest that this additional characteristic is velocity or the speed at which the data is generated. As an example, consider the data generated by the Large Hadron Collider experiments, which is produced at a rate of 1 gigabyte (GB) per second. This data must be subsequently processed and filtered to provide 30 petabytes (PB) of data to physicists around the world. Most organizations are not generating data at this volume or pace, but data sources such as manufacturing sensors, scientific instruments, and web-application servers are nonetheless generating data so fast that complex event-processing applications are required to handle high-volume and high-speed throughputs. Microsoft StreamInsight is a platform that supports this type of data management and analysis.
Data does not necessarily require volume and velocity to be categorized as big. Instead, a high volume of data with a lot of variety can constitute big data. Variety refers to the different ways that data might be stored: structured, semistructured, or unstructured. On the one hand, data-warehousing techniques exist to integrate structured data (often in relational form) with semistructured data (such as XML documents). On the other hand, unstructured data is more challenging, if not impossible, to analyze by using traditional methods. This type of data includes documents in PDF or Word format, images, and audio or video files, to name a few examples. Not only is unstructured data problematic for analytical solutions, but it is also growing more quickly than file systems on a single server can usually accommodate.
Big data as a branch of data management is still difficult to define with precision, given that many competing views exist and that no clear standards or methodologies have been established. Data that looks big to one organization by any of the definitions we’ve described might look small to another organization that has evolved solutions for managing specific types of data. Perhaps the best definition of big data at present is also the most general. For the purposes of this chapter, we take the position that big data describes a class of data that requires a different architectural approach than the currently available relational database systems can effectively support, such as append-only workloads instead of updates.
Exploring the history of Hadoop
Any research into potential architectural solutions for managing big data inevitably leads to a mention of Hadoop, a technology whose first iteration, dubbed Nutch, was developed by Doug Cutting and Mike Cafarella in 2002 as a way to crawl and index webpages across the Internet. Nutch, however, had limited scalability and was prone to fail. After Google released the Google File System paper in 2003 and the MapReduce paper in 2004, Cutting and Cafarella were inspired to design a distributed file system and MapReduce processing framework that gave more scalability and reliability to Nutch.
When Cutting joined Yahoo in 2006, the storage and processing components of Nutch were separated and contributed to the Apache Software Foundation as an open-source software project named Hadoop (after a toy elephant belonging to Cutter’s son). Even then, the focus of Hadoop was to facilitate web searches, but its scalability and reliability remained limited. Ongoing investment by Yahoo increased scalability from dozens of nodes to thousands over a period of several years. Meanwhile, Yahoo began storing more and more data in Hadoop and allowed data scientists to research and analyze this data, which provided the feedback necessary to develop new applications and attain a greater level of maturity in the platform. Externally, the open-source status of Hadoop attracted attention from academics and investors as a general-purpose computing platform more than for its origins as a web search engine.
Hadoop is attractive for general use because of its scale-out architecture on commodity hardware and its support for parallel processing on a large scale. As an Apache open-source project, Hadoop is not a software application but rather a framework consisting of multiple modules:
![]() Hadoop Common package Java libraries and utilities necessary to run Hadoop modules, source code, and documentation.
Hadoop Common package Java libraries and utilities necessary to run Hadoop modules, source code, and documentation.
![]() Hadoop Distributed File System (HDFS) A distributed file system that replicates large files across multiple nodes in case of potential hardware failure. A file is split into blocks, and then each block is copied to multiple machines. A centralized metadata store called the name nodecontains the locations for each part of a file.
Hadoop Distributed File System (HDFS) A distributed file system that replicates large files across multiple nodes in case of potential hardware failure. A file is split into blocks, and then each block is copied to multiple machines. A centralized metadata store called the name nodecontains the locations for each part of a file.
![]() MapReduce engine A programming framework that supports distributed processing of jobs in parallel within a cluster of server nodes. A MapReduce program requires a Map() procedure to perform a specific task across multiple nodes, such as a word count, and a Reduce() procedure to consolidate the results from these nodes in summary form. The engine automatically manages distributed processing by partitioning the data to be processed, scheduling the job across nodes, assigning an alternate node if an assigned node fails, and then aggregating the results from each node into a single result.
MapReduce engine A programming framework that supports distributed processing of jobs in parallel within a cluster of server nodes. A MapReduce program requires a Map() procedure to perform a specific task across multiple nodes, such as a word count, and a Reduce() procedure to consolidate the results from these nodes in summary form. The engine automatically manages distributed processing by partitioning the data to be processed, scheduling the job across nodes, assigning an alternate node if an assigned node fails, and then aggregating the results from each node into a single result.
![]() Hadoop YARN A resource-management platform that controls resources and schedules user applications for Hadoop 2.0 distributions and higher.
Hadoop YARN A resource-management platform that controls resources and schedules user applications for Hadoop 2.0 distributions and higher.
From a data-management perspective, one of the distinguishing features of Hadoop as it relates to large data volumes is the movement of processing logic to the data, rather than moving the data to a location where it is processed. Consider a data-warehouse solution in which data is extracted from one or more sources and moved to a new location after transformations have been applied to cleanse and restructure the data. Moving 1 PB of data across a 1-GB network into a data warehouse takes time and consumes network bandwidth. In a Hadoop implementation, after data is added to HDFS, the data remains in place, the processing moves to the data, and only the results of the processing are sent back to the user.
Several Apache open-source projects related to Hadoop are useful for data warehousing and BI applications that rely on a Hadoop implementation:
![]() Pig An infrastructure that uses a scripting language called Pig Latin to generate MapReduce jobs that read data from HDFS, transform data (through filtering, grouping, merging, or splitting the data, for example), and output the results to the console or to HDFS. Learn more athttp://www.windowsazure.com/en-us/documentation/articles/hdinsight-use-pig.
Pig An infrastructure that uses a scripting language called Pig Latin to generate MapReduce jobs that read data from HDFS, transform data (through filtering, grouping, merging, or splitting the data, for example), and output the results to the console or to HDFS. Learn more athttp://www.windowsazure.com/en-us/documentation/articles/hdinsight-use-pig.
![]() Hive A data-warehouse solution made up of a metastore that facilitates access to data stored in HDFS through a scripting language called HiveQL. HiveQL is syntactically similar to SQL, with which database professionals are already familiar. Additional information is available athttp://www.windowsazure.com/en-us/documentation/articles/hdinsight-use-hive.
Hive A data-warehouse solution made up of a metastore that facilitates access to data stored in HDFS through a scripting language called HiveQL. HiveQL is syntactically similar to SQL, with which database professionals are already familiar. Additional information is available athttp://www.windowsazure.com/en-us/documentation/articles/hdinsight-use-hive.
![]() Sqoop A set of utilities that uses MapReduce and parallelized operations to move data in either direction between Hadoop and a relational database. Read details about Sqoop at http://www.windowsazure.com/en-us/documentation/articles/hdinsight-upload-data.
Sqoop A set of utilities that uses MapReduce and parallelized operations to move data in either direction between Hadoop and a relational database. Read details about Sqoop at http://www.windowsazure.com/en-us/documentation/articles/hdinsight-upload-data.
![]() Oozie A workflow manager that allows you to schedule MapReduce, Pig, Hive, and Sqoop jobs by using hPDL, an XML Process Definition Language used to define workflows. You can read about it at http://www.windowsazure.com/en-us/documentation/articles/hdinsight-use-oozie.
Oozie A workflow manager that allows you to schedule MapReduce, Pig, Hive, and Sqoop jobs by using hPDL, an XML Process Definition Language used to define workflows. You can read about it at http://www.windowsazure.com/en-us/documentation/articles/hdinsight-use-oozie.
HDInsight
HDInsight is a Hadoop-based platform that you can use to process data of all kinds in the cloud. In particular, HDInsight is useful for processing high volumes of structured and unstructured data, which traditional relational database systems typically cannot support for a variety of reasons. HDInsight allows you to quickly establish an infrastructure for big data analysis, whether you want to develop a proof of concept for a big data solution or support ongoing analytical requirements in a production environment. Furthermore, HDInsight integrates with Microsoft’s business-intelligence tools to enable users to enhance big data with additional sources and then explore and analyze the results to gain deeper insights.
One of the benefits of using a service such as HDInsight is the ability to leave your data at rest in the cloud by using Windows Azure Blob Storage. You can then provision an HDInsight cluster during the time required to process the data and delete the cluster when processing is complete. That way, you do not need to purchase hardware, acquire and install software, and maintain an infrastructure for proofs of concept or short-term projects. Furthermore, its presence in the cloud means that HDInsight can be kept up to date with a current version of Hadoop. On the other hand, frequently upgrading Hadoop in a large enterprise and maintaining components of the entire Hadoop stack can be challenging. As another consideration, if you need to repeatedly process data that is 1 PB or more in size, or if your company already has a large investment in Hadoop, an on-premises solution is typically more cost-effective. Last, if maximal performance is imperative, an on-premises solution is likely a better choice because HDInsight resides in a shared resource environment and therefore cannot deliver a consistent performance experience.
Most functionality within HDInsight and other Hadoop distributions is similar. Consequently, any current experience with Hadoop is largely transferable. Keep in mind that interaction with HDInsight requires you to use Windows Azure PowerShell commands, so a basic knowledge of PowerShell is required to work with the cluster.
Creating a storage account for HDInsight
You can incorporate big data analysis into your business-intelligence solutions by designing an analytical architecture that includes both your enterprise data warehouse (EDW) and HDInsight. HDInsight and related tools, such as Hive and Power BI, are useful for preliminary analysis to determine whether your data contains any valuable insights. If you discover data that is useful for answering questions on an ongoing basis, you can automate extractions from HDInsight to load data into your EDW.
Before you provision a new HDInsight cluster, you must create a Windows Azure Storage account in an active Windows Azure subscription. To do this, click New in the lower-left corner of the Windows Azure portal, click Data Services, click Storage, and then click Quick Create. Type a unique name for the URL of the storage account, select a location, and specify whether you want locally redundant or geo-redundant storage (that is, replicated to nodes in the same region or replicated additionally to a secondary region), as shown in Figure 6-1. Click Create Storage Account at the bottom of the page.

Note For a step-by-step tutorial that teaches you more about Windows Azure and HDInsight, refer to http://www.windowsazure.com/en-us/documentation/articles/hdinsight-get-started/.
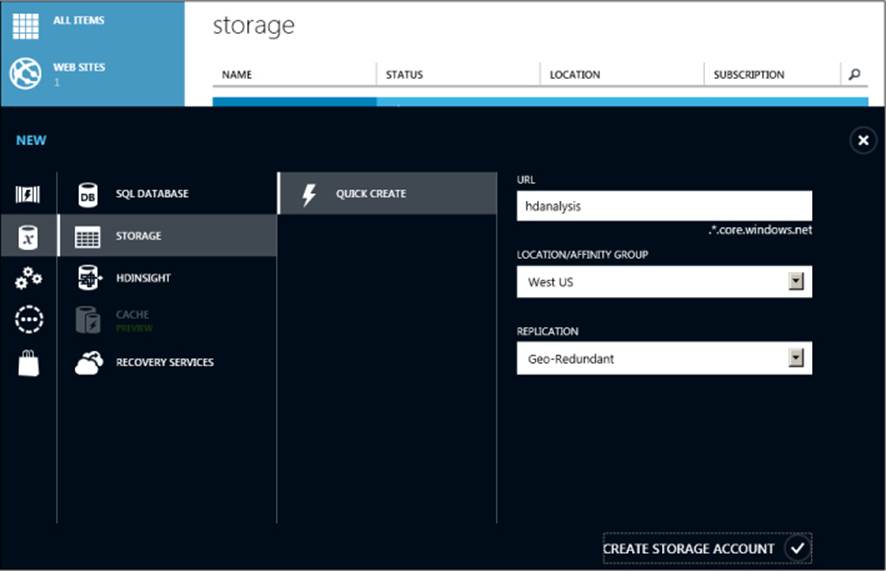
FIGURE 6-1 Creating a Windows Azure Storage account.
When the status of the new storage account changes to Online, click the account name in the list, and then click Manage Access Keys at the bottom of the page. Take note of the account name and primary access key for the storage account. This information is required when you provision your HDInsight cluster. Click the check mark at the bottom of the dialog box to close it.
Provisioning an HDInsight cluster
To provision a cluster by using the Windows Azure portal, click HDInsight at the left, and then click Create An HDInsight Cluster. Type a name for the cluster, select a cluster size, provide an administrator password, and specify the storage account to associate with the cluster, as shown inFigure 6-2. The cluster is created at the same location as the storage account. The status of the cluster changes to Running when it is ready to use.
Note If you want to specify a different number of nodes for cluster size than the list displays, or if you want to assign an administrator name other than “admin,” you can use the Custom Create option described at http://www.windowsazure.com/en-us/documentation/articles/hdinsight-provision-clusters/. If you later want to increase the number of nodes in your cluster, you can delete the cluster and create a larger one without losing data.

Important You cannot later change the assignment of the storage account to the cluster. If you delete the storage account, the cluster is no longer available.

FIGURE 6-2 Creating an HDInsight cluster.
Loading data into a storage account
To work with data in HDInsight, you must first load one or more files, known as blobs, into your storage account. More specifically, you load blobs into containers that you create within a storage account, as shown in Figure 6-3. Within a storage account, you can create as many containers as you need. Furthermore, there is no limit on the number of blobs that you can add to a container. The type of blob you add to a container determines how Windows Azure Storage manages both storage and operations. You can add the following blob types:
![]() Block blob This blob type is useful for most types of document, text, and image files; for streaming audio or video; and for HDInsight. The size of a single blob must be under 200 GB and cannot contain more than 50,000 blocks. Each block can store up to 4 MB of data. A client application manages the deconstruction of a blob into blocks and uploads the blocks in parallel for faster performance. The application also retries the operation for a single block if it fails to upload correctly.
Block blob This blob type is useful for most types of document, text, and image files; for streaming audio or video; and for HDInsight. The size of a single blob must be under 200 GB and cannot contain more than 50,000 blocks. Each block can store up to 4 MB of data. A client application manages the deconstruction of a blob into blocks and uploads the blocks in parallel for faster performance. The application also retries the operation for a single block if it fails to upload correctly.
![]() Page blob This blob type is optimal for random read-write operations. A page blob consists of 512-byte pages that cannot exceed 1 terabyte (TB). A client application writes one or more pages as a new blob or updates an existing blob by appending data to storage.
Page blob This blob type is optimal for random read-write operations. A page blob consists of 512-byte pages that cannot exceed 1 terabyte (TB). A client application writes one or more pages as a new blob or updates an existing blob by appending data to storage.
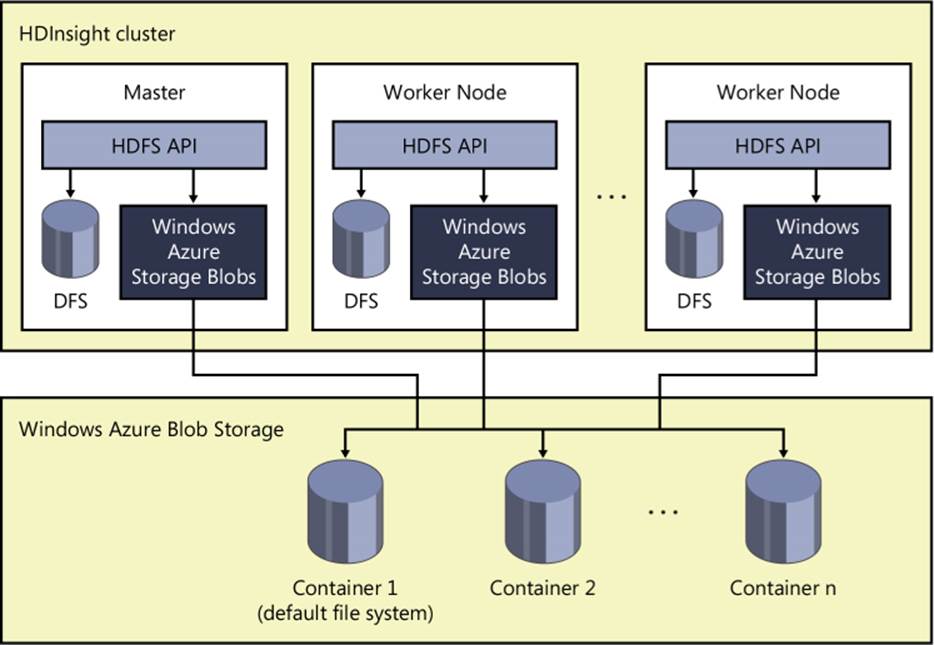
FIGURE 6-3 HDInsight storage architecture.
There are many ways to load data into storage. One way to work with your storage account is to download and install Azure Storage Explorer, available at http://azurestorageexplorer.codeplex.com. You must specify the storage account name and provide the storage account key to connect it to your Windows Azure Storage account. You can use Azure Storage Explorer to create a container for blobs, or you can use the Windows Azure management portal, although a default container exists when you initially provision the storage account for use as HDInsight’s default file system. Although Azure Storage Explorer provides a simple interface for uploading data, no comparable functionality is provided through the Windows Azure management portal.
Note Other options for loading data into HDInsight include AzCopy, Windows Azure PowerShell, Hadoop command line, and Sqoop. These are described at http://www.win-dowsazure.com/en-us/documentation/articles/hdinsight-upload-data/. For greater control over blob-storage management, you can develop a custom application by using one of many client libraries that wrap the REST interface for Windows Azure Blob Storage service. You can learn more about the REST API for blobs at http://msdn.microsoft.com/en-us/library/windowsazure/dd135733.aspx. If you have a lot of data to upload, you might find it more effective with respect to time and cost to send your data on an external hard drive to the data center. Details are available at http://www.windowsazure.com/en-us/manage/services/storage/import-export-service-for-blob-storage.
Working with Hive
Rather than write a MapReduce program to query and analyze data stored in HDInsight, you can use Hive. Hive is a data warehouse open-source project under the Apache Software Foundation that enables access to data stored in HDFS. This approach is popular among database professionals because it allows them to use HiveQL, a scripting language that is syntactically similar to the SQL queries with which they are already accustomed, and eliminates the need to learn how to write MapReduce programs in Java.
Note Before you can begin working with Hive, you must download and install Windows Azure PowerShell from http://www.windowsazure.com/en-us/documentation/articles/install-configure-powershell/. You can learn more about working with Hive and HDInsight athttp://www.windowsazure.com/en-us/documentation/articles/hdinsight-use-hive/.
In general, you use Hive to create a table, a step that does not physically move data into the table but rather imposes a schema on the data for read operations. That way you can continue to add more files to HDFS without the need to rebuild your table. To see how this works, let’s walk through an example in which 2008 tax data from the U.S. Internal Revenue Service (IRS) has been uploaded to blob storage as tax/data/2008-us-tax-data.csv. (You can download the file from http://www.irs.gov/pub/irs-soi/08zpall.csv.)
To run HiveQL queries, you must open a Windows Azure PowerShell console window. Then, connect to your Windows Azure subscription by running the following command and responding to the subsequent prompt with your login credentials:
Add-AzureAccount
Update the following PowerShell script with the subscription, storage account, container, and cluster names applicable to your HDInsight cluster, and then run the script:
$subscriptionName = “<mySubscription>“
$storageAccountName = “<myStorageAccount>”
$containerName = “<myContainer>”
$clusterName = “<myHDInsightCluster>”
Run the following script to connect to the correct subscription and cluster before issuing Hive queries:
Select-AzureSubscription $subscriptionName
Use-AzureHDInsightCluster $clusterName
To update the Hive metadata store with a schema describing the tax data, create and execute the following script:
Invoke-Hive -Query “CREATE EXTERNAL TABLE irs_tax_data (
state string,
zipcode string,
agi_class int,
n1 int,
mars2 int,
prep int,
n2 int,
numdep int,
a00100 int,
a00200 int,
a00300 int,
a00600 int,
a00900 int,
a23900 int,
a01400 int,
a01700 int,
a02300 int,
a02500 int,
a03300 int,
a04470 int,
a18425 int,
a18450 int,
a18500 int,
a18300 int,
a19300 int,
a19700 int,
a04800 int,
a07100 int,
af5695 int,
a07220 int,
a07180 int,
a59660 int,
a59720 int,
a09600 int,
a06500 int,
a10300 int,
a11900gt0 int,
a11900lt0 int)
ROW FORMAT DELIMITED
FIELDS TERMINATED BY ‘,’
LINES TERMINATED BY ‘\n’
STORED AS TEXTFILE;”
It is important to understand that the previous script did not move data into a table. Instead, it serves only as a description of the data that you place in an HDFS directory. You can then load one or more files into that directory and use Hive queries to retrieve data from those files as though they were a single table. To associate the HDFS directory with the external table schema in the default container and storage account, execute the following script:
Invoke-Hive -Query “LOAD DATA INPATH ‘wasb://$containerName@$storageAccountName.blob.core.
windows.net/tax/data’ INTO TABLE irs_tax_data;”
Working with CSV output
When you use Hive to output data to a CSV file, the first several rows in the file contain Hive status messages that cause errors when you attempt to import the data into Power Query. You can use the following script to remove these header rows:
#Prep File
$File = “c:\temp\irs_tax_data_summary.csv”
#Remove lines
$FileContent = gc $File
$FileContent = $FileContent[5..($FileContent.Count - 2)]
$FileContent | Out-File c:\temp\irs_tax_data_summary_final.csv
Analyzing data from Hive
Once data is accessible through Hive, you can work with the data in a number of ways for analytical purposes. For example, you can execute a PowerShell script that runs a Hive query to retrieve summarized results from a table. You can then store the results as a table by using Hive’s CREATE TABLE AS SELECT statement or output the results as a CSV file that you save to HDFS or to your local computer. You might save the results as a table when you want to share the results with other users and need to query and analyze the results repeatedly. When the result is relatively small and you are performing a onetime analysis, you might use the CSV file as a quick way to access the data. Yet another option is to use the Hive ODBC driver that you can download from http://www.microsoft.com/en-us/download/details.aspx?id=40886.
An example of working with the Hive ODBC driver is to set up a data source name (DSN) on your computer and then reference this DSN when you create a connection in Excel to query the Hive table. To set up the DSN, open Control Panel on your computer, open Administrative Tools, and then open the ODBC Data Source Administrator (using the 32-bit or 64-bit version, as applicable to your operating system). Click the Add button, select Microsoft Hive ODBC Driver in the list, and click Finish. In the Microsoft Hive ODBC Driver DSN Setup dialog box, type a name in the Data Source Name box. In the Host box, type the name of your HDInsight cluster and append .azurehdinsight.net, as shown in Figure 6-4. Next, type admin in the User Name box (unless you set up an alternative name for the administrator of your HDInsight cluster), and then enter the password that you created for this account. Click the Test button to ensure that you can connect successfully, and then click OK twice to close each dialog box.
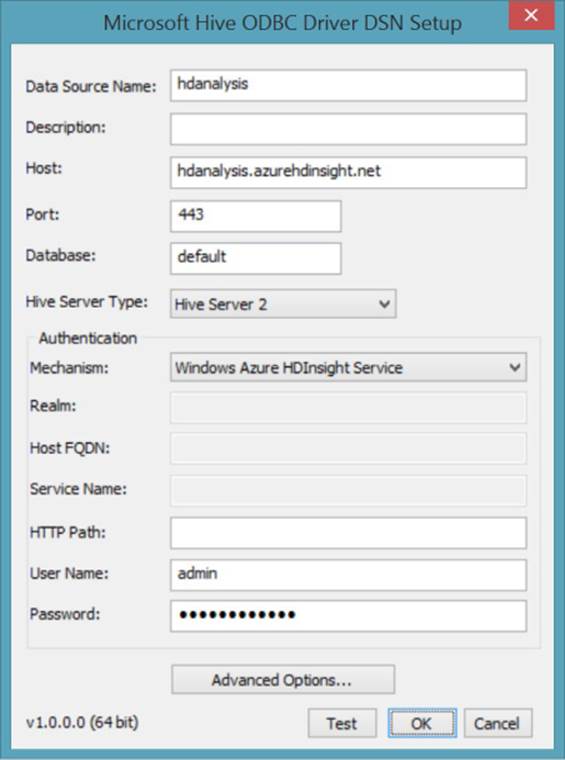
FIGURE 6-4 Configuring the Hive ODBC Driver DSN for HDInsight.
To continue the example with tax data stored in a Hive table, you can create a query to import all or part of the Hive table into Excel by using one of the following methods:
![]() Microsoft Query Wizard You can launch this wizard from the Data tab on the Excel ribbon by clicking From Other Sources and then clicking From Microsoft Query. Select the DSN you created for Hive, clear the Use The Query Wizard check box, and then click OK. You must provide the password for the admin user before you can create the query. Add the irs_tax_data table to the query, and then click the SQL button to define a query. Click OK to save the query, and then click OK to continue when a message is displayed indicating that the SQL query cannot be represented graphically. On the File menu, click Return Data To Microsoft Excel. In the Import Data dialog box, keep the default selection of Table, and then click OK. The wizard adds a table to the worksheet and loads it with data from your query. You are then free to use the data in Excel as you like, but if you later want to add the table to the Excel Data Model, you must manually remove the blank first row. You can then click Add To Data Model on the Power Pivot tab on the ribbon.
Microsoft Query Wizard You can launch this wizard from the Data tab on the Excel ribbon by clicking From Other Sources and then clicking From Microsoft Query. Select the DSN you created for Hive, clear the Use The Query Wizard check box, and then click OK. You must provide the password for the admin user before you can create the query. Add the irs_tax_data table to the query, and then click the SQL button to define a query. Click OK to save the query, and then click OK to continue when a message is displayed indicating that the SQL query cannot be represented graphically. On the File menu, click Return Data To Microsoft Excel. In the Import Data dialog box, keep the default selection of Table, and then click OK. The wizard adds a table to the worksheet and loads it with data from your query. You are then free to use the data in Excel as you like, but if you later want to add the table to the Excel Data Model, you must manually remove the blank first row. You can then click Add To Data Model on the Power Pivot tab on the ribbon.
![]() Power Pivot On the Power Pivot tab in Excel, click Manage, click From Other Sources, click Others (OLEDB/ODBC), and then click Next. Replace Custom with a friendly name, and then click Build. On the Provider page of the Data Link Properties dialog box, select Microsoft OLE DB Providers For ODBC Drivers, click Next, select Use Connection String, and then click Build. Select the Hive DSN on the Machine Data Source page, click OK, type the admin password for the cluster, click OK, select the Allow Saving Password check box, click OK, and then click Next. Click Next again, and then choose whether to select all data from a table or write a query. When you click Finish after selecting a table or entering a query, Power Pivot executes a query and returns results to the workbook’s data model.
Power Pivot On the Power Pivot tab in Excel, click Manage, click From Other Sources, click Others (OLEDB/ODBC), and then click Next. Replace Custom with a friendly name, and then click Build. On the Provider page of the Data Link Properties dialog box, select Microsoft OLE DB Providers For ODBC Drivers, click Next, select Use Connection String, and then click Build. Select the Hive DSN on the Machine Data Source page, click OK, type the admin password for the cluster, click OK, select the Allow Saving Password check box, click OK, and then click Next. Click Next again, and then choose whether to select all data from a table or write a query. When you click Finish after selecting a table or entering a query, Power Pivot executes a query and returns results to the workbook’s data model.
Note At the time of writing, Power Query does not include a connection for Hive. You can connect to HDInsight directly, but you can only view the set of files on HDFS. If you save multiple files to a common directory for which you create an external Hive table, you could use Power Query to merge these files, but you cannot retrieve them in a single step by querying the table, as you can with the Microsoft Query Wizard or Power Pivot.
As an example, you might want to summarize the tax data further before importing it into Excel. Whether you import the data using the Microsoft Query Wizard, Power Query, or Power Pivot, a query that retrieves the number of returns (in column n1) and average adjusted gross income (AGI) (in column a00100) by state and by zip code looks like this:
SELECT state, zipcode, SUM(n1), ROUND(AVG(a00100/n1),2)
FROM irs_tax_data
GROUP BY state, zipcode LIMIT 100000
Note To better understand the tax data example in this chapter, you can download a data dictionary for the tax data from http://www.irs.gov/file_source/pub/irs-soi/zipcode08flds.xls.
Note If you add aliases to the expressions in your query, the Hive ODBC driver does not return the alias names as column headers. Additionally, at the time of this writing, the query fails unless you include the LIMIT operator at the end of the SELECT statement.
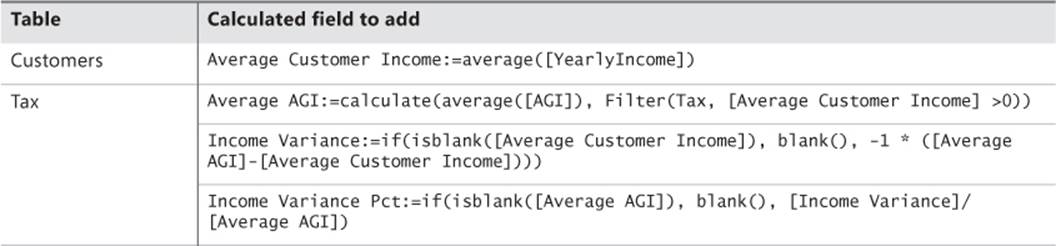
After you add data from a Hive table to a data model, you can use any of Excel’s analytical tools to explore the results. At a minimum, you can create a PivotTable or PivotChart. For more advanced analysis, you can add other data sources and DAX calculations to the data model. For example, let’s say that Adventure Works wants to compare the average income of its customers by state and zip code with the average income of taxpayers in the United States by state and zip code. To do this, you can import the DimCustomer table from AdventureWorksDW2012 (which you can download from the SQL Server 2012 DW link accessible at http://msftdbprodsamples.codeplex.com), rename it as Customers, change the data types to whole numbers for the returns and adjusted AGI columns, rename those columns by using a more user-friendly name, create a relationship between the tax data table (renamed as Tax) and the Customers table based on the zip code, and optionally add a hierarchy to each table to support navigation from state to zip code. To support comparisons of income levels, you can add DAX calculations to the data model (in the Calculation Area below a table in the Power Pivot window), as shown in Table 6-1.
TABLE 6-1 Sample DAX calculations.
With these calculations in place, you can visualize the data with charts and maps, as shown in Figure 6-5. In this example, three visualizations of the Income Variance Pct are displayed in a Power View report. The first visualization is a column chart sorting the values in ascending order. Adventure Works could use this visualization to identify the states where the average income of its customers is significantly lower than the average income reported on tax returns within a state. This disparity might indicate the existence of a large untapped market of potential customers with more disposable income available for buying Adventure Works products. When a hierarchy of states and zip codes exists, a user can double-click a column to view the zip codes associated with the selected state. In the map visualization, the size of each bubble indicates the relative difference between customer and general population income. As the difference increases, the size of the bubble becomes smaller. The visualization that looks like a table is actually a matrix for which the Show Levels option on the Power View Design tab is set to Rows—Enable Drill Down One Level At A Time to support a view of the data by state or by zip code within a selected state.
Power Map offers another way to view this type of data, as shown in Figure 6-6. In this visualization, the geographic data is in the state column in the Tax table and the chart type is set to Region. The legend shows that as the color used within a region becomes lighter, the value of Income Variance Pct is lower. No data exists for the states that have no color. The visualization is displayed as a flat map for easier viewing of the United States.
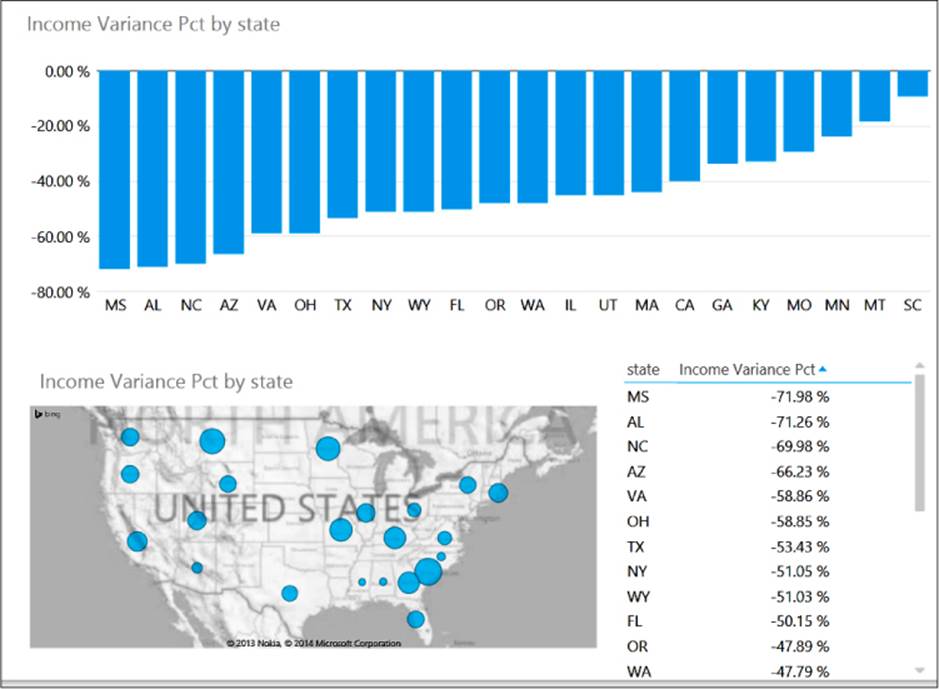
FIGURE 6-5 Power View visualizations of data combined from Hive and SQL Server tables.
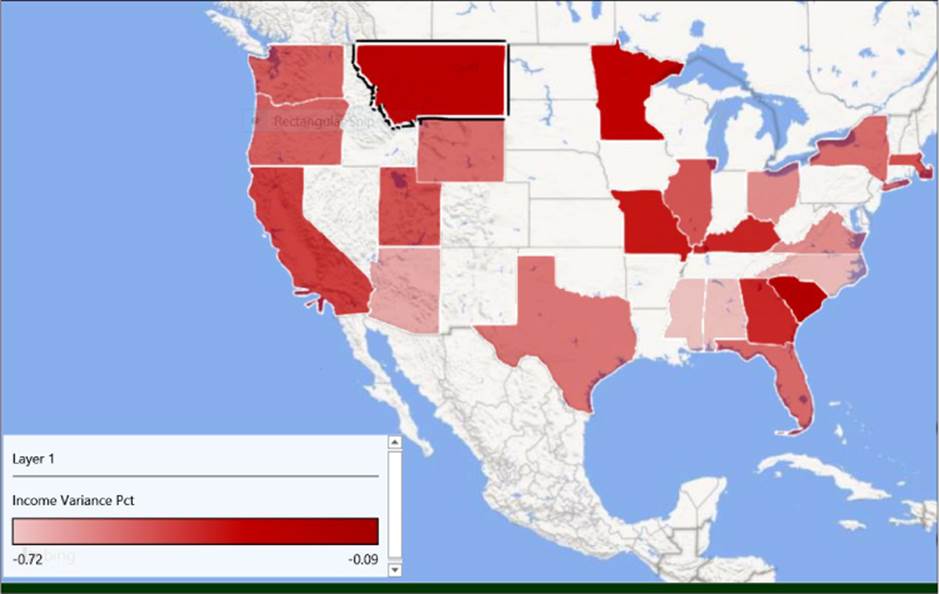
FIGURE 6-6 Power Map regional visualization of Income Variance Pct by state.
PolyBase
PolyBase was developed at the Microsoft Jim Gray Systems Lab at the University of Wisconsin-Madison under the direction of Dr. David DeWitt, a Microsoft Technical Fellow. It provides an interface that allows you to work with data stored in HDFS by using SQL syntax in PDW queries—in a manner similar to querying a linked server from SQL Server—rather than MapReduce jobs. You can even use PolyBase to join relational data in PDW with data in HDFS, as shown in Figure 6-7. In addition, you can use PolyBase to move data from PDW to HDFS or vice versa. Furthermore, you can use Power Query or Power Pivot to connect to PDW and use PolyBase to import data from HDFS into Excel.
Note To learn more about PolyBase, see “Split Query Processing in PolyBase,” at http://gsl.azurewebsites.net/Portals/0/Users/Projects/polybase/PolybaseSigmod2013.pdf.
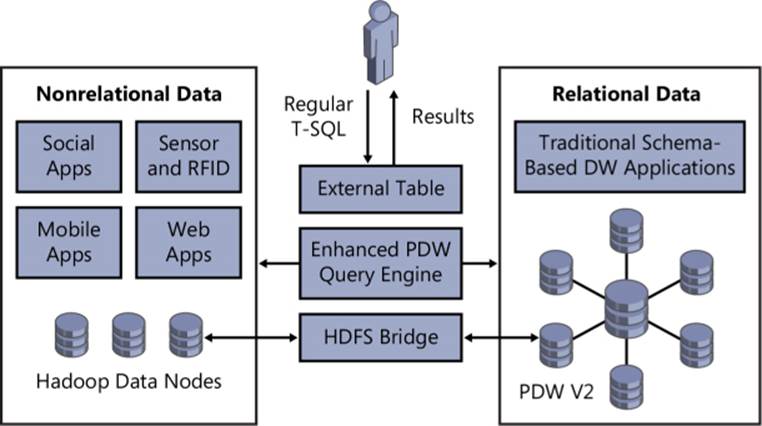
FIGURE 6-7 PolyBase as HDFS bridge between Hadoop and PDW.
Exploring the benefits of PolyBase
The most obvious benefit of the availability of PolyBase in PDW is the ability to combine both relational and nonrelational data into a single result set, but there are several others. In particular, database professionals already familiar with developing SQL queries to retrieve data from PDW for reporting and analytical applications have nothing new to learn when they need to query nonrelational data. There is no need to learn MapReduce, nor is there any need to learn how to use the other tools in the Hadoop ecosystem, such as HiveQL, Pig, or Sqoop. Existing SQL skills are sufficient.
Another benefit is faster results from queries to HDFS. PolyBase is able to perform read and write operations in parallel much faster by taking advantage of the massively parallel processing (MPP) of PDW. Whereas using Sqoop is effective for moving data into and out of a relational database, it processes data serially and interfaces with the PDW control node. By contrast, PolyBase not only parallelizes data transfers but also moves data directly from Hadoop data nodes to PDW compute nodes, as shown in Figure 6-8.
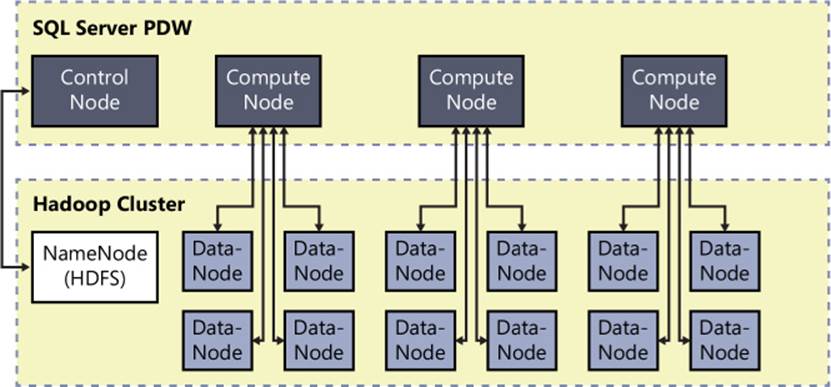
FIGURE 6-8 Parallel data transfer between PDW compute nodes and Hadoop data nodes.
Last, PolyBase is highly flexible. It is not limited to a single operating system or Hadoop distribution. In addition, any type of HDFS file format is supported. This means that you can use PolyBase to deliver data from all types of unstructured sources across the entire Microsoft BI stack. You can connect to PDW with ad hoc analysis tools like Excel and Power BI or distribute standard reports by using Reporting Services. You can even use data from PDW in Analysis Services multidimensional or tabular models to enrich it with business logic and other BI features.
Accessing HDFS data from PDW
The work that PolyBase performs to retrieve data from HDFS is transparent during queries. The only requirement is that you create an external table to define the schema that PDW can then query. You can then interact with data in HDFS files in multiple ways, either by moving data between systems or by querying both systems and joining the results.
Let’s say you want to export data from a PDW table called FactInventory and store the results in a text file on your on-premises Hadoop cluster. You use Create Table As Select syntax to create an external table and transfer data from PDW into a file in HDFS, like this:
CREATE EXTERNAL TABLE FactInventory_Export
WITH
(LOCATION = hdfs://10.10.10.100:8020/data/FactInventory_Export.txt,
FORMAT OPTIONS (FIELD_TERMINATOR = ‘|’)
AS SELECT * FROM FactInventory;
Another option is to create an external table that references data already stored in HDFS, as in this example:
CREATE EXTERNAL TABLE ServerLogs(
machineName varchar(50),
eventDate date,
event varchar(100)
)
WITH (
LOCATION = hdfs://10.10.10.100:8020/data/logs.txt’,
FORMAT_OPTIONS(
FIELD_TERMINATOR=’|’,
DATE_FORMAT = ‘MM/dd/yyyy’
)
)
You can then write queries that reference both PDW and external tables pointing to HDFS, as shown here:
SELECT sl.machineName, m.machineDescription, m.machineStartDate, sl.eventDate, sl.event
FROM ServerLogs sl
JOIN DimMachine m
ON sl.machineName = m.machineName