PHP Web Services (2013)
Chapter 9. Debugging Web Services
Anyone with extensive development experience has, by default, extensive debugging experience. Many of the skills learned as a PHP developer on more traditional web applications are very useful when working with APIs. Understanding how the pieces go together is probably the most important part of the puzzle. When you see a problem, you must answer several questions to determine the solution. Is that something that happened in the server? During transfer? Did the client not understand the response it received? And, if you have an application consuming an API, is it the application or the remote API with the problem? Narrowing down where exactly to look when things go wrong will save time and sanity.
Particularly with complex projects, it’s easy for the problem of “it’s not working” to be blamed on an API, especially if different teams take responsibility for different system components. In one such situation, the team providing the API created a requirement that all bug reports be provided with a replication case using only Curl. This caused grumbling from the developers of the consuming application, but at the end of the project, it emerged that half of the “bugs” in the API were in fact bugs in the consuming application code, and the developers had been able to track down and squash the bugs in their own system without interrupting the work of the API team. To this day I recommend Curl or other very simple replication cases, excluding as many other components as possible.
Whether Curl gives you a great example of how to replicate the bug or not, it is very useful. Re-running a request through Curl is very quick and very simple; most of the data to send can be stored in a file and shared between collaborators, giving everyone a very easy way to see the problem. Seeing the problem is half the challenge—actually fixing it is the other half.
If a team isn’t familiar with Curl, or would prefer to work with GUI tools, then the same principle applies, but do try to keep as many dependencies out of the equation as possible. A bug that is impossible to replicate (or that seems complicated from its description) probably won’t get fixed quickly. In some scenarios, Curl won’t do the job. For example, a system that uses OAuth1 would require much hashing of variables on the client side, which is very tricky to do with Curl, so in this case a different tool would be more appropriate.
Debug Output
Every PHP developer will have used print_r() or var_dump() at some point to return some additional information to the client during the course of the server processing a request. This technique is quick, easy, approachable, and can often be all that is needed to spot a typo or missing value.
When working with APIs, this can still sometimes be useful, but it does carry health warnings! If standard debug output is included with a response, and the client is expecting valid JSON, XML, or some other format, then your client will not be able to parse the response. For requests made from Curl, or in situations when the response is viewed as it is rather than parsed, the debug output technique is great. For other scenarios, other approaches may be a better fit.
Logging
When it is important to continue returning clean responses, more information can be acquired from an API, as it processes requests, by adding logging. This just means that, rather than sending debug information along with the output, it is sent somewhere else to be inspected (usually in a file on the server).
By default, PHP will write errors to the location specified in the configuration directive error_log in php.ini. If this is left empty, then PHP defaults to writing to Apache’s error log (or stderr, if you’re not using Apache). It is possible to write other information to this log, as well as the errors generated by PHP itself, using the error_log() function:
<?php
error_log("this is an error!");
Perhaps this looks like a rather oversimplified example, but at its most basic level this is all that is needed to add logging. When I look in the Apache error log on the server (the exact file location varies between platforms), I see this:
[Wed Dec 26 14:49:36 2012] [error] [client 127.0.0.1] this is an error!, referer: http://localhost/book/
[Wed Dec 26 14:49:36 2012] [error] [client 127.0.0.1] File does not exist: /var/www/favicon.ico
A couple of errors can be seen in the previous output. The first was sent by the code sample, which deliberately wrote a message to the error log, and the other is what happened when my browser requested a favicon, but none existed. Using this approach, error_log() calls can be added into a project to help debug a particular issue. The output from the error log can then be checked to discover the additional information needed, rather than sending the additional error information back to the client.
Logging is a powerful technique; there are many more tricks available to make it even more effective. Log messages can be directed to a specific file, for example, rather than to the generic error log. To do this, use the error_log() function but with some additional arguments. The first argument is the message, as before, the second argument is where to send the message (3 means “to a file;” for more detail see PHP’s error log documentation), and the final argument is the file name to use:
<?php
error_log("all gone wrong", 3, "log.txt");
The file should be writeable by the user that the web server represents, and then the error message will appear in the file (beware: it doesn’t add a new line after each message). Specifying a file means that all the debug information can be kept in one place and will be easy to follow. The file could be truncated between test runs to make it even clearer exactly what happened in any given scenario.
There are lots of excellent libraries around to make logging easier, and if you’re using a framework, it will probably offer some great logging functionality. There are some great features in dedicated logging tools or modules that will help keep track of what’s happening in your application without resorting to a var_dump() call in the middle of your JSON output:
Multiple storage options
Many logging libraries support more ways to store log entries than just email or files. Usually it’s possible to log into many different kinds of databases, various file formats, and other options. Depending on how you want to use the data, this can be very useful indeed.
Configurable logging levels
Logging libraries usually allow you to state the level of error that is being logged; this is comparable to the PHP approach of having ERROR, WARN, NOTICE, and so on. The application allows you to set what level of logging should be performed. This means you can change the logging levels on a lower-traffic test platform when you want to see more detail, or increase them temporarily to see more detail during a particular set of operations. As a result, the log files don’t become too huge when things are going well, but more detail can be obtained when required.
Sending error messages to email is very useful at times, particularly in situations when you want to immediately draw attention to the event. This might be because an event has occurred that must be reacted to urgently, such as a major and unusual failure case. Another very useful situation when you might want to have your code email some details to you is if a bug can’t be easily reproduced. Instead, set up your code to collect lots of information; should the bug manifest, then the application can let you know and send information alongside it. This gives more specific information about the problem than watching the general logs, and can be a great way to deal with elusive or edge-case bugs.
Debugging from Outside Your Application
Getting into your application to add debugging has all kinds of downsides. First, it requires that you have access to edit the code in both client and server, which often won’t be the case. Making changes to your application to add debug information can cause the bug to disappear (this is known as a “heisenbug”) or introduce other unintended effects.
A better alternative, particularly if you want to only observe the traffic arriving and leaving, is to use another application to inspect the traffic from outside the application. There are two tools in particular that can be used for this kind of approach: Wireshark and Charles. They offer fairly similar functionality in different ways, so the next sections cover them in turn.
Wireshark
Wireshark is a “network protocol analyzer.” In plain English, that means that it takes a copy of the traffic going over your network card, and presents it to you in a human-readable way. You don’t need to do any configuration of your application or network settings to use it; once it’s installed, it can just start showing us the traffic.
When you run Wireshark, you see a screen like the one in Figure 9-1.
The lefthand column lets you pick which network card you want to capture (this screenshot is from my Ubuntu laptop; you’ll see things a little differently on different operating systems). The “eth0” is your local wired network, “wlan0” is the wireless network, and “lo” is your local loopback. Look out for this if you’re making API calls to localhost as they use “lo” rather than whatever connection your machine uses to access the outside world. If you’re working with virtual machines, you will see more network connections here so you can pick the one for which you want to see the traffic.
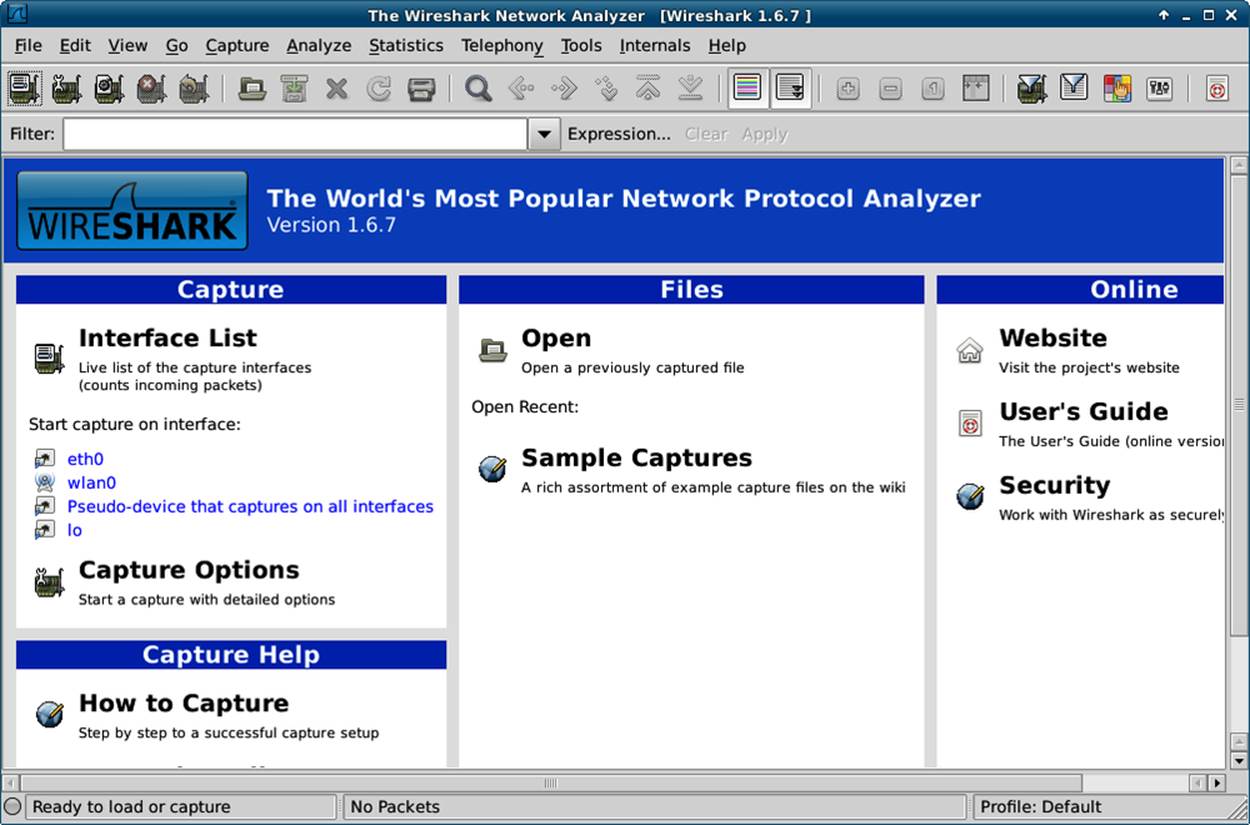
Figure 9-1. Initial screen when starting Wireshark
The other option you might want to use from this initial view is “open.” Wireshark runs on your desktop or laptop and captures the traffic going over a network card on your machine. However, what if it’s not your machine that you need the traffic from? It’s rare to have a server with a GUI that you could install Wireshark on, so instead a command-line program called tcpdump (Windows users have a port called WinDump) can be used. This program captures network traffic, and the resulting files can be downloaded and opened in Wireshark to be analyzed.
Whether the traffic is captured live or comes from a file captured elsewhere, what happens next is the same: we view the traffic and start to examine what is happening. When I start a capture on my machine, I see something like Figure 9-2.
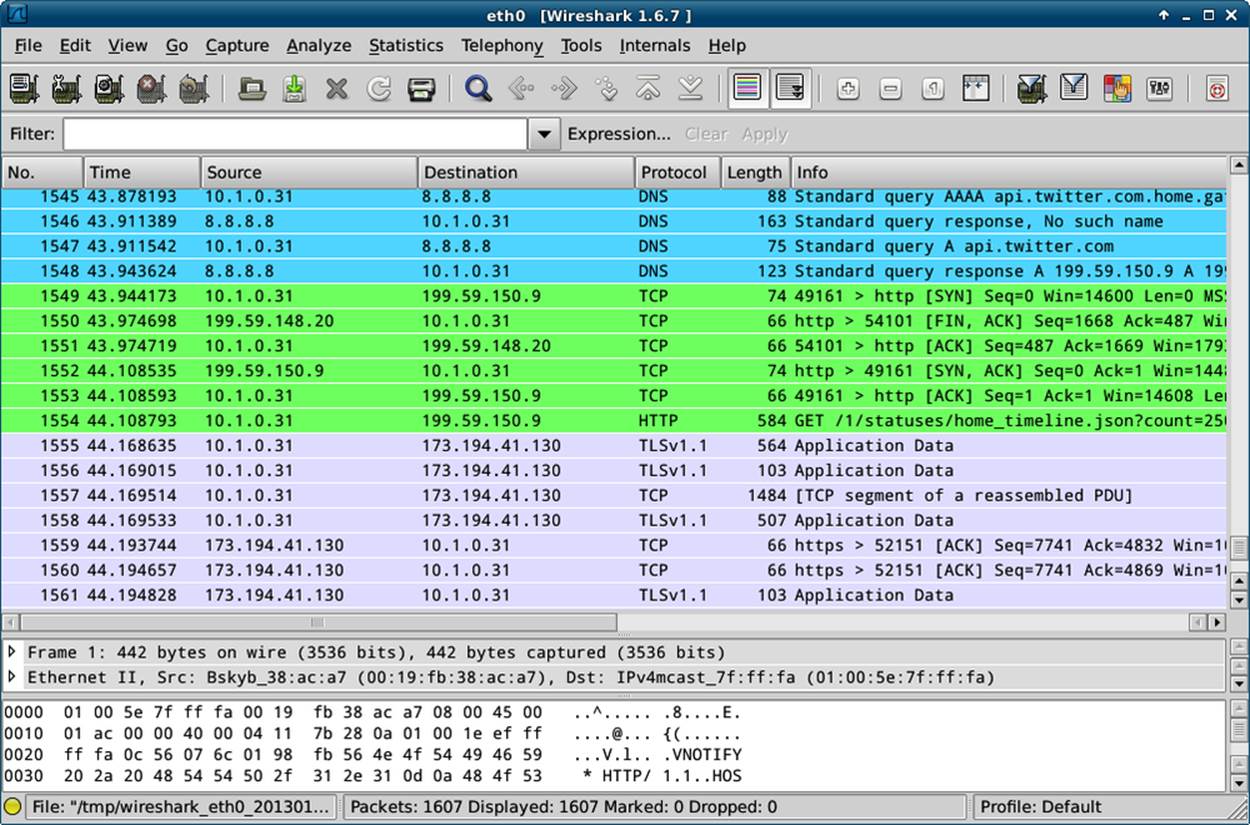
Figure 9-2. Wireshark showing all network card traffic
The first thing to do here is to restrict the amount of traffic being displayed to just the lines of interest by placing *http* in the filter field. Now a list of all the HTTP requests and responses that have been taking place are visible, making it possible to pick out the ones that are useful for solving a given problem.
Clicking on a request makes the detail pane open up, showing all the headers and the body of the request, or response, that was selected. This allows you to drill down and inspect all the various elements of both the body and the header of the HTTP traffic; when debugging, this is a very helpful technique for finding issues. Either nonsense is being sent by the client, or returned by the server, or (often) both.
To see the requests and responses linked together, right-click on either the request or the response and choose “follow TCP stream.” With this, you can clearly see the requests and responses side-by-side, with the request shown in red (trust me that this is the first four lines, if you’re seeing this in monochrome) and the response shown in blue in Figure 9-3.
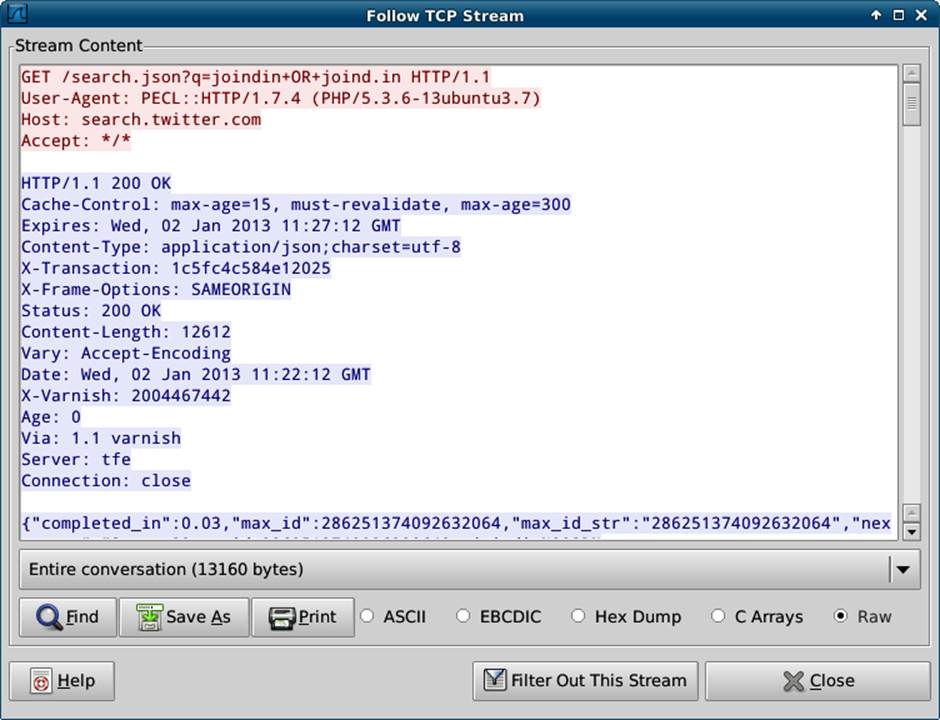
Figure 9-3. Wireshark showing a single TCP stream
The ability of Wireshark to quickly show what’s going on at HTTP level without modifying the application is a huge advantage. Often, it’s the first tool out of the box when something that “usually works” has suddenly stopped, and can show, for example, the text/html response, which is confusing the client that had been expecting JSON (a surprisingly frequent occurrence).
Charles Proxy
Charles is a paid-for product (a single license is $50 at the time of writing), but it’s one that is absolutely invaluable, especially when working with mobile devices or when more advanced features are needed. Charles logs a list of requests and allows you to inspect them, just like Wireshark, but it works in quite a different way, as it is a true proxy, and requests are passed through Charles rather than the network traffic being duplicated.
Getting set up with Charles is straightforward; it automatically installs and will prompt you to install a plug-in for Firefox to enable proxying through Charles by default. If you’re working with a web page making asynchronous requests, this is an excellent setup.
For those not using Firefox, you need to ask your application to proxy through Charles. Since it’s common to have proxies in place, particularly on corporate networks, this is fairly easy to do on most devices; there are advanced settings when creating a network connection that will allow you to do this. You will need to enter the IP address of your machine, and the port number (8888 by default, but you can change it in the proxy settings in Charles) into the proxy settings fields when creating and editing the network settings. When a new device starts proxying through your machine, you’ll get an alert from Charles that lets you allow or deny access.
Once everything is up and running, click on the “Sequence” tab and you’ll see a screen similar to Figure 9-4.
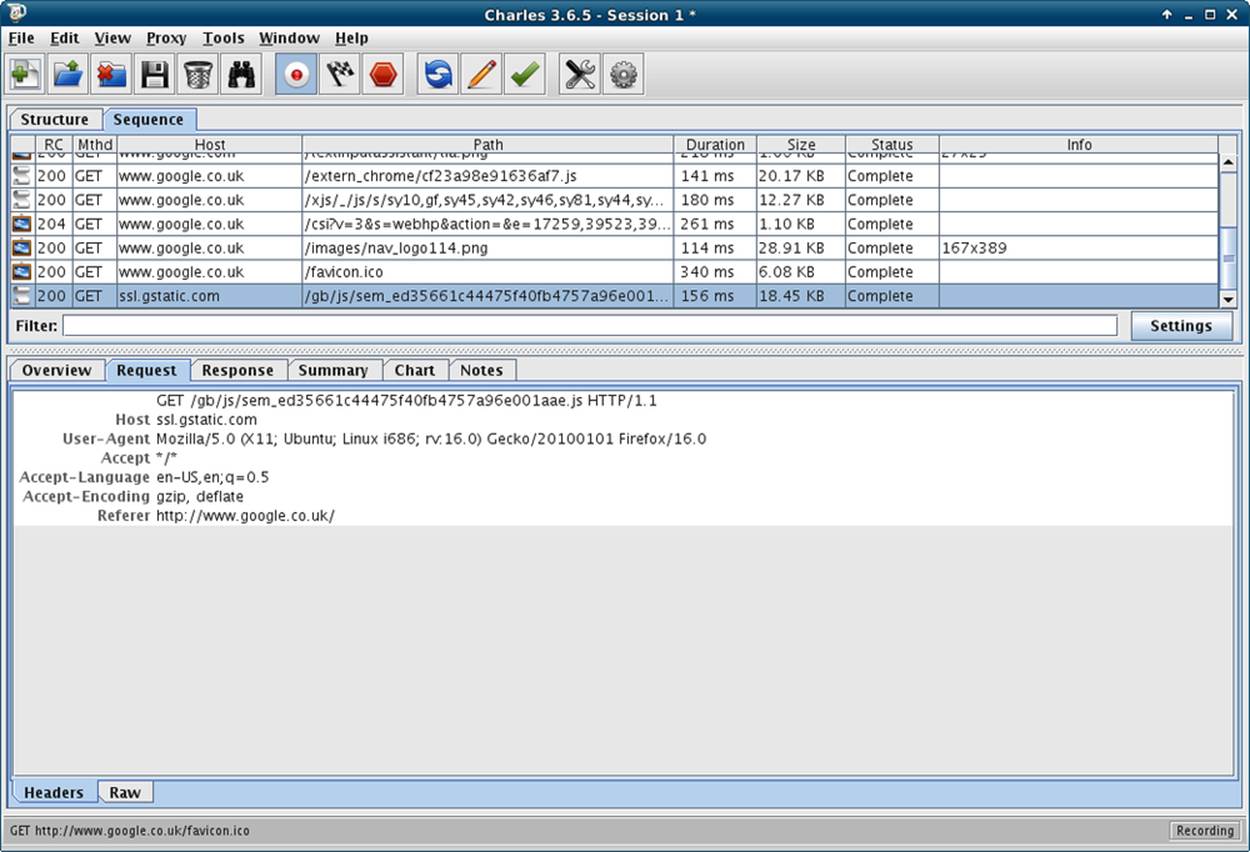
Figure 9-4. Charles showing some web requests in detail
The top part of the pane is a list of requests that came through the proxy (I just used Firefox to request http://google.co.uk as an example), and when you select one of these, the detail shows in the bottom pane. This area has tabs upon tabs, making all kinds of information available for inspection. There are the headers and body of the request and response, and if the response is valid JSON it will also decode it for you and show a nice representation.
If there’s a particular response that allows you to observe a bug, you might like to repeat it; Charles makes this much easier than having to click around the same loop again to replicate the bug. Simply locate the request you want in the top pane, and right-click on it to see “Repeat” in the context menu. This is really helpful for debugging, especially as you can export and import sessions from Charles, so you can pass this information around between team members.
Probably the nicest feature of Charles is its ability to show you SSL (Secure Socket Layer, or https) traffic without needing the private key from the server (which Wireshark requires). SSL is, by its very nature, not something than can be observed from the outside, so usually the result is something like the image in Figure 9-5. In simple terms, Charles creates its own certificates, and uses those to link with the browser. The “real” SSL certificate of the server is then used between Charles and the server. This setup is what is called “man-in-the-middle” and it’s a common attack, which is why we have Certificate Authorities that offer trusted SSL certificates.
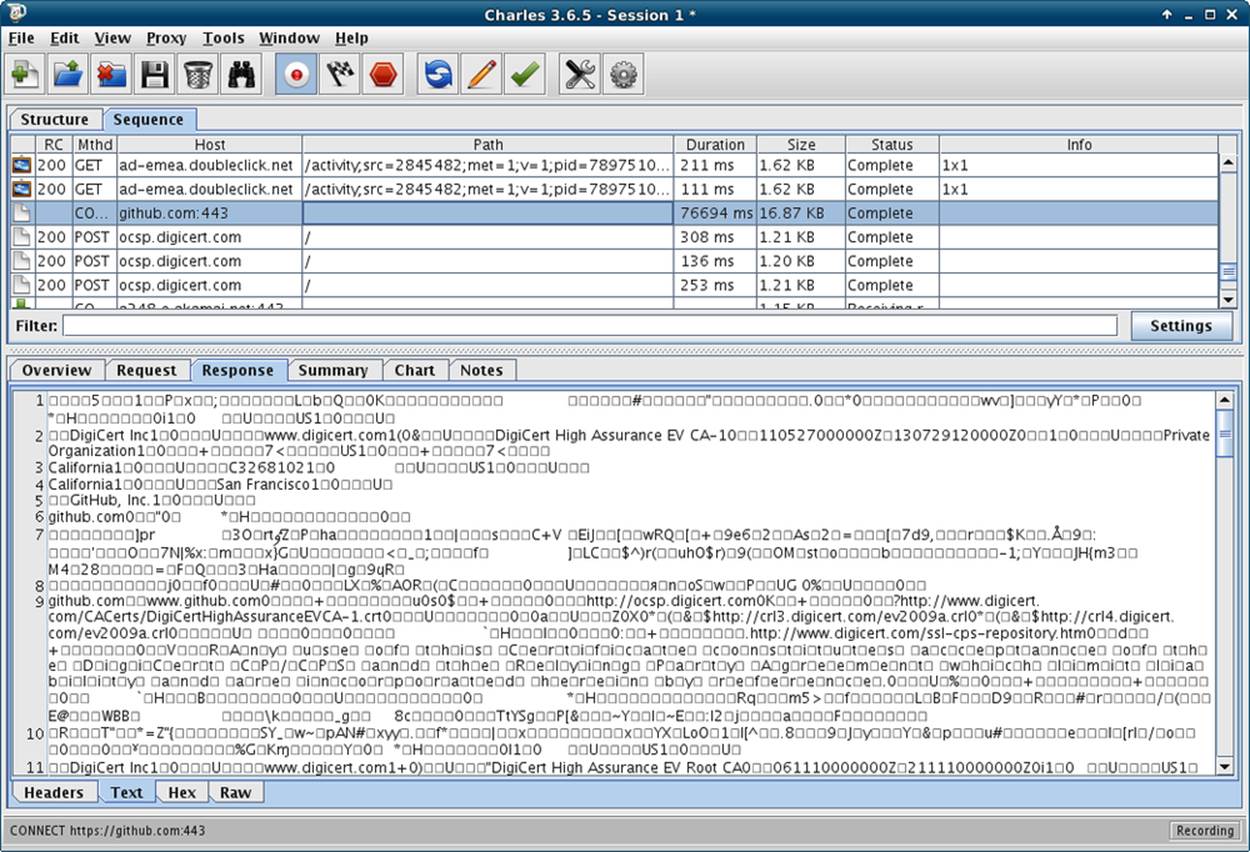
Figure 9-5. Charles showing https traffic without decrypting
You can enable SSL proxying on a per-site basis in Charles in the “SSL” tab of the proxy settings screen. When you try to access the SSL site now through Charles, you will see a warning that the SSL certificate is not trusted. Accept the warning and your application will operate as normal, with decoded content visible in Charles.
Two other features that are helpful with Charles are the ability to throttle traffic, and to rewrite any part of the request or the response as it comes through the proxy. Throttling traffic allows you to simulate a selection of real-world network speeds, including 3G for a mobile phone. This is a key part of the development process, especially if your application and server are on a fast corporate network; the real world can look quite different! I will never forget testing games on phones in an underground car park to find out what happened when there was no reception.
The rewriting feature is also extremely handy—it makes it possible to change headers or bodies of requests or responses, restrict them to specific sites, and use regexes (see Figure 9-6). This can be handy for all kinds of reasons: dealing with server names that are different in your testing environment, trying out a new remote service, or testing whether a change of headers fixes a particular problem.
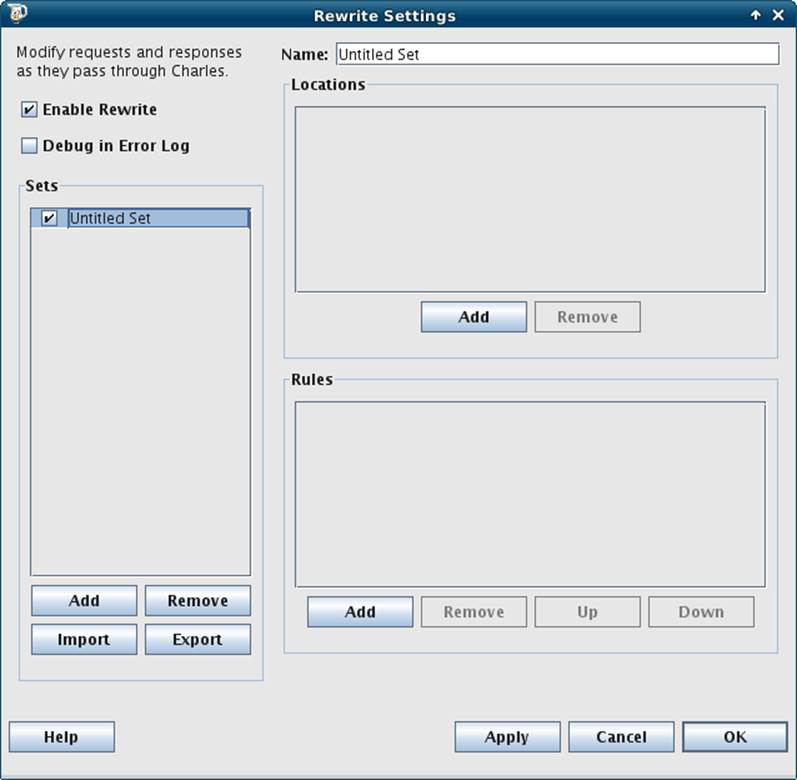
Figure 9-6. Charles allows rewriting of requests
Finding the Tool for the Job
Learning new tools costs time, even if the tools themselves don’t cost money, and it can be hard to invest that time when there is pressure to fix the bug, ship the product, or close the deal. Getting to know as many tools as you can, however, and being able to set them up quickly, means you’ll always be able to find the information you need. Think of it as an investment.
All materials on the site are licensed Creative Commons Attribution-Sharealike 3.0 Unported CC BY-SA 3.0 & GNU Free Documentation License (GFDL)
If you are the copyright holder of any material contained on our site and intend to remove it, please contact our site administrator for approval.
© 2016-2026 All site design rights belong to S.Y.A.