THE AGILE CULTURE: LEADING THROUGH TRUST AND OWNERSHIP (2014)
Chapter 7. Dealing Honestly with Ambiguity
The Big Ideas
![]() The worst time to make a commitment is when we know the least. We know the least at the beginning.
The worst time to make a commitment is when we know the least. We know the least at the beginning.
![]() We can iteratively accomplish two important tasks—proactively reduce risk and make meaningful commitments.
We can iteratively accomplish two important tasks—proactively reduce risk and make meaningful commitments.
![]() One of the best-proven ways to honestly deal with ambiguity is to use iterative methods.
One of the best-proven ways to honestly deal with ambiguity is to use iterative methods.
Easing the Need for Certainty
In Chapter 2, Trust and Ownership, we discussed the tension that exists between our desire for certainty and the fact that we live in an environment of increasing uncertainty. This tension exists, and it is highly unlikely that this tension will ever go away. As we hurtle toward an increasing pace of technology and rapid market change, uncertainty will increase, not shrink. At the same time, we continue to want to know what is going to happen so that we can plan and prepare for it.
Given this reality, what can we do? In this chapter, we present three tools you can use to partially satisfy the tension that comes from ambiguity.
Using Proactive Risk Management, we assess uncertainty as part of our risk analysis and make specific plans to decrease uncertainty. When risks, including uncertainty, are at a low enough level, we can make firm commitments. Until then, our commitments are as uncertain as the future.
We can make progress visible to improve access to status and information. It is easier to visually see progress, so display it this way and update it often.
Finally, using iterative methods is one of the best ways to deal with uncertainty, and so we give a short explanation of how and why to use such methods. This explanation is not comprehensive. There is much written about such methods and which ones to use and why. We hope to provide an overview of how such methods work because our book is filled with examples of how teams used iterative methods to achieve success.
Proactive Risk Management
In dealing honestly with ambiguity we need to recognize and deal with the pressure we and our teams are under to provide certainty. Proactive Risk Management is one tool that can satisfy the competing demands of certainty and ambiguity.
When is the absolutely, positively worst time to make a commitment? When we know the very least. So why do we keep doing it? Typically, we know the very least at the beginning of a project. Sure, we have done our planning and defined the contingencies, but at the beginning there is no way we can adequately anticipate the multiple uncertainties and complexities we will encounter. Yet this is when we make commitments for deliverables, costs, and timing. In other words, we set ourselves up to be wrong about deliverables, costs, and timing.
Some years ago, the National Aeronautic and Space Agency (NASA) conducted a comprehensive review of its ability to accurately predict the time, effort, and costs of its major software projects. NASA discovered that only 5 percent of the original project estimates came true. To think of this another way, if you make a commitment as to time, costs, resources, and scope, you will be wrong 95 percent of the time!
Why do we do this? There are at least two reasons. First, leaders seem to think if they have a date, they can control the outcomes. This, however, is delusional thinking, but they do it anyway. Second, the rest of our world wants to plan their lives around a date when we say we will be done. While our project might have dependencies to manage, the rest of the organization is dependent on us to meet our commitments. The pressure to make commitments when we know the least comes from many places. Sometimes we, as leaders, apply this pressure. Sometimes the pressure comes from above and we cascade this pressure to our teams. All of this combines to create the commitment tension. Even though the very worst time to make a commitment is at the beginning (when we know the least), the rest of the organization wants us to commit (and keep our commitment) as early as possible. Marketing needs to develop product launch plans. Customer support needs to train their personnel. Internal departments need to plan for financial close activities, training, and process ripple effects. Thus begins the tension-filled dance. Everyone else presses us to make a commitment while we hedge as much and as long as possible. And how do we respond to the pressure to commit? By adding buffers to project tasks. If we double the estimated time to deliver the project, will that give us enough headroom to meet our commitment? Or would it be better to triple our estimates? If triple is enough, would quadruple be optimal? If meeting our early commitment is paramount, we do what we can to set ourselves up for success—even if that requires us to do planning and estimating contortions, and frustrates the rest of the business.
What if there was a better way? Admittedly, this way only works in a culture that is willing to accept a bit of ambiguity. But if we are honest with ourselves, it is not as if our current, commit-when-we-know-the-least method is working all that well. So, why not try something that might work? Perhaps we can do without the following scenario.
The team was required to make a “go-live” commitment during the initial planning phase. This was the date we would, for sure, be ready to turn on the new system. But, there were two questions we could not answer during planning. The first was uncertainty about the market. The new product was new and different enough that history could not inform us as to which features would have the largest impact. The second was a potentially complex technology. This new product required the development of technology that was new to the engineering team. The team members felt they had a reasonably good idea about how to build this technology but could not, with confidence, make a solid commitment. But, with the rest of the organization so dependent on the result of this project, the team was compelled to name the date their project would end and the new product would be released.
The project leader hedged by tripling the estimated time to develop the new, potentially complex technology. She also hedged by pushing the tasks associated with market uncertainty to the marketing team. Would the marketing team be able to resolve the market uncertainty? It was hard toknow but at least it was no longer the project team’s problem. With this done, the team made a commitment—fourteen months from then, the product would be ready! The sales department pushed back. Sales was anticipating the new product to reach its fourth quarter sales goals. That would only happen if the team completed the project in eight months; fourteen months was six months too late. The chief financial officer then weighed in. If Sales did not deliver on its sales goals, the company would not deliver the expected revenue and earnings goals. No, the team had to deliver in eight months!
The project sponsor gathered the team together to review their estimates. The focus fell on the hedged estimate on the development of the new technology. Surely the team did not need all that time. There must be some way to reuse an existing technology or find an outside firm with more and experienced resources to develop the technology. The project manager committed to explore those options while agreeing to commit to a nine-month project. In exchange, Marketing committed to work closely with the team and provide answers to the questions about the priority of the functionality. With that, the project started.
The engineering team felt confident they could develop and deliver, on time, the new technology. But, months went by with little progress on the technology. During status reports, engineering reported that they were turning the corner and would still meet their commitments. Marketing had not yet been able to dedicate resources to the team but would as soon as it looked as if engineering had turned the corner. In spite of this, the team remained committed to their date. Somehow, someway it would all come together. The message to the rest of the organization was that everything was on track. At the beginning of month eight, two months from the delivery date, reality hit the team. Engineering had finally figured out how to develop the new technology but it would take about six months to complete their work. Now that engineering knew how to approach the new technology, Marketing was finally ready to do the market research required. This was great news but it came way too late for the company to have any hope of meeting the nine-month commitment.
The focus of the team shifted to damage control. Now that they knew what was required to deliver the product, the team replanned the project and decided they could, this time with real confidence, deliver the project in six months. The bad news was that the product and sales would be late. The good news was that the product was actually viable. The project manager reported the slip in the date to the project sponsor. He was devastated. The sponsor had been telling the rest of the organization that all was well. Now, eight months into a nine-month project, the reality was a six-month delay. As he reported the bad news to the organization, as you might expect, he blamed the project manager and the team. The company dropped a task force on the project—partly to accelerate the project but mostly to find someone to blame.
Let me ask again, in view of this are we willing to consider using a different approach?
If not, how about this example?
At the start of the project, there was a lot we did not know:
![]() Would the required resources would be available when we needed them? Without these resources we would have to utilize external staff. But would the external resources be qualified to do the work?
Would the required resources would be available when we needed them? Without these resources we would have to utilize external staff. But would the external resources be qualified to do the work?
![]() We were dependent on two projects that had to be done before we could complete our project. Would they both finish on time?
We were dependent on two projects that had to be done before we could complete our project. Would they both finish on time?
![]() Elements of our project depended on pending decisions about regulations. If those decisions were delayed, the project would be delayed. Depending on the decisions the regulators made, the project scope could change. When would the regulators issue their findings? What would their findings be? We had no idea.
Elements of our project depended on pending decisions about regulations. If those decisions were delayed, the project would be delayed. Depending on the decisions the regulators made, the project scope could change. When would the regulators issue their findings? What would their findings be? We had no idea.
In spite of a significant lack of knowledge, we had to make a commitment. We hedged as much as possible and padded our estimates as much as possible. We defined and documented a list of project caveats (“if—and we really mean if—the regulators delay their decision, our date will slip”).
But we still had to make a commitment. There were simply too many others depending on us and our work. So we held our noses and gave a date that was then inscribed in stone. We worked hard to complete the tasks on time and compensate for the unavailability of resources but there was nothing we could do about those regulators. We explored contingencies that assumed different versions of the regulations but there were too many permutations to pursue.
During status meetings and updates, we reminded anyone who would listen about our caveats but that did not absolve us from the commitment we made—a commitment we made when we knew the least (does this sound familiar?). As our due date loomed, we pressed the regulatory agency for any insight into the regulations but the regulatory board was torn as to direction. We were stumped and stalled, as was the project. The issue date for the regulations came and went and so did our project due date. Two months later, the agency issued a statement that they had decided to delay any decisions about the regulations—life would remain as it had been. With this unfinished decision finalized, we scrambled to finish the project. It was a great team that produced a great product but we were, at least temporarily, pariahs in the organization because we did not meet our commitment—a commitment we made when we knew the least. It was not our fault—but we had committed. What were we thinking?
Speaking for ourselves, we would rather try almost anything before we subject ourselves and our teams to the nearly always bad consequences of making a commitment when we know the least.
To only make commitments when we know enough and also to improve project performance, we developed a tool called Proactive Risk Management.
There are five steps in this approach:
1. Profile the risks to the project.
2. Quantify the risks to the project.
3. Define an acceptable level of risk before we commit to a date and deliverables.
4. Develop specific actions we will take to reduce the risks to the acceptable level.
5. Once we have reached the acceptable level of risk, make a commitment.
Let’s go through each one.
1. Profile the Risks to the Project
There are many risk profiling models. We prefer to use a model we learned from Kent McDonald and Todd Little. In this model, there are three types of risks and two sources of risk. The types of risks include the following:
![]() Delivery risks—the risks of being late, over budget, and not on target.
Delivery risks—the risks of being late, over budget, and not on target.
![]() Business case risks—the risks that the case for the project is wrong. We deliver the project on time, on budget, and on target but it is the wrong project.
Business case risks—the risks that the case for the project is wrong. We deliver the project on time, on budget, and on target but it is the wrong project.
![]() Collateral damage risks—the unanticipated, negative ripple effects of the project. Perhaps our product scavenges other products in an unanticipated way.
Collateral damage risks—the unanticipated, negative ripple effects of the project. Perhaps our product scavenges other products in an unanticipated way.
For each of these types of risks, there are two sources of risks—uncertainty and complexity.
Uncertainty risks include, but are not limited to
![]() Market uncertainty
Market uncertainty
![]() Technical uncertainty
Technical uncertainty
![]() Project duration
Project duration
![]() Resource availability
Resource availability
![]() Domain knowledge availability
Domain knowledge availability
![]() Dependencies
Dependencies
Complexity risks include, but are not limited to
![]() Technical complexity
Technical complexity
![]() Market segmentation and overlap
Market segmentation and overlap
![]() Dependencies (the more there are, the more complex the project, the higher the risks)
Dependencies (the more there are, the more complex the project, the higher the risks)
![]() Team location (the more widely dispersed—even across organizational boundaries—the members of the team, the higher the complexity)
Team location (the more widely dispersed—even across organizational boundaries—the members of the team, the higher the complexity)
![]() Knowledge gaps (filling those gaps increases complexity)
Knowledge gaps (filling those gaps increases complexity)
Let’s work through an example of profiling risks.
We needed to replace a fairly complex manual process with a new application. In the manual process, the sales team used a wide range of variables and intuition to match new customers to the appropriate salesperson. The members of the sales team were reasonable but adamant about building an application that exactly mimicked their complex manual process. In this case, our risk profile included a combination of delivery and business case risks. The sources of risk included
![]() Technical uncertainty. We were not sure how to develop technology to match human intuition and so creating such a technology included lots of uncertainty.
Technical uncertainty. We were not sure how to develop technology to match human intuition and so creating such a technology included lots of uncertainty.
![]() Process complexity. In the manual process, a group of six salespeople spent three days per month mapping clients to salespeople based on client profile information. The process went through multiple iterations as the group sorted through variables such as salesperson load, area of specialization, geography, and likability (whatever that means).
Process complexity. In the manual process, a group of six salespeople spent three days per month mapping clients to salespeople based on client profile information. The process went through multiple iterations as the group sorted through variables such as salesperson load, area of specialization, geography, and likability (whatever that means).
![]() Technical complexity. Even forgetting about the technology that supports intuition, the rules engine to support the combination of matching variables was very complex.
Technical complexity. Even forgetting about the technology that supports intuition, the rules engine to support the combination of matching variables was very complex.
![]() Uncertainty about process standardization. The sales team did not agree and could never agree on which of the variables should be the most important in matching a client to a salesperson.
Uncertainty about process standardization. The sales team did not agree and could never agree on which of the variables should be the most important in matching a client to a salesperson.
![]() Uncertainty about whether or not this project had any business value. It would have been good to free up six members of the sales team for three days a month but did that compensate for the level of effort—both in the initial development and then through future enhancements and maintenance?
Uncertainty about whether or not this project had any business value. It would have been good to free up six members of the sales team for three days a month but did that compensate for the level of effort—both in the initial development and then through future enhancements and maintenance?
2. Quantify the Risks to the Project
With the risks profiled, we then needed to assess them so that we could determine which risks would keep us from both making a commitment and delivering a successful result.
In general, we can “score” the risks as a combination of impact and probability. If a risk would be devastating but is highly unlikely, we might assess this risk as being medium. If a risk is highly likely but has a low impact it, too, might be a medium risk. If a risk is both unlikely and has low impact, let’s not worry about it. But if a risk has a high probability and a high impact, we want to focus on ways to reduce that risk.
Let’s return to the example we started before. Our risks included:
![]() Technical uncertainty
Technical uncertainty
![]() Process complexity
Process complexity
![]() Technical complexity
Technical complexity
![]() Lack of standardization
Lack of standardization
![]() Business value uncertainty
Business value uncertainty
Using a scale of 1 to 10, with 10 being high risk and 1 being low risk, we assessed these risks as shown in Table 7.1.
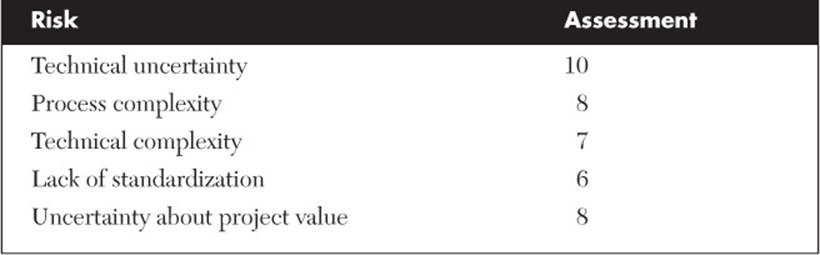
Table 7.1 Risk Assessment
One way to visualize this risk assessment is using spider or radar diagrams. Figure 7.1 is the identical assessment but in a visual form.
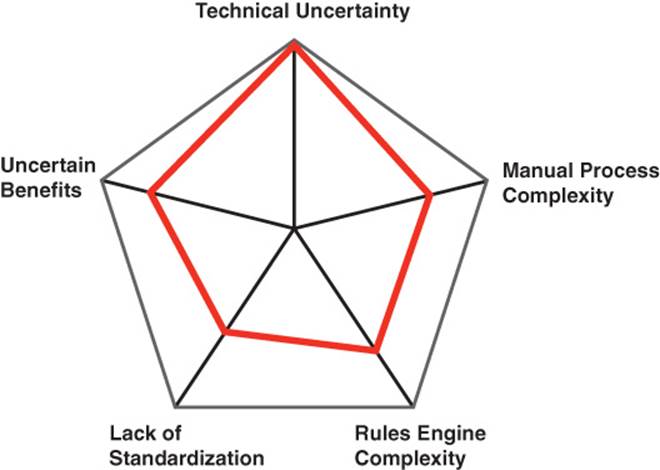
FIGURE 7.1 Risk profile radar diagram
This visualization helps us recognize where to focus our mitigation efforts. The biggest risk is in developing a technology to replicate the intuition of the sales team. Unless we can talk our sales team out of this idea or find a mind-reading technology, the project is at risk. We set ourselves up for failure if we make a commitment as to timeline or functionality before we reduce this risk.
Now that we have profiled and assessed our risks, we know where to focus our efforts to reduce risk. As we reduce risk, we improve our chances for making and keeping commitments.
3. Define an Acceptable Level of Risk before We Commit to a Date and Deliverables
As a team and with our stakeholders and customers, we define and agree to an acceptable level of risk for each risk. From the profile and assessment, we know which are the high-priority risks. In order for this to work, we must have some level of consensus on what is an acceptable risk level. If engineering is incredibly risk averse but sales is more risk tolerant, this mismatch will drive frustration within both groups. Engineering will bemoan the cowboy attitude of those guys in sales. After all, don’t they realize all of the bad things that can happen if things don’t quite work as advertised? Sales will complain that the engineering team is taking too long to do the simplest things. But if both agree as to the risk profile, risk assessment, and acceptable level of risk, the project has a chance of success.
Working together, we determine how low each risk must be before we consider making a commitment. In our example, the process played out like this:
![]() Technical uncertainty. Sales wanted us to do something to capture their intuition. We told them we had no idea how to do that and offered to dissect what they called intuition to see if there was some underlying rule set we could uncover. When a salesperson felt that one client was a better match for a specific salesperson, what were the reasons? From this, we did identify a couple of previously undefined rules. Some of the intuition was based on the experience of the salesperson. No one wanted to match an inexperienced salesperson to an account with a spotted history. Another rule involved educational background. Some clients wanted a salesperson with at least a bachelor’s degree. No one had ever formalized these rules but there they were. But even with these defined, there was still a need for a “gut feel” matching of salesperson to client. If technology could not support this, the risk would remain high. But could technology support most of the matching? Could we somehow use a set of known rules to propose a match that this group then used their intuition to confirm or change? If so, the risk level dropped dramatically. Would this combination of technology and manual review be acceptable? Would it handle enough of the matches to generate enough value? We decided to attach this to our iterative product development and try it out as part of our first phase. Doing this felt like an acceptable risk level of 5, a big decrease from the current level of 10.
Technical uncertainty. Sales wanted us to do something to capture their intuition. We told them we had no idea how to do that and offered to dissect what they called intuition to see if there was some underlying rule set we could uncover. When a salesperson felt that one client was a better match for a specific salesperson, what were the reasons? From this, we did identify a couple of previously undefined rules. Some of the intuition was based on the experience of the salesperson. No one wanted to match an inexperienced salesperson to an account with a spotted history. Another rule involved educational background. Some clients wanted a salesperson with at least a bachelor’s degree. No one had ever formalized these rules but there they were. But even with these defined, there was still a need for a “gut feel” matching of salesperson to client. If technology could not support this, the risk would remain high. But could technology support most of the matching? Could we somehow use a set of known rules to propose a match that this group then used their intuition to confirm or change? If so, the risk level dropped dramatically. Would this combination of technology and manual review be acceptable? Would it handle enough of the matches to generate enough value? We decided to attach this to our iterative product development and try it out as part of our first phase. Doing this felt like an acceptable risk level of 5, a big decrease from the current level of 10.
![]() Process complexity. The current risk assessment gave this a risk score of 8. How low did we need to drive this risk level before we could commit? While there were some opportunities to simplify the process, we convinced ourselves that this would never be a straightforward process. Given that, we declared that moving from 8 to 6 would be acceptable.
Process complexity. The current risk assessment gave this a risk score of 8. How low did we need to drive this risk level before we could commit? While there were some opportunities to simplify the process, we convinced ourselves that this would never be a straightforward process. Given that, we declared that moving from 8 to 6 would be acceptable.
![]() Technical complexity. Their matching process included quite a few variables. This resulted in a very complex rules engine design. Was there any possibility of reducing the number of variables? If so, the complexity would drop. With a drop in complexity, the risk, too, would drop. How low did it need to be? We agreed to a level of 3, down from 7 (which also motivated the team to find ways to reduce the rules engine complexity).
Technical complexity. Their matching process included quite a few variables. This resulted in a very complex rules engine design. Was there any possibility of reducing the number of variables? If so, the complexity would drop. With a drop in complexity, the risk, too, would drop. How low did it need to be? We agreed to a level of 3, down from 7 (which also motivated the team to find ways to reduce the rules engine complexity).
![]() Lack of standardization. This was going to be an issue no matter what we did and so we agreed that staying at a risk level of 6 was as good as we were going to get.
Lack of standardization. This was going to be an issue no matter what we did and so we agreed that staying at a risk level of 6 was as good as we were going to get.
![]() Uncertain value. This one nagged me. Even if we created a wonderful product that did a perfect job of matching clients to salespeople, would it be worth the time, effort, and opportunity costs? What projects could we have done instead of working on this matching engine? The salespeople assured me that this product—if it worked—would be a home run. But how could we know for sure until we did the project and incurred the costs? Anytime benefits are uncertain, I like to validate the business case before we fully commit. I explained this approach to the team. We would develop an early, simple version of the matching product and then try it out on the matching process. We would monitor the benefits and extrapolate what they would be if we finished the product. Knowing this before we invested in the entire product would resolve some of our uncertainty. We agreed that we would revisit this risk after we had completed and tried out that first version. We said that the goal of this first version would be to get the acceptable risk from 8 to 5.
Uncertain value. This one nagged me. Even if we created a wonderful product that did a perfect job of matching clients to salespeople, would it be worth the time, effort, and opportunity costs? What projects could we have done instead of working on this matching engine? The salespeople assured me that this product—if it worked—would be a home run. But how could we know for sure until we did the project and incurred the costs? Anytime benefits are uncertain, I like to validate the business case before we fully commit. I explained this approach to the team. We would develop an early, simple version of the matching product and then try it out on the matching process. We would monitor the benefits and extrapolate what they would be if we finished the product. Knowing this before we invested in the entire product would resolve some of our uncertainty. We agreed that we would revisit this risk after we had completed and tried out that first version. We said that the goal of this first version would be to get the acceptable risk from 8 to 5.
We drew this acceptable risk level on our radar diagram in green. Figure 7.2 shows the result.
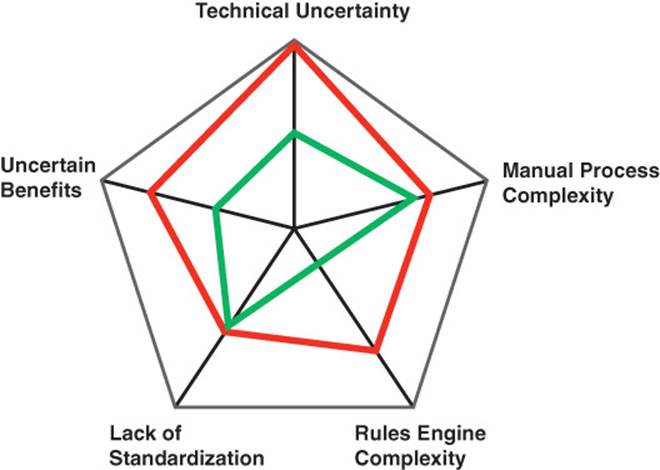
FIGURE 7.2 Acceptable risk
4. Develop Specific Actions We Will Take to Reduce the Risks to the Acceptable Level
Our conversations about what the risk levels must be before we commit had already yielded some concrete actions we could take to reduce the project risks. We added these steps into our project plans and backlog. Some of these actions are shown in Table 7.2.
Table 7.2 Risk Mitigation Actions
With these risk-reducing actions front and center and very visible, we started the project. In the first iteration, we implemented our risk-reduction rules (develop rules only for which there is consensus) and the experience and education rules. We also gave ourselves some risk-reduction credit for deploying the first few, simple rules to reduce the risks of the complex rules engine. This changed our risk/commitment radar diagram as shown in Figure 7.3.
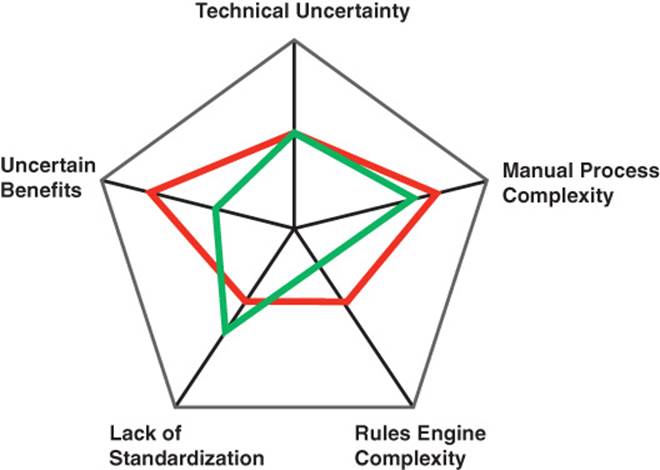
FIGURE 7.3 Iteration one risk profile
We still had to reduce the process complexity, rules engine complexity, and uncertain value risks before we could finalize any date or benefit commitments. And according to our action plans, we next needed to pilot what we had developed to see if there would be any actual value.
The sales team used this first version of the product at their next matchmaking meeting. With just a few simple rules in place, they shaved half a day off their meeting. Not huge but big enough to continue with the next iteration.
With some benefits now more certain, we updated our diagram as shown in Figure 7.4.
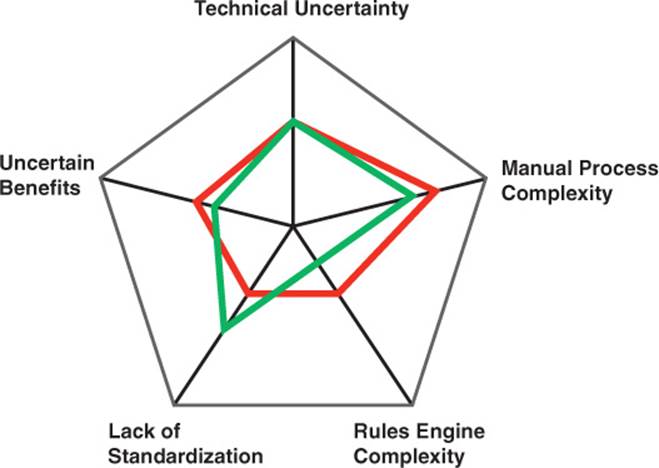
FIGURE 7.4 Iteration two risk profile
For the third iteration, the sales team agreed to some rules on vertical market and product experience. The team delivered the rules and then knew enough to architect the structure of a robust and variable rules engine. With that done, the risk profile changed to that shown in Figure 7.5.
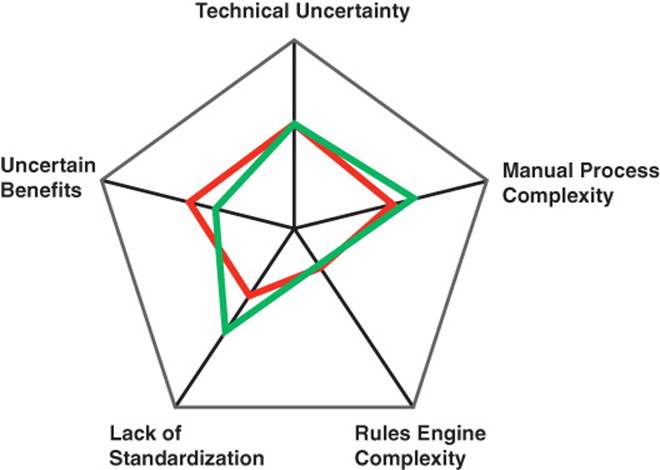
FIGURE 7.5 Iteration three risk profile
Just one more pilot might get us inside all the acceptable risk levels—and able to make a solid commitment. This second pilot saved a full day from the matchmaking meeting—a significant and certain benefit. Figure 7.6 shows the resulting visual.
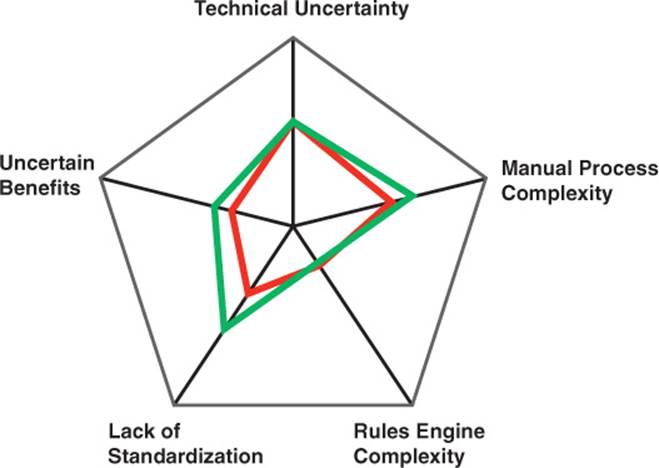
FIGURE 7.6 Iteration four risk profile
Along the way, we had made general commitments like: We will have the first iteration done by this date. After that, we will decide whether or not to move forward.
5. Once We Have Reached the Acceptable Level of Risk, Make a Commitment
Now, with two iterations and pilots complete, we were ready to discuss making commitments. We had a good idea as to the team velocity and pace. We had a good idea as to benefits. We could now commit to both dates and benefits. We still needed to manage the remaining work and make sure that we were not developing nebulous or overly complex rules or trying to read minds. In other words, we still had a big project to deliver but we were now able to make a commitment when we knew something.
“Purchasing” Options to Reduce Risks
There is another compelling advantage of using Proactive Risk Management. When we are brainstorming the actions we can take to reduce risks, we can also identify actions or information we can “purchase” to reduce risks faster or sooner. For example, we might determine that we can, for a price, allocate a person from the team to do a deep investigation of—perhaps even set up and run—a new technology. This might cost us the work of that one team member, but if doing so quickly gets a yes or no answer regarding technical uncertainty, it might be well worth the price. Once we have profiled the risks, risk-reduction options are more visible.
We were doing a large and critical analytics project. This project would predict customer retention based on a relatively small set of parameters. If this project worked, we would know which customers were trending away for us. Knowing this, we could then do an intervention to retain those customers. As a second phase of the project, we could categorize customers into their potential for leaving us and do things, proactively, to make sure they never even started to trend away from us. But this entire predictive model assumed we had access to information about our customers that we simply did not collect. Thus, the enabler of this entire project came down to gathering that information. To make matters worse, there was no single way to collect the data.
As a team, we brainstormed various methods we could use to get this information. We identified four ways that would cause the least pain and two ways that would cause us to make big changes across our systems. Always wanting the easiest way out, we agreed to try the four less painful methods. Given the critical nature of this project, we agreed to pursue all four in parallel. In effect, we “paid” for parallel development as a way to reduce project uncertainty as quickly as possible. We allocated a team to each method and set them free. And, for once, we got it right. Information for some customers was available with only one method while information for different types of customers came via a different method. Paying the “price” of parallel development reduced our project uncertainty sooner than a serial approach would have done.
Proactive Risk Management works extremely well if we get close to the truth when we profile the risks, are realistic about the actions we can take to reduce the risks to an acceptable level, somehow resist the pressure to make commitments until we know enough, and make it all visible to everyone—including the people who want that premature commitment.
Making Proactive Risk Management Visible
Proactive Risk Management is not only a way to consciously mitigate risks while taking a more sensible approach to commitment making, it is also a powerful management tool for tracking team progress and communicating status and success—by making them visible.
We can sum up our passion for making everything visible with the following motto:
It is better to see than it is to read.
What does that mean? It means that we should find ways to make all of our work more picture dense than word dense. In fact, making work visual is one of the fundamental principles of iterative development. Using iterative principles, we prefer working software to comprehensive documentation. Why? Because no one knows what they want until they “see” it, and they can read but can’t “see” requirements documents.
This ability to “see” is critical in Proactive Risk Management. Imagine the power of a set of risk level/acceptable risk level radar diagrams on a project dashboard. In the set, we show how we are iterating toward risks being at the acceptable level and our being able to make a specific commitment. Such a visual shows not only our commitment-making target but also that we have profiled the risks and implemented a plan that proactively reduces these risks, all at a glance.
Let’s apply this to our method of Proactive Risk Management. Imagine the power of a visual that shows the risk profile radar diagrams, the level of acceptable risk (prior to making a commitment), and the progress the team is making toward acceptable risk and commitment making. For a project dashboard, consider a series of these radar diagrams that demonstrate your progress. In the preceding example, we showed our progress with a series of radar diagrams that marked the shrinking risk. Figure 7.7 shows how we iterated toward acceptable risk.

FIGURE 7.7 Risk mitigation progress
Naturally, the information we use to create the visual reports must be accurate and complete. Where does that information come from? It comes from the various teams. But how can we find a balance between accurate and complete information and burdensome status reporting? To be honest, that is a balance that you will have to find for yourself and your teams.
Make Progress Visible
In one of my turnaround CIO roles, I inherited an IT team that had no credibility in the organization. As you can imagine, IT morale was low and turnover was high. As I talked with IT’s stakeholders and customers, one message came through loud and clear—IT never gets anything done. This attitude was so pervasive that the organization actively looked for ways to not use the internal IT department. If something required a connection to a legacy system, the project sponsor would reluctantly include the IT group. But if the project could stand on its own, the project was even more appealing since there was no need to tie the project deliverables to the boneheads in IT.
In truth, the IT department was highly skilled. There were clearly issues with priorities—which we improved using iterative principles and methods—but we got the biggest bang by using visual displays to communicate the status and completion of projects. One of the things we technical types do really poorly is communicate our work. One of the sad truths about human nature is this:
In the absence of communication, we assume the worst.
If we do not clearly and simply communicate the status of a project, people will assume there is not progress. The only way to change this is to communicate. The best way to communicate is visually.
Returning to my story, as we held project demos and iterative planning sessions, we recorded, at a lightweight and high level, the status and plans for each and every major project. Every two weeks, we turned this information into a report that we sent to the entire organization. The format of the report was a series of swim lanes—one lane for each project. The lane contained the high-level information about what was already complete, what was in progress, and what was planned. The chart did not include the in-release or in-sprint details. Rather, it provided a status at the product level. Figure 7.8 is an example of how we made our projects and their progress visual.
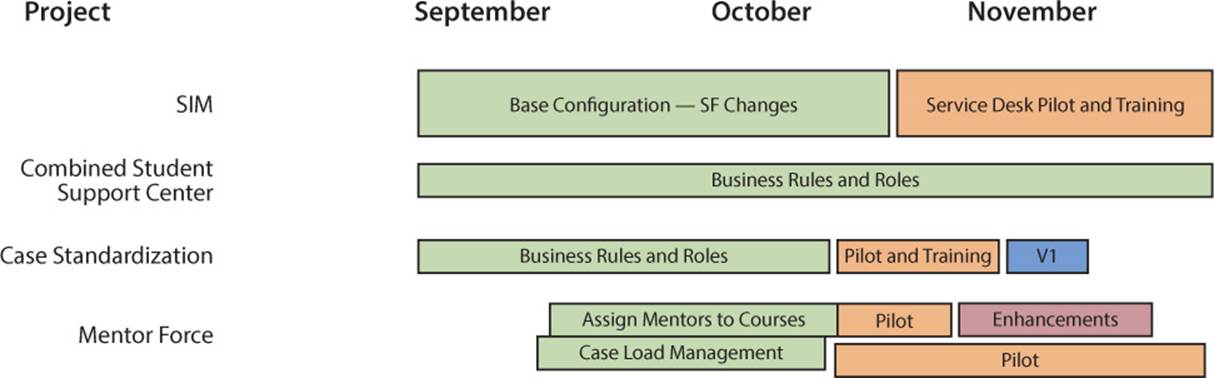
FIGURE 7.8 Project swim lanes
Every two weeks, it took about 30 minutes to update and distribute this report. Those 30 minutes every other week completely changed the organization’s perception of the IT group. When the organization could quickly and easily see (but not have to read) what projects were active, their status, and their completion, everyone in the organization decided we knew what we were doing and were good at what we were doing. Had we tried to communicate this same information is a wordy spreadsheet or text-heavy document, few would have read the report or understood the flow of the work (complete, in progress, planned). The visual nature of the information allowed people, at a glance, to not only know what was going on but also that we were good at delivery. Remember, when it comes to communication, It is better to see than it is to read.
When we first determined we had to use information to change the perception of IT’s ability, we struggled with how to capture the relevant information. In our first attempt, we created a shared document and asked each team lead to update their project status. This worked reasonably well in terms of gathering the right information but it was a nightmare to compile into a higher-level, consolidated report we could distribute. Next, we tried an every-other-week, face-to-face meeting with all of the teams. We hoped this meeting would not only surface the information we needed but also identify any cross-team coordination and dependencies. This worked well for the dependency management but was too frequent for any major changes in coordination. In terms of status reporting, it generated the information we needed but at the expense of consuming too many people’s time for too long. So after a two tries, we scrapped the meeting and tried something else.
Previously, I had had good success with what I called a 3P report. Those 3Ps are Progress, Plans, and Problems. Every two weeks, the teams reported what they had finished (Progress), what they would get done in the next two weeks (Plans), and any issues they needed leadership to resolve (Problems). Done correctly, this approach not only provides status information but also provides some tracking—if all is going well, the Plans in the current report should show up as Progress in the next report. But, this method can also become onerous if the reports take too much time to complete and compile. For my IT group, this method worked the best. I told each team to take no more than five minutes to create their report. Every other week, I would compile that information and translate it into our swim lane format. It all worked without too much pain—at least until something better came along. And nothing better came along. The swim lane was so useful and popular that every project in the company soon showed up in swim lane form.
Ambiguity and Iterative Methods
When using iterative methods we accept either that we do not yet know everything or that the future is uncertain—perhaps both. Rather than selecting a path and sticking to it—no matter how the environment changes around us—we take a series of small steps. At the end of each step, we evaluate the next steps we should take in order to get to the final destination.
In practice, by delivering iteratively, the customer and the team evaluate the business value of the product and determine, based on newly available knowledge, if it is best to adjust. Done well, iterative methods have proven successful for the teams that have used them.
In one company I worked at, we decided to experiment with iterative methods, but we wanted to put the iterative approach to a real test. We had one software project that was, after six months of intense development, six months behind schedule. The team was developing an entirely new version of one of our legacy products. There were lots of opinions about the product direction and required functionality. There was also a lot of uncertainty: Which features were the most important? What should the user interface look like? Which back-end technologies should we use?
The product requirements changed almost daily. For every step the team took forward, something pushed them backward. The team felt they were on a death march with no chance for success. They worked hard every day but never got anything done. The team’s customer was incredibly frustrated (even though it was this customer that, in grappling with all of the unknowns, continually changed the requirements). We figured that this project was the perfect candidate for our experiment with iterative methods. After all, if the new approach did not work, what was the downside? We deliver an even worse complete failure?
We trained the team in the basics of iterative development and spent a lot of time explaining the approach to the team’s customer. We did the high-level planning and prioritization, then planned the first iteration and did some medium-level planning of a couple of the following iterations. Everyone committed to keep the requirements in the current iteration completely solid—no one could change their minds or introduce new features or change the priority. If there were any changes, the team would deal with those in the future iterations. It took several cycles for everyone to become proficient at this approach but the team was soon generating real, valuable, working software at the end of each iteration. The team’s customer settled into her role and soon became a staunch advocate for not making any in-iteration changes. Instead, she focused on defining the next phase of the future work. At the end of each iteration, we collected feedback, learned, and adjusted. What was the result? In just six week (yes, weeks), a project that had been six months behind schedule was back on schedule.
Now, these results are not typical and your actual results may vary but the message is clear. If you are dealing with uncertainty—uncertainty about anything—iterative methods work much better than mapping and sticking to a path that does not recognize that things will change.
In Summary
We like to sum up the role of project management this way:
Once the planning is over and the project is under way, only bad things can happen.
All of these bad things are risks to the project. Rather than waiting for the bad things to happen, we should profile and prioritize the risks during project planning. We can then build risk mitigation into our plans and proactively manage the risks. This approach not only improves project performance, it also allows us to deal with the commitment tension—the pressure to make commitments when we know the very least. This also helps leaders understand the multitude of reasons we cannot commit to a date—yet.
Finally, making our risk mitigation visible not only helps our stakeholders understand why we cannot yet make detailed commitments, it also helps us promote our progress.
Because it is nearly impossible to predict the future, we are awash in ambiguity. Rather than defining a project plan that assumes no modifications, we should define our future state but take small steps toward that future state—pausing at the end of each step to reevaluate the new conditions before we take the next step.