Effective Ruby: 48 Specific Ways to Write Better Ruby (Effective Software Development Series) (2015)
8. Memory Management and Performance
There’s an old elevator pitch which proclaims that Ruby improves programmer happiness and therefore makes programmers more productive. Or you may have heard it this way: “Ruby is optimized for programmer performance.” Either way, I think there’s some truth in those statements. In that light, you can consider this book to be a guide for improving your happiness with Ruby. That is, excluding this chapter.
You can write code all day long with a smile on your face but eventually your application is going to have to execute in the real world. Once that happens you’re going to hobble along until you realize that parts of your application will need to run faster or with less memory. In Ruby, these two things are often directly related.
Figuring out why your application is performing poorly isn’t always an easy task. Knowing which tools to use is only one part of the solution. Knowing how Ruby manages memory and how you can reduce the number of garbage collection cycles is another. This chapter opens with an in depth look at the garbage collector, how it works, and how to adjust its performance.
The remainder of the chapter is dedicated to helping you track down performance issues with tips for fixing them. Maybe when you’re done you can put that smile back on your face and find joy in writing optimized Ruby code.
Item 44: Familiarize Yourself with Ruby’s Garbage Collector
A running Ruby program is made up of objects, and lots of them. For example, kicking off a fresh copy of IRB allocates around 100k objects before the garbage collector prunes that down to roughly 12k active objects. Practically everything you do in Ruby requires memory in one way or another. Managing all that manually would be tedious and error prone. Thankfully, we don’t have to.
The job of the garbage collector is to manage a pool of memory and eventually release objects that are no longer being used. Since every computer has a finite amount of memory, it’s advantageous to free up these unused objects. While we don’t have to manage memory manually since we have a garbage collector, we do have to give up a bit of performance for it. In order for the garbage collector to do its job properly it needs to pause your program while it’s running. Every major release of Ruby has included improvements to the garbage collector, most aimed at reducing the amount of time that program execution needs to be halted. There are also ways to tune the garbage collector to improve its performance for a specific application’s performance profile. But let’s not get ahead of ourselves.
Before we dive into tuning and exploiting the garbage collector let’s see how it works. Garbage collectors are complicated pieces of software engineering and come in several variations. From a very high level Ruby’s garbage collector uses a process called mark and sweep and is made up of two phases. First, the object graph is traversed. Objects that are still reachable from your code are considered alive and subsequently marked. Next, any objects that weren’t marked in the first phase are considered garbage and are swept away, releasing their memory back to Ruby and possibly the operating system.
Traversing the object graph and marking reachable objects is expensive. Ruby 2.1 introduced an optimization through a new generational garbage collector. Objects are divided into two categories, young and old. Generational garbage collectors work from the premise that most objects don’t live very long. Therefore, if an object survives for enough time it can be assumed that it’s likely to continue living even longer. There are lots of objects like this in any Ruby program, one category being those referenced from constants. Knowing that an object is likely to survive for a long time means the garbage collector can optimize the mark phase by automatically marking old objects as reachable, skipping entire sections of the object graph while traversing.
Ruby’s generational garbage collector promotes young objects to old objects if they survive one marking phase. That is, they lived long enough to still be reachable since the garbage collector was last triggered. With the concept of young and old objects, the marking phase can be split into two modes: major and minor. During the major marking phase all objects (young and old) are considered for marking. In this mode the garbage collector doesn’t consider generations and is therefore more expensive. Minor marking, on the other hand, only considers young objects and automatically marks old objects without checking to see if they’re still reachable. The garbage collector prefers to use minor marking unless some thresholds have been met to warrant a full, major marking. We’ll dig deeper into these thresholds shortly.
The sweeping phase of the garbage collector also has an optimization which divides it into two modes: immediate and lazy. In the immediate mode the garbage collector will free all unmarked objects. If there are a lot of objects to release then this mode will be expensive. Therefore, the sweeping phase also supports a lazy mode where it will attempt to free the minimum number of objects possible. Each time you create a new object in Ruby it might trigger a lazy sweeping phase to free up some space. To better understand this we need to look at how the garbage collector manages the memory where objects are stored.
Depending on the operating system it can be expensive for an application to request a memory allocation from the free store. A common workaround is to allocate more memory than you immediately need and maintain a memory pool, only asking the operating system for additional memory when the pool is empty. This is the technique that the Ruby garbage collector uses. The pool of memory is known as the heap. Ruby’s heap is divided into pages which are themselves subdivided into slots. Each slot is used to hold a single Ruby object. Figure 8-1 shows an example of the Ruby heap before and after garbage collection.
Figure 8-1. Marking and sweeping pages in the heap.
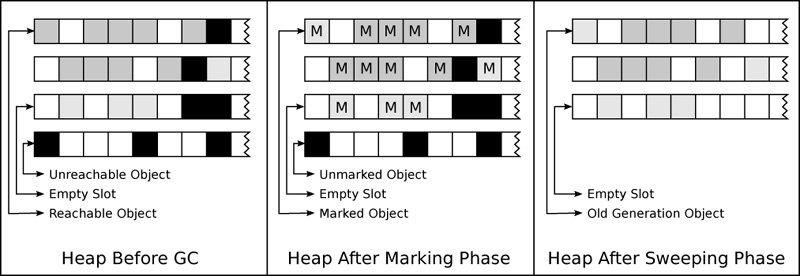
When a Ruby application first starts it will allocate several pages and place them in the heap. As I mentioned before, when you create an object, the garbage collector will first look for an empty slot in which to store the new object. If one can’t be found then it will attempt a lazy sweeping phase in order to free one. If it still can’t find an empty slot then the garbage collector will allocate a new page and add it to the heap. During a sweeping phase, if all slots in a page are released, the garbage collector might decide to return that page back to the operating system’s free store. This means that, as observed from the viewpoint of the operating system, the memory footprint of a Ruby process will appear to grow and shrink over time. From the inside, a Ruby process grows and shrinks by pages and not individual objects.
The number of initial slots can have an affect on the time it takes to start a Ruby program. (Think about all those classes and modules which are getting created as your source code and all of its dependencies are loaded. If it exceeds the number of available slots then the garbage collector will have to allocate more pages which might incur a performance penalty.) The default number of slots is likely to change between Ruby versions. With that in mind, the number of initial slots in Ruby 2.1 is 10k. The number of slots per page in the same version is 408. With those two numbers we can calculate that Ruby will allocate 24 pages on boot (the number of pages is rounded down to the nearest integer). You can change the number of initial slots (and thus the initial number of pages) by setting the RUBY_GC_HEAP_INIT_SLOTS environment variable. There are a few other environment variables which can be used to tune the garbage collector, we’ll walk through those in moment. But first, I want to show you how to access garbage collector statistics. Start an IRB session and run the following code:
irb> GC.stat
---> {:count=>9, :heap_length=>126, ...}
The GC::stat method will return a hash containing all sorts of interesting information about the garbage collector. Keep in mind that the keys in this hash and what they mean are internal to the garbage collector and may change in the next Ruby version. That said, let’s take a look at some of the more interesting keys:
• count, major_gc_count, and minor_gc_count tell you how many times the garbage collector has run in total, in major mode, and in minor mode, respectively.
• total_allocated_object and total_freed_object are the total number of objects created since the Ruby program began and the number of objects released. The difference between the two is the number of live objects, which can be found through the heap_live_slot key.
• heap_length is the number of pages currently in the heap.
• heap_live_slot and heap_free_slot are the number of used and available slots across all pages.
• old_object is the number of objects that are in the old generation and won’t be processed by a minor marking phase. The difference between heap_live_slot and old_object will tell you the number of young objects.
There are a couple of other interesting numbers in that hash, but before we review them it’s important to understand one final thing about the garbage collector. Recall that objects are stored in slots. The size of a slot in Ruby 2.1 is 40 bytes. Of course, not all objects can fit within that space. For example, consider a string containing 255 characters. When an object needs more memory than is available in its slot space, Ruby requests a chuck of memory from the operating system’s free store. When the object is destroyed and its slot is freed, Ruby will return the extra memory to the operating system. Now, let’s look at a few more entries from the GC::stat hash:
• malloc_increase is the total number of bytes being used by objects which need more memory than is available in their slot.
• malloc_limit is a threshold value. If the value of malloc_increase exceeds malloc_limit then the garbage collector will run in minor mode. The value of malloc_limit is adjusted dynamically during the life of a Ruby program by multiplying the current value of malloc_increase by an adjustable factor whose default value is 1.4. You can change the factor by setting the RUBY_GC_MALLOC_LIMIT_GROWTH_FACTOR environment variable.
• oldmalloc_increase and oldmalloc_limit are the old generation counterparts of malloc_increase and malloc_limit. When oldmalloc_increase exceeds oldmalloc_limit the garbage collector runs in major mode. The default multiplier for oldmalloc_limit is 1.2 and can be changed with the RUBY_GC_OLDMALLOC_LIMIT_GROWTH_FACTOR environment variable.
Let’s wrap up by reviewing the environment variables which can be used to tune the garbage collector for a specific application. Just as with the values in the GC::stat hash, these environment variables might change in the next Ruby release. As a matter of fact, there’s a good chance that Ruby 2.2 will support three generations as opposed to two. That will probably have an impact on these settings. The definitive source for information on tuning the garbage collector with environment variables can be found in the “gc.c” file which is part of the Ruby source code. Here are the settings that can be changed in Ruby 2.1:
• RUBY_GC_HEAP_INIT_SLOTS: The number of initial slots to create. Increasing this number from its default of 10k can reduce the number of times the garbage collector runs while your application is booting.
• RUBY_GC_HEAP_FREE_SLOTS: The minimum number of slots which should be available after the garbage collector runs. If the number of free slots drops below this value then additional pages will be allocated and added to the heap. The default value is 4096.
• RUBY_GC_HEAP_GROWTH_FACTOR: A multiplier which is used to decide how many pages should be added to the heap when adding additional slots. The number of used pages is multiplied by this factor to determine the number of pages to grow to. The default value is 1.8.
• RUBY_GC_HEAP_GROWTH_MAX_SLOTS: The maximum number of slots which can be added to the heap in one allocation. The default value is 0 which disables an upper limit.
• RUBY_GC_HEAP_OLDOBJECT_LIMIT_FACTOR: A multiplier used to calculate a threshold which when exceeded will force a major garbage collection. The threshold is calculated by multiplying this factor by the number of old objects from the last major garbage collection. The threshold is compared to the current number of old objects. The default value is 2.0, which means that if the number of old objects doubles since the last major marking phase another major marking will be forced.
• RUBY_GC_MALLOC_LIMIT: The minimum value for the malloc_limit key from the GC::stat hash. If the malloc_increase value exceeds malloc_limit then a minor garbage collection is triggered. This setting keeps malloc_increasefrom going below a specific value. The default value is 16,777,216 (16MB).
• RUBY_GC_MALLOC_LIMIT_MAX: This is the opposite of the RUBY_GC_MALLOC_LIMIT setting which keeps the malloc_limit value from going too high. It can be set to 0 to remove an upper limit. Default value is 33,554,432 (32MB).
• RUBY_GC_MALLOC_LIMIT_GROWTH_FACTOR: A multiplier which controls how the malloc_limit value grows over time. New malloc_limit values are calculated by multiplying this factor by the current value of malloc_limit. Default value is 1.4.
• RUBY_GC_OLDMALLOC_LIMIT: Old generation counterpart of RUBY_GC_MALLOC_LIMIT. Default value is 16,777,216 (16MB).
• RUBY_GC_OLDMALLOC_LIMIT_MAX: Old generation counterpart of RUBY_GC_MALLOC_LIMIT_MAX. Default value is 134,217,728 (128MB).
• RUBY_GC_OLDMALLOC_LIMIT_GROWTH_FACTOR: Old generation counterpart of RUBY_GC_MALLOC_LIMIT_GROWTH_FACTOR. Default value is 1.2.
Armed with these settings you should be able to decrease the time it takes to boot your application. But that’s just the beginning. The garbage collector gives you enough tuning knobs to reduce the number of times it becomes active during your application. Minimizing the number of times the garbage collector runs can directly influence the performance of your application, especially if you have plenty of memory to spare.
Things to Remember
• The garbage collector manages memory by maintaining a heap comprised of pages which are subdivided into slots. One slot can house one object.
• During garbage collection, reachable objects are marked and unmarked objects are swept away, opening slots for new objects.
• New objects are called young and are promoted to being old if they survive one cycle of the garbage collector. Old objects are automatically marked as being active in minor marking phases and therefore can only be swept away after major marking phases.
• The GC::stat method returns statistics about the garbage collector in the form of a hash.
• You can tune the garbage collector for your specific application by setting environment variables.
Item 45: Create Resource Safety Nets with Finalizers
Back in Item 24 we looked at how to use ensure clauses to release resources, even in the presence of exceptions. That item also explored a pattern were a class method allocates a resource, passes it to a block, and then releases the resource. The actual act of releasing the resource is done inside an ensure clause so it happens even if the invoked block raises an exception. As a refresher, here’s a generic class that manages an internal resource:
class Resource
def self.open (&block)
resource = new
block.call(resource) if block
ensure
resource.close if resource
end
end
Unfortunately, there are some specific cases where this pattern can’t be used. One example is when you need to hold on to a resource for a period of time longer than which you can spend inside an ensure clause. Most resource classes provide an alternative interface which allows programmers to get around this automatic releasing, leaving the programmer responsible for manually releasing the resource when they are done with it. In this case you should consider using the garbage collector to ensure the resource will eventually be released even if the programmer accidentally forgets.
Ruby doesn’t have deterministic destructors like a lot of languages do. The closest workaround is to register a finalizer with the garbage collector. Finalizers are Proc objects that will be invoked after an object has been destroyed. They are very tricky to write correctly so splash some water on your face and pay close attention. The following additions to the Resource class provide an interface programmers can use to manually manage objects, with the added bonus that the garbage collector is used as a safety net:
class Resource
# Manual (dangerous) interface.
def initialize
@resource = allocate_resource
finalizer = self.class.finalizer(@resource)
ObjectSpace.define_finalizer(self, finalizer)
end
def close
ObjectSpace.undefine_finalizer(self)
@resource.close
end
# Return a Proc which can be used to free a resource.
def self.finalizer (resource)
lambda {|id| resource.close}
end
end
First, in order to focus on the important parts, I’ve omitted a couple of method definitions from this class whose implementations are unimportant. I’ll mention what they’re for and what you could do with them as they are encountered.
The initialize method calls the allocate_resource method which should create and return the actual resource we’re protecting. This might be something like a database connection or a handle to a running process. The next step in initialize is a bit strange. It uses a class method to create a Proc object. This might seem completely unnecessary but this technique wouldn’t work without it. Before I explain, let’s look at that final line in the initialize method. It uses the ObjectSpace::define_finalizer method to tell the garbage collector that after its first argument is destroyed it should invoke the Proc object in its second argument. To understand how tricky this method is we need to take a slight detour and talk about the garbage collector and closures.
As I mentioned earlier, finalizers are invoked after an object is destroyed. If you remember from Item 44, the garbage collector will destroy objects after they are no longer reachable from the running program. And due to several optimization rules the garbage collector might take awhile to getting around to destroying unreachable objects. The thing you need to watch out for is that the Proc object which represents the finalizer must not hold on to a reference to the object that is doomed to destruction. If it does, then as far as the garbage collector is concerned, it’s still reachable. Let’s explore that further. Pretend that I had written this version of initialize instead of the previous:
def initialize
@resource = allocate_resource
# DON'T DO THIS!!
finalizer = lambda {|id| @resource.close}
ObjectSpace.define_finalizer(self, finalizer)
end
Recall that creating a Proc object also creates a closure, or in other words, a binding where all local variables which existed when the Proc was created are usable from within the body of the Proc. Here’s the catch, this closure also captures the self variable. If the finalizer holds on to the Resource object this way, the garbage collector will always mark it as being reachable and never remove it from the program. This can happen invisibly by a closure holding on to self or directly by referencing self in the body of the Proc. That’s why the original version of initialize used a class method to create the Proc, the self variable in that context refers to the class and not the current Resourceobject.
This can’t be overstated. If the Proc used with define_finalizer was created in a binding which can reference the object you’re interested in finalizing, the garbage collector will not be able to release it. If your finalizers don’t appear to run until the program terminates then there’s a good chance you’ve trapped the object in a closure. With that thought hammered into your head, let’s close with a couple of tips.
The lambda used as the finalizer’s Proc object took a single argument (which it didn’t use but must accept). A common mistake is to assume that this argument is the object that is being destroyed. While that would actually be pretty nice it’s not the case. The argument given to the finalizer is the ID of the recently destroyed object. Not as useful as the object itself but maybe still useful in some situations. You should also know that any exceptions generated from within the finalizer Proc will be ignored.
Notice that the Resource#close method uses undefine_finalizer. If the close method is called then we don’t need to close the internal resource a second time from within the finailzer. The safety net is no longer required and can be safely removed. While this simple example doesn’t demonstrate it, each object may actually have any number of associated finalizers. That is, you can use define_finalizer any number of times and the garbage collector will keep all of them. Calling ObjectSpace::undefine_finalizer removes all registered finalizers at once. The ObjectSpace API doesn’t provide a way to remove a single finalizer, it’s all or nothing.
The last thing I want to mention before we wrap up is timing. The garbage collector is highly optimized so that it runs as infrequently as possible. It might take some time for an unreachable object to be destroyed. Here’s the kicker though, finalizers are a really low priority job for the garbage collector. Finalizers may be called anytime after an object is destroyed and before the program terminates. That’s why it’s a last ditch effort and the ensure clause approach used in Item 24 is much more ideal.
Things to Remember
• Prefer to use ensure clauses to protect limited resources.
• If you must expose a resource outside of an ensure clause, create a finalizer for it.
• Never create a finalizer Proc within a binding that can reference the object you’re interested in finalizing. This will keep the object from being releasable by the garbage collector.
• Keep in mind that finalizers may be called anytime after an object is destroyed and before the program terminates.
Item 46: Be Aware of Ruby Profiling Tools
When your code isn’t performing quite as well as you’d like it’s easy to make assumptions about where there might be bottlenecks. Of course, if you blindly follow these assumptions you can waste a lot of time improving the performance of insignificant inefficiencies. Like everything in life, you should follow the evidence where ever it may lead and avoid forming conclusions without supporting data. “So, what evidence can I review in order to improve the performance of my Ruby programs?” I’m glad you asked.
The first step in diagnosing a performance problem is collecting statistics. They should include details such as where your program spends most of its time and which parts use the most amount of memory. The way to collect these statistics is by using a profiling tool. Armed with a performance profile of your program you can adjust problematic sections of the code. You can then generate another profile and compare it with the first to see the impact of your handy work. We’re going to take a look at a few different ways to generate these performance profiles. The profiles I’m about to show you were generated using trivial example code. I’m omitting the code listing so we can focus on how to generate and interpret the profiles since these tasks apply equally to any Ruby program.
The first profiling tool we’ll use is built into Ruby and exposed as a standard library. This is a good thing because it means that if you have Ruby installed you automatically have a profiling tool which works with that version of Ruby. To use this built in tool you can either require the profile library directly from within your source code or more easily, by asking Ruby to require it for you:
ruby -rprofile script.rb
If you haven’t seen it before, the “-r” command line option to the ruby executable is exactly the same as using require in your source code. The previous command tells Ruby to require the profile library and then execute the script.rb file. After the file has finished executing (or when you kill the appropriate ruby process) the profile library will print out a performance profile to the terminal. Be warned though, loading the profile library will drastically increase the amount of time it takes to execute your program. It might be a bit frustrating but don’t worry about the additional execution time, everything is slowed down equally so the performance profile will still be accurate. When the performance profile is finally produced it will look something like this:
% cumulative self self total
time seconds seconds calls ms/call ms/call name
62.60 15.70 3.92 433413 0.04 0.16 CSV#shift
10.13 18.24 2.54 14054 0.18 1.58 Array#each
4.39 19.34 1.10 405451 0.00 0.00 String#=~
3.79 20.29 0.95 405472 0.00 0.00 String#[]
3.51 21.17 0.88 420453 0.00 0.00 Hash#[]
3.27 21.99 0.82 405924 0.00 0.00 Array#<<
3.15 22.78 0.79 419475 0.00 0.00 String#==
I’ve trimmed the output for brevity. It’s likely that the actual output is much, much longer. In this particular example you can see that 62.6% of the execution time is spent in the CSV#shift method. In order to put that into perspective you first need to consider the other columns in the report.
The “% time”, “calls”, and “name” columns are obvious. The remaining columns are split into two categories, self and total/cumulative. To understand the difference between the two consider what happens when one method invokes another. When method a calls method b we consider a to be the parent and b to be the child. The “total ms/call” column reports the average number of milliseconds taken by a method per invocation, including the time used by its children. The “self ms/call” column, on the other hand, does not include the execution time associated with a method’s children. In the same way “cumulative seconds” shows the total amount of time a method took for all invocations combined, including the time taken by its children. The “self seconds” column is the same measurement but without the children included.
Looking at the first line again, we can see that CSV#shift spends 75% of its time invoking and waiting for other methods. (You can see this by comparing “total ms/call” and “self ms/call”.) Unfortunately, it’s not clear which methods those are or even how many there are. This type of profile is known as a flat profile and is mostly useful for tracking down the most expensive methods in a program. Once you need more information you’ll have to turn to other profiling tools, and that’s what we’ll do now.
A very popular and capable profiling tool is the ruby-prof gem. Besides producing a variety of reports, ruby-prof is also a lot faster than the standard profile library that ships with Ruby. It can produce text reports like the profilelibrary, along with HTML reports and call graph diagrams. Consider this call stack profile which I’ve adapted from HTML and trimmed for brevity:
94.91% CSV#each [ 1 calls]
-> 93.44% CSV#shift [ 13982 calls]
-> 91.27% Kernel#loop [ 13982 calls]
|> 9.47% String#=~ [405449 calls]
|> 8.00% String#[] [405449 calls]
|> 5.77% Array#<< [405449 calls]
|> 5.72% Hash#[] [419430 calls]
|> 5.54% String#empty? [419430 calls]
|> 5.40% String#== [405449 calls]
|> 2.56% String#split [ 13981 calls]
|> 1.20% String#sub! [ 13981 calls]
This profile reports the parent-child relationship between methods by placing the child below and to the right of the parent. We can now see that CSV#shift calls Kernel#loop which itself calls several String methods. If you compare this report with the flat profile from earlier you can see that CSV#shift spends most of its time calling String#=~ to match strings against regular expressions.
It’s worth noting that the statistics reported by the two profiles we’ve seen thus far are different. This is an unfortunate artifact of using different tools with different data collection techniques and performance penalties. I recommend that you prefer the ruby-prof gem to the standard profile library. The former is much faster and produces several different reports, including flat profiles. If you’re using Ruby 2.1, however, there’s another tool you should consider.
Beginning in version 2.1, Ruby includes a tracing and profiling facility which can be used by extensions written in C. The main advantage of this new feature can be found in the fact that it’s fast, very fast. In my experiments there was no noticeable difference between executing code with and without the new API activated. That’s quite impressive as far as profiling goes. At the time of this writing, the best way to profile your code using this new API is by using the stackprof gem.
Unlike with the previous profiling tools we’ve seen, stackprof must be explicitly activated in your code in order to generate a profile. This is done by requiring the stackprof library and then using StackProf::run. This method takes a block and records profiling information while the block is executing. Here’s an example:
require("stackprof")
StackProf.run(out: "profile.dump") do
...
end
After the block has finished, StackProf::run will write a profile report into the file specified by the named argument out. This is a binary file created with the Marshal::dump method. The easiest way to work with this file is through the included stackprof utility. The following command will print out a flat profile report to the terminal:
stackprof profile.dump
In addition to the flat profile, stackprof can generate a small number of other reports as well, both human-readable and those meant for other tools. Like with ruby-prof, stackprof has good documentation which includes more advanced examples than what I can include here. If you’re using Ruby 2.1 or later I highly recommend that you consider using stackprof.
So far we’ve used three different tools to create performance profiles. The statistics we’ve collected have illuminated slow methods, methods that were called a large number of times, and how a method’s children can influence its performance. What we haven’t seen is how to measure the memory usage of a program and find out if any of our methods are memory hogs. Unfortunately, memory profiling in Ruby isn’t as mature as it should be.
Part of that has to do with the fact that Ruby uses a garbage collector. So, if Ruby manages memory for us, we’re kind of stuck with its performance, right? Yes and no. As you’ll see in Item 47, it’s not hard to create a lot of temporary objects and slow things down. It’s also possible to accidentally keep a reference to an object for longer than you’d like. Doing so can actually lead to a memory leak since the long-lived reference prevents the garbage collector from getting rid of the referenced object.
Another problem with memory profiling is that the Ruby garbage collector and memory management code is a constantly moving target. As it turns out, there are quite a few memory profiling gems available, but the vast majority of them only work with older versions of Ruby. The only one that works across all of the Ruby versions supported by this book is a gem we’ve already seen: ruby-prof. It works around the ever changing garbage collector by injecting its own memory profiling functionality into the Ruby interpreter. As a consequence, in order to profile memory with ruby-prof you have to build a custom version of Ruby. If you’re using a version of Ruby before 2.1, ruby-prof and a custom Ruby interpreter is your best option. Profiling memory in ruby-prof is done by selecting one of the memory reporting options with the “--mode” command line option. Here’s an example:
ruby-prof --mode=memory script.rb
Starting with Ruby 2.1 there’s a new, experimental API for collecting memory statistics. There’s also a gem which makes it really easy to use this API, but we’ll get to that. Ruby exposes two sets of APIs through the GC and ObjectSpace modules. The GC module can be used to control the garbage collector, we’ve already seen how to use the GC::stat method to see what the garbage collector has been up to. In a similar way, the ObjectSpace module allows you to get quite a bit of information about the large number of objects being managed by Ruby. It also provides an API to collect and record memory allocation statistics. Here’s how you start collecting that information:
require("objspace")
# Start collecting allocation information.
ObjectSpace.trace_object_allocations_start
Once you’ve started collecting memory allocation information you can record it to a file. Depending on your program, you might want to wait until just before it terminates or record the allocation information at regular intervals. Either way, it’s a good idea to start by forcing the garbage collector to run so that any unreachable objects are swept away. This should help improve the accuracy of the report and remove irrelevant information. Recording the allocation statistics to a file is easy:
# Force garbage collector to run.
GC.start
# Write current statistics to a file.
File.open("memory.json", "w") do |file|
ObjectSpace.dump_all(output: file)
end
If you’re collecting memory information through the ObjectSpace API you’ll most likely keep the tracing enabled for the duration of your program. However, if you want to disable it, you can:
# Stop collecting allocation information.
ObjectSpace.trace_object_allocations_stop
The file created by the dump_all method can be quite large. As the file name suggests, the data written into it is in the JSON format. While this does make it human readable, it’s still not very friendly. You’ll probably want to write a helper tool to pick out the details that you’re interested in. Or, you can skip the ObjectSpace API altogether and use the next tool in our lineup, the memory_profiler gem.
Using the ObjectSpace API in Ruby 2.1, the memory_profiler gem can collect and report on a lot of information about how your program is making use of memory. Like with the stackprof gem, you have to manually activate memory profiling in your code. With the memory_profiler gem there’s also an additional step. After profiling a block of code the MemoryProfiler::report method returns a report object which you then use to print out the contents of the report to the terminal:
require("memory_profiler")
report = MemoryProfiler.report do
...
end
report.pretty_print
The report generated by the memory_profiler gem focuses mainly on two categories of objects, allocated and retained. Allocated objects are exactly what they sound like, any object created while the block given to MemoryProfiler::report was running. Retained objects are those that were not released after the block finished. Some of these retained objects might be classes and modules that live until Ruby terminates, and some may be leaked objects that are sticking around due to long-lived references. Allocated and retained objects are reported by the source code files that created them. The following is a significantly trimmed report from the memory_profiler gem:
Total allocated 892553
Total retained 4680
allocated memory by gem
-----------------------------------
2.1.1/lib x 75201418
rubygems x 1181583
other x 120
allocated memory by location
-----------------------------------
lib/ruby/2.1.0/net/protocol.rb:153 x 35241433
lib/ruby/2.1.0/csv.rb:1806 x 16217960
lib/ruby/2.1.0/csv.rb:1833 x 16217960
lib/ruby/2.1.0/csv.rb:1783 x 2918998
retained memory by location
-----------------------------------
lib/ruby/2.1.0/rubygems/core_ext/kernel_require.rb:55 x 116966
lib/ruby/2.1.0/uri/common.rb:853 x 20440
lib/ruby/2.1.0/x86_64-linux/socket.so:0 x 17676
lib/ruby/2.1.0/uri/common.rb:863 x 11680
We’ve covered a lot of profiling reports and tools in this item. Clearly, if you’re trying to track down a performance problem in your Ruby code you have several options to choose from. The tools you choose largely depend on which version of Ruby you’re working with. For versions before Ruby 2.1, the ruby-prof gem is your best option. Starting with Ruby 2.1, however, ruby-prof can be complemented with the stackprof and memory_profiler gems. With these additions to your toolbox you’ll be surprised at how easy it can be to improve the performance of your Ruby programs.
Things to Remember
• Use a profiling tool to collect evidence before you start modifying poorly performing code.
• Prefer the ruby-prof gem to the standard profile library. The former is much faster and produces several different reports.
• If you’re using Ruby 2.1 or later you should consider using the stackprof and memory_profiler gems.
Item 47: Avoid Object Literals in Loops
Quick, how many objects does this code create?
errors.any? {|e| %w(F1 F2 F3).include?(e.code)}
This is fairly idiomatic code, something you’re likely to see out in the wild. If the errors array has n elements then this code will create up to 4n objects. The reason there’s a range of possibilities is due to the any? method from the Enumerable module. It invokes its block once for each element in the array as long as the block returns false. Once the block returns true, the any? method can short circuit and avoid iterating over the remaining elements. That explains the potential number of iterations, but where does the 4 come in? Recall that the %w notation used in the block is equivalent to—but more efficient than—using split:
"F1 F2 F3".split
In this case, the %w notation creates an array containing three strings, and it does this each time the block is called. As soon as the include? method completes, the newly created array becomes unreachable garbage which Ruby will eventually sweep away. Just in case you think this has something to do with %w, here’s the same code with an array literal instead:
errors.any? {|e| ["F1", "F2", "F3"].include?(e.code)}
Both versions create 4 objects each time the block is invoked. The problem is obviously that the array of strings should be a constant. It’s never mutated or assigned to a variable, which might be part of reason why Ruby programmers tend to overlook these unnecessary allocations. But it’s not just the allocations themselves that are problematic. Each time an object is created in Ruby it might trigger a partial or full garbage collection run. This simple looking line of code could turn out to be a performance bottleneck. (But remember to avoid jumping to conclusions about performance problems and follow the advice in Item 46.)
The other part of the problem is that we don’t write explicit loops in Ruby. The closest you can get is by using the for keyword, but that’s rarely used in practice. Instead, Ruby programmers prefer the iterator pattern and supply blocks to methods like any? and each, which may then invoke these blocks any number of times. Therefore, creating these temporary objects in hidden loops is the real problem. Thankfully, the fix is easy. Promote object literals in loops (which are disguised as blocks) to constants if the objects are never mutated:
FATAL_CODES = %w(F1 F2 F3).freeze
def fatal? (errors)
errors.any? {|e| FATAL_CODES.include?(e.code)}
end
This version moves the array literal out of the loop and into a constant. Following the advice in Item 4, the constant is also frozen so that can’t be accidentally mutated. With this change the 4 objects will be created once when the code is loaded, instead of each time through the loop. As a result, the number of allocations is reduced along with the risk of invoking the garbage collector. I recommend you do this with any object literal. But, before you go and start refactoring, let’s look at one surprising change to Ruby starting in version 2.1. Consider this variation of the loop we’ve been reviewing:
errors.any? {|e| e.code == "FATAL"}
This code has the same problem as the others, albeit on a smaller scale. Each time the block is invoked it will create a string which is used solely for comparison and then quickly becomes garbage. If you’re using a version of Ruby prior to 2.1 the fix is the same as above, promote this string literal to a constant. But if you’re using 2.1 or later you have another option:
errors.any? {|e| e.code == "FATAL".freeze}
Frozen string literals in Ruby 2.1 and later are equivalent to constants. The block in the previous example will only allocate a single string on its first invocation. All subsequent invocations will use the same string object. As a matter of fact, once a frozen string literal is introduced it can be shared throughout the entire program. Therefore, if the string used in this block had been allocated previously then the block wouldn’t allocate any new objects. Essentially, these strings act like symbols with the added benefit that they can be garbage collected when they’re no longer being used. Just remember, this optimization only works if you freeze a string literal. It doesn’t have the same affect if you freeze an arbitrary string object.
Things to Remember
• Promote object literals in loops (which are disguised as blocks) to constants if the objects are never mutated.
• Frozen string literals in Ruby 2.1 and later are equivalent to constants and are shared throughout the running program.
Item 48: Consider Memoizing Expensive Computations
A very common optimization pattern used in Ruby that you should be familiar with is memoization. You’ve probably written code using this pattern without realizing it. Consider this snippet of code, which can be found in nearly every web application in one form or another:
def current_user
@current_user ||= User.find(logged_in_user_id)
end
Thanks to the "||=" operator, the User::find method is only invoked once and its result is memoized in the @current_user variable. There's a lot going on in this single line of code so let's take a closer look by expanding the "||=" operator:
@current_user || @current_user = User.find(logged_in_user_id)
Now it should be clear that if @current_user is false or nil then User::find will be called. In that case the result from User::find will be stored in @current_user. On the other hand, if @current_user already has a value which Ruby considers true then its value will be returned instead of evaluating the right-hand side of the “||” operator. As long as the @current_user instance variable has a non-false, non-nil value then the current_user method will return that value instead of calling User::find.
This, of course, is a caching technique. Suppose for a moment that this method belongs to a request object for a web application. Many layers throughout the application need to query the request object to discover various details about the current user. If it weren’t for the memoization, each call to current_user would trigger a call to User::find, which presumably queries a database. Caching the result of an expensive method call like this can have a major impact on performance. Let’s look at another example. Consider this:
def shipped? (order_id)
file = fetch_confirmation_file
if file
status = parse_confirmation_file(file)
status[order_id] == :shipped
end
end
The shipped? method takes an order ID and checks to see if that order has shipped from the warehouse. To do that it has to pull the latest confirmation file from the warehouse and look into the file for an order’s status. The obvious problem with this method is that it fetches and parses the confirmation file each time it’s called. One possible way to improve this would be to factor the fetching and parsing out of the shipped? method and place it into the initialize method. Another valid solution is to use memoization:
def shipped? (order_id)
@status ||= begin
file = fetch_confirmation_file
file ? parse_confirmation_file(file) : {}
end
@status[order_id] == :shipped
end
In this version, the @status variable holds a hash which contains the status of all orders from the warehouse’s confirmation file. If this variable hasn’t yet been initialized then the right-hand side of the “||=” operator will be evaluated, which happens to be a begin block. As you know, nearly everything in Ruby is an expression, and a begin block is no different. Evaluating a begin block will return the value from its last expression. Therefore, in this example, the @status variable will be set to either the return value from parse_confirmation_file or an empty hash. After the @status variable is assigned a hash from the begin block it won’t evaluate that block again. This means that you can call the shipped? method as many times as you’d like and it will only fetch and parse the confirmation file once.
As you can see, adding memoization to your code is rather simple. You know what that means right? There’s probably a catch. Let’s turn our attention to some of the subtle problems that crop up when using memoization.
First, how long do you suppose you should cache the result of a method? With the current_user example, the memoization was self-resetting with each web request. Other uses of memoization might last quite a bit longer, maybe even for the duration of a running program. You should consider how long a method should be memoized and whether you need to provide a method which resets the memoization by setting the caching variable to nil.
In more complex situations, the method you want to memoize might have arguments which need to be taken into account. Consider the lookup method which builds a cache based on an argument:
def lookup (key)
@cache ||= {} # Make sure @cache exists.
@cache[key] ||= begin
...
end
end
The lookup method is memoized with a dependency on its argument. It will only perform the expensive computation (the begin block) once for each possible key value. That is, if you call the lookup method more than once with the same key it will only evaluate the begin block a single time. If you call it with a key which hasn’t yet been cached then the begin block will be evaluated. Adding additional arguments into the mix increases the complexity. For each additional argument you need to decide if the cache depends on it and if so how to construct a hash key which includes all of the dependencies.
Another potential problem to consider is whether the method you want to memoize has side effects which can’t be skipped. At the beginning of this item we looked at the current_user method. It clearly has a side effect in that it queries a database. This just happens to be a side effect which we want to only happen once per request. But what if a method has other side effects such as mutating instance variables or writing to a log file. Memoizing methods like that might improve the performance for part of the code but completely break the logic in another. Always make sure you consider the consequences of skipped side effects due to memoization.
Take a moment to look back at the shipped? method and notice that it always returns true or false. This is much safer than methods like current_user which return mutable objects. Consider what happens when the User object returned from current_user is modified by a caller. Since current_user always returns the same variable, every call after the mutation will be exposed to those changes. When this isn’t desirable you should consider returning frozen objects from memoized methods.
Finally, the biggest question you should ask yourself before employing memoization is whether it’s actually necessary. Follow the advice in Item 46 and profile your program before you jump to conclusions about its performance. Adding memoization to a method might be easy but as we’ve seen it comes with some risks. Make sure you actually need it before you start sprinkling it throughout your code.
Things to Remember
• Consider providing a method which sets the caching variable to nil as a way to reset the memoization.
• Make sure you consider the consequences of skipped side effects due to memoization.
• If you don’t want callers to be able to modify a caching variable you should consider returning frozen objects from memoized methods.
• Profile your code to see if you need memoization before you start using it.
Epilogue
The ideas presented in this book stretch much further than the space between its covers. Thanks to the many contributors in the community, Ruby is a living, breathing project that continues to evolve. I encourage you to get involved, whether it’s through working on Ruby itself or by releasing your hard work as a Ruby Gem. Give back to the community that has so graciously given to you. At the same time, demand that we all work harder to create reliable, secure software which pushes the boundaries of what is possible.
Our journey through this book and its topics has been fun for me, and hopefully enjoyable for you too. My hope is that, in some way, I have helped you and thus impacted the software you work on. I appreciate any feedback you might have for me as well as any questions that remain unanswered. You can reach me through the website for this book at http://effectiveruby.com. Thank you for reading!