Advanced Programming Techniques (2011, 2013)
7. Statistics
101
Statistical measurements are extremely useful in computer programs especially in clustering data. This chapter shows how to correctly compute common statistical values: minimum, median, maximum, sum, mean, variance, standard deviation, and correlation coefficient and shows how to translate mathematical summation expressions (∑) into computer code.
Minimum
There are several ways to find the minimum value in a series of numbers. The algorithm shown below uses a loop that will cause the computer to compare every value in an array to a running minimum. At any point during the execution of the code, the running minimum holds the smallest value that the computer has encountered. When the computer reaches the end of the array, the running minimum will hold the actual minimum value of the series.
Example 1
/** Returns the minimum value stored in an array. */
public static double minimum(double[] data) {
double min = data[0];
for (int i = 1; i < data.length; ++i) {
if (data[i] < min) {
min = data[i];
}
}
return min;
}
|
Desk Check |
||||||
|
data |
i |
min |
||||
|
9 |
12.3 |
−3 |
5 |
|||
|
[0] |
[1] |
[2] |
[3] |
|||
To find the maximum value in an array, simply modify the above code to look for the largest value instead of the smallest value. In other words, modify the above code by changing the less than operator (<) to the greater than operator (>) and by changing the variable name min to max.
Another way to find the minimum and maximum values in an array is to sort the values in the array in ascending order. Then the minimum value will be stored in the first location of the array, and the maximum value will be stored in the last.
102
Summation
Often within a program, we have a series of numbers stored in an array, and the program needs to calculate the sum of those numbers. Summation is shown in mathematical notation using an upper case Greek sigma (∑) like this:
n
∑
i=1
xi
where X represents the entire series, xi represents a single value within that series at location i, and n is the number of values within that series. The previous symbols can be read as “the sum of the series X from the 1st value to the nth value, inclusive.” In other words:
n
∑
i=1
xi = x1 + x2 + … + xn
When we write a program to compute the sum of a series of numbers stored in an array, we simply write a loop to add all the values in that array. This simple operation is also known as accumulation and is shown in the following examples.
Arrays in C, C++, Java, JavaScript, VB.NET, and many other languages are zero-based, meaning the very first element is always at location 0 within the array. Because of this, when writing code in these languages, we think of the mathematical summation expressions with i starting at zero like this:
n–1
∑
i=0
xi
instead of the way shown above.
Example 2
/** Returns the sum of the values stored in an array. */
public static double sum(double[] data) {
double s = 0;
for (int i = 0; i < data.length; ++i) {
s += data[i];
}
return s;
}
|
Desk Check |
||||||
|
data |
i |
s |
||||
|
7 |
3 |
−2 |
4.4 |
|||
|
[0] |
[1] |
[2] |
[3] |
|||
Example 3 uses a for each loop to perform the same summation as example 2. Some programmers prefer the for each loop (example 3) over the standard counting loop (example 2) because it is shorter to write.
103
Example 3
/** Returns the sum of the values stored in an array. */
public static double sum(double[] data) {
double s = 0;
for (double x : data) {
s += x;
}
return s;
}
|
Desk Check |
||||||
|
data |
x |
s |
||||
|
7 |
3 |
−2 |
4.4 |
|||
|
[0] |
[1] |
[2] |
[3] |
|||
Mean
The statistical mean of a series of numbers is the expected or average value of that series. The mean is often represented by the Greek letter mu (μ) and is defined by this formula:
μ =
1
n
n
∑
i=1
xi =
x1 + x2 + … + xn
n
where X represents a series with n values and xi is a single value within that series at location i.
From this formula we see that the most obvious way to compute the mean of a series of numbers is to first compute the sum of that series and then divide the sum by the number of values in the series. The previous two code examples show how to compute the sum of a series, so example 4 calls one of the previous two examples.
Example 4
/** Returns the average of the values stored in an array. */
public static double mean(double[] data) {
double s = sum(data);
return s / data.length;
}
|
Desk Check |
||||||
|
data |
s |
return |
||||
|
7 |
3 |
−2 |
4.4 |
|||
|
[0] |
[1] |
[2] |
[3] |
|||
Variance
The variance of a series of a numbers, which is represented by the Greek letter sigma squared, (σ2) is a measure of how disperse or spread out the numbers are from the mean. A related measure is the standard deviation which is represented by the Greek letter sigma, (σ) and is simply the square root of the variance. The variance is defined by this formula.
σ2 =
1
n
n
∑
i=1
(xi − μ)2
From this formula the most obvious way to compute the variance is to first compute the mean (μ), which requires one pass through the data. Then compute the variance by subtracting the mean from each value in the series, squaring this difference and summing the squared values, all of which requires a second pass through the data. Here is the Java code to compute the variance with two passes through the data.
104
Example 5
/** Computes the variance with two passes through the data. */
public static double varianceTwoPass(double[] data) {
final double m = mean(data); // First pass.
double sqsum = 0.0;
// Second pass.
for (int i = 0; i < data.length; ++i) {
double x = data[i];
double t = x - m;
sqsum += t * t;
}
double var = sqsum / data.length;
return var;
}
|
Desk Check |
||||||||||
|
data |
m |
i |
x |
t |
sqsum |
var |
||||
|
7 |
3 |
−2 |
4.4 |
|||||||
|
[0] |
[1] |
[2] |
[3] |
|||||||
With a little algebra we can rewrite the variance formula and see how to compute the variance with only one pass through the data. The formula for the variance is
σ2 =
1
n
n
∑
i=1
(xi − μ)2
By expanding (multiplying) the squared portion of the summation we get
σ2 =
1
n
n
∑
i=1
(xi2 − 2μxi + μ2)
Addition can be separated, so separating the parts of the summation gives us
σ2 =
1
n
n
∑
i=1
xi2 −
1
n
n
∑
i=1
2μxi +
1
n
n
∑
i=1
μ2
However, 2μ and μ2 are both independent of the summation (they do not include any reference to i). So we can place the independent parts outside of the summations.
σ2 =
1
n
n
∑
i=1
xi2 − 2μ
1
n
n
∑
i=1
xi + μ2
1
n
n
∑
i=1
1
105
Recall that the formula for the mean is
μ =
1
n
n
∑
i=1
xi
and that
n
∑
i=1
1 =
We can substitute both of these formulas into the formula for the variance.
σ2 =
1
n
n
∑
i=1
xi2 − 2μμ + μ2
1
n
n
Which can be simplified as
σ2 =
1
n
n
∑
i=1
xi2 − μ2
This final equation shows us how to compute the variance with only a single pass of the data. During that single pass of the data, we must compute two sums, (1) the sum of the numbers squared and (2) the sum of the numbers needed for the mean.
Example 6
/** Computes the variance with a
* single pass through the data. */
public static double varianceOnePass(double[] data) {
double sum = 0.0;
double sqsum = 0.0;
for (int i = 0; i < data.length; ++i) {
double x = data[i];
sum += x;
sqsum += x * x;
}
double n = data.length;
double mean = sum / n;
double var = sqsum / n - mean * mean;
return var;
}
|
Desk Check |
|||||||||||
|
data |
i |
x |
sum |
sqsum |
n |
mean |
var |
||||
|
7 |
3 |
−2 |
4.4 |
||||||||
|
[0] |
[1] |
[2] |
[3] |
||||||||
106
Correlation
The correlation coefficient of two series of numbers or samples is a measure of the strength of a linear relationship between the two samples. The correlation coefficient is usually called just the correlation and is represented by the Greek letter rho (ρ) and is always a number in the range [−1, 1]. A correlation near −1 or 1 means the two samples are linearly related. A correlation near 0 means the two samples are not linearly related.
The formula for the correlation of two samples, X and Y, is:
ρxy =
σxy
σxσy
where σxy is the covariance of the two samples and σx and σy are the standard deviations of X and Y respectively. The formula for the covariance of X and Y is
σxy =
1
n
n
∑
i=1
(xi − μx)(yi − μy)
We could use the previous formula for the correlation and this formula for the covariance to help us write a function to compute the correlation. However, this function would require two passes of each sample, X and Y, in order to compute the correlation.
We can rewrite these formulas using steps similar to those used in the section on variance which will enable us to write a function to compute the correlation with only a single pass of each sample. To rewrite the covariance formula, we first multiply the two parenthesized expressions which gives us
σxy =
1
n
n
∑
i=1
(xiyi − μxyi − μyxi + μxμy)
Separating the summation into parts gives
σxy =
1
n
n
∑
i=1
xiyi −
1
n
n
∑
i=1
μxyi −
1
n
n
∑
i=1
μyxi +
1
n
n
∑
i=1
μxμy
Removing the terms that are independent of i from the summations yields
σxy =
1
n
n
∑
i=1
xiyi − μx
1
n
n
∑
i=1
yi − μy
1
n
n
∑
i=1
xi + μxμy
1
n
n
∑
i=1
1
Substituting the definition for the means of X and Y and using
n
∑
i=1
1 = n
gives
σxy =
1
n
n
∑
i=1
xiyi − μxμy − μyμx + μxμy
1
n
n
Simplifying, we get
σxy =
1
n
n
∑
i=1
xiyi − μxμy
Substituting this formula for covariance and the formulas for the standard deviation of X and Y into our original equation for correlation gives us
ρxy =
1
n
n
∑
i=1
xiyi − μxμy
/
/
√
1
n
n
∑
i=1
xi2 − μx2
/
/
√
1
n
n
∑
i=1
yi2 − μy2
107
This final equation shows us how to compute the correlation with only a single pass through the two samples. During that single pass, the computer must compute the covariance of X and Y and the variance of X and the variance of Y, which requires the computer to compute five sums.
1. the sum of the X values
2. the sum of the X values squared
3. the sum of the Y values
4. the sum of the Y values squared
5. the sum of the product of the X and Y values
As you read the correlation code below you can see each of these summations.
Example 7
/** Computes the correlation coefficient of two samples. */
public static double correlation(double[] dataX, double[] dataY) {
double sumX, sumY, sumX2, sumY2, sumXY;
sumX = sumY = sumX2 = sumY2 = sumXY = 0.0;
for (int i = 0; i < dataX.length; ++i) {
double x = dataX[i];
double y = dataY[i];
sumX += x;
sumY += y;
sumX2 += x * x;
sumY2 += y * y;
sumXY += x * y;
}
double n = dataX.length;
double meanX = sumX / n;
double meanY = sumY / n;
double sdevX = Math.sqrt(sumX2 / n - meanX * meanX);
double sdevY = Math.sqrt(sumY2 / n - meanY * meanY);
double covar = sumXY / n - meanX * meanY;
double correl = covar / (sdevX * sdevY);
return correl;
}
|
Desk Check |
||||||||||||
|
dataX |
i |
x |
y |
sumX |
sumY |
sumX2 |
sumY2 |
sumXY |
||||
|
12 |
4 |
3.9 |
2.1 |
|||||||||
|
[0] |
[1] |
[2] |
[3] |
|||||||||
|
dataY |
||||||||||||
|
12 |
3.2 |
3.5 |
1.9 |
|||||||||
|
[0] |
[1] |
[2] |
[3] |
|||||||||
|
n |
meanX |
meanY |
sdevX |
sdevY |
covar |
correl |
108
Numerical Stability
Computers do not perform arithmetic in the same way that humans do. Humans use ideal arithmetic when adding, subtracting, multiplying, and dividing real numbers. Computers do not use ideal arithmetic but instead represent real numbers as IEEE 754 floating point numbers which are base 2 numbers with three parts, the sign, the significand (sometimes called the fraction or mantissa), and the exponent.
|
sign |
−4.7013267 |
× 1026 exponent |
|
significand |
The significand and exponent are represented with a limited number of bits (binary digits) or in other words with limited precision. Because of this limited precision, a computer sometimes loses accuracy when performing arithmetic. For example, when I run a simple Java program that uses double precision floating point arithmetic to add 0.1 + 0.2, my computer calculates a result of 0.30000000000000004 which is close but incorrect. Losing accuracy during a computation is called numerical instability, and if it is bad enough in an algorithm, the computer will simply give the wrong answer.
All the previous algorithms shown in this chapter are simple and easy to understand but are known to be numerically unstable for some data. For example the mean function shown earlier in this chapter returns Infinity as the average value of this series [6.0×10307, 6.0×10307, 2.0×10307, 6.0×10307]. However, examining the series, it is clear that the mean is really 5×10307.
This section shows algorithms to compute the mean, variance, and correlation with improved numerical stability. To understand how these algorithms are derived, we will rewrite the function for computing the mean of a series of numbers. Here is the formula for computing the mean of a series of n values.
μ =
1
n
n
∑
i=1
xi =
x1 + x2 + … + xn–1 + xn
n
We can rewrite the right hand side of the above equation by grouping the values x1 + x2 + … + xn−1 and then multiplying and dividing that group by (n − 1).
μ =
(n − 1)(x1 + x2 + … + xn–1)
n − 1
+ xn
n
Notice that
x1 + x2 + … + xn–1
n − 1
is simply the mean of the first n − 1 values in the series. So we can rewrite the equation for the mean of all n values as a recursive equation
μn =
(n − 1) μn–1 + xn
n
which is recursive because μn depends on μn−1. Distributing the (n − 1) gives this equation
μn =
nμn–1 − μn–1 + xn
n
109
and simplifying results in
μn = μn–1 +
xn − μn–1
n
We can use this formula for μn to write the forumula for μn–1
μn–1 = μn–2 +
xn–1 − μn–2
n − 1
We can substitute the formula for μn–1 for the first occurrence of μn–1 which gives
μn = μn–2 +
xn–1 − μn–2
n − 1
+
xn − μn–1
n
We can continue to substitute the recursive definitions for the first occurrence of each mean until we get
μn = μ0 +
x1 − μ0
1
+
x2 − μ1
2
+ … +
xn–1 − μn–2
n − 1
+
xn − μn–1
n
We can rewrite this equation using summation like this
μn =
n
∑
i=1
xi − μi–1
i
where μ0 = 0. From this equation we can see how to implement the mean function in a way that gives more stable results. This stable implementation is shown below. As you examine the code, recall that Java arrays are zero-based and that series in the equations above are one-based. This difference forces us to write i in the equations as i+1 in the code.
Example 8
/** Returns the average of the values stored in an array. */
public static double meanStable(double[] data) {
/* Sort the data so that all small values such
* as 0.000000003 will be at the beginning of
* the array and their contribution to the mean
* of the data will not be lost because of the
* precision of the CPU. */
java.util.Arrays.sort(data);
double mean = data[0];
for (int i = 1; i < data.length; ++i) {
double delta = data[i] - mean;
mean += delta / (i + 1);
}
return mean;
}
|
Desk Check |
|||||||
|
data |
i |
delta |
mean |
||||
|
−2 |
3 |
4.4 |
7 |
||||
|
[0] |
[1] |
[2] |
[3] |
||||
110
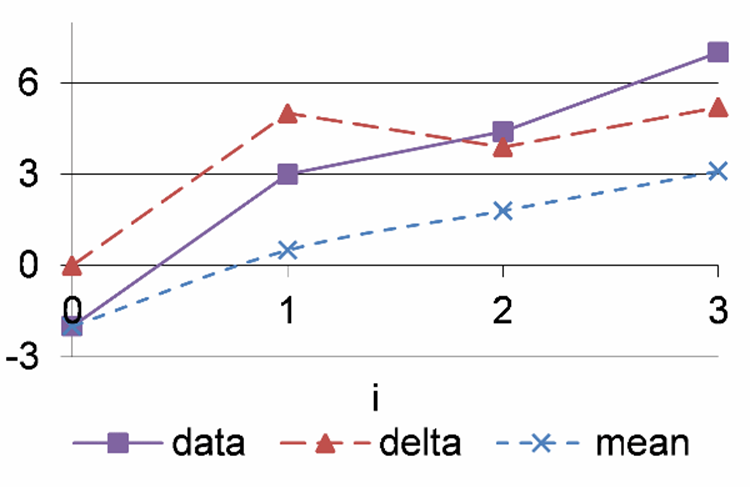
Figure 29: A graph of the data, delta, and mean values.
To understand how the above code works, it is helpful to see a graph of the data and delta and mean as shown in figure 29. Notice how the mean is a running mean. The mean starts at the same value as the first data element, and then as each new element is processed, it holds the mean of all the previously processed elements. In other words, as each new data element is processed the mean moves closer and closer to the mean of all the data.
Just as we did for the mean, we can rewrite the formulas for computing the variance of a series and the correlation of two series to make computing the variance and correlation more stable. However, I will spare you the details of deriving these formulas. Here is Java code for computing the variance and the correlation in a numerically stable way.
Example 9
/** Returns the variance of a series of numbers. */
public static double varianceStable(double[] data) {
/* Sort the data so that all small values such
* as 0.000000003 will be at the beginning of
* the array and their contribution to the
* variance of the data will not be lost
* because of the precision of the CPU. */
java.util.Arrays.sort(data);
double mean = data[0];
double sqsum = 0.0;
for (int i = 1; i < data.length; ++i) {
double weight = i / (i + 1.0);
double delta = data[i] - mean;
mean += delta / (i + 1);
sqsum += delta * delta * weight;
}
double var = sqsum / data.length;
return var;
}
|
Desk Check |
||||||||||
|
data |
i |
weight |
delta |
mean |
sqsum |
var |
||||
|
−2 |
3 |
4.4 |
7 |
|||||||
|
[0] |
[1] |
[2] |
[3] |
|||||||
111
Example 10
/** Computes the correlation coefficient of two samples. */
public static double correlationStable(double[] dataX, double[] dataY) {
double meanX = dataX[0];
double meanY = dataY[0];
double sumX2, sumY2, sumXY;
sumX2 = sumY2 = sumXY = 0.0;
for (int i = 1; i < dataX.length; ++i) {
double weight = i / (i + 1.0);
double deltaX = dataX[i] - meanX;
double deltaY = dataY[i] - meanY;
sumX2 += deltaX * deltaX * weight;
sumY2 += deltaY * deltaY * weight;
sumXY += deltaX * deltaY * weight;
meanX += deltaX / (i + 1);
meanY += deltaY / (i + 1);
}
double n = dataX.length;
double sdevX = Math.sqrt(sumX2 / n);
double sdevY = Math.sqrt(sumY2 / n);
double covar = sumXY / n;
double correl = covar / (sdevX * sdevY);
return correl;
}
Multiple Statistics at Once
|
Stats |
|
–min : double |
|
+Stats(data : double[]) |
Figure 30: A UML class diagram for a class to calculate multiple statistics at one time.
The minimum, median, maximum, count, sum, mean, variance, and standard deviation can all be computed with a sort and a single computation pass of the sorted data as shown in the Stats constructor below. Because this function is computing eight different values and because a Java function can return only one value, we need to define a class and create an object to hold the eight values. The class is shown in a UML class diagram in figure 30.
public class Stats {
private double min, median, max;
private double sum, mean, var, sdev;
private int count;
112
Example 11
public Stats(double[] data) {
count = data.length;
/* Sort the data so that all seemingly
* insignificant values such as 0.000000003
* will be at the beginning of the array
* and their contribution to the mean and
* variance of the data will not be lost
* because of the precision of the CPU. */
java.util.Arrays.sort(data);
/* Since the data is now sorted, the minimum value
* is at the beginning of the array, the median
* value is in the middle of the array, and the
* maximum value is at the end of the array. */
min = data[0];
int half = data.length / 2;
median = data[half];
if (isEven(data.length)) {
median = (data[half - 1] + median) / 2.0;
}
max = data[data.length - 1];
/* Compute the mean and variance using
* a numerically stable algorithm. */
double sqsum = 0.0;
mean = data[0];
for (int i = 1; i < data.length; ++i) {
double x = data[i];
double weight = i / (i + 1.0);
double delta = x - mean;
mean += delta / (i + 1.0);
sqsum += delta * delta * weight;
}
sum = mean * count;
var = sqsum / count;
sdev = Math.sqrt(var);
}
|
Desk Check |
||||||||||
|
data |
i |
x |
weight |
delta |
mean |
sqsum |
||||
|
−2 |
3 |
4.4 |
7 |
|||||||
|
[0] |
[1] |
[2] |
[3] |
|||||||
|
count |
min |
med |
max |
sum |
var |
sdev |
113
public static boolean isEven(int x) {
return (x & 2) == 0;
}
@Override
public String toString() {
return " count " + count + " min " + min +
" med " + median + " max " + max +
" sum " + sum + " mean " + mean +
" var " + var + " sdev " + sdev;
}
}
Programming Exercises
1. Copy the sum, mean, and meanStable functions as shown in this chapter into a Java class. Then write Java code that tests the mean and meanStable functions for the series of large numbers given in this chapter. What value does the mean function return? What value does the meanStable function return? Which answer is correct?
2. Write Java code to test the mean and meanStable functions with 10 random numbers in the range [1, 10]. Do both functions return the same answer?
All materials on the site are licensed Creative Commons Attribution-Sharealike 3.0 Unported CC BY-SA 3.0 & GNU Free Documentation License (GFDL)
If you are the copyright holder of any material contained on our site and intend to remove it, please contact our site administrator for approval.
© 2016-2026 All site design rights belong to S.Y.A.