5 Steps to a 5: AP Computer Science Principles 2024 - Sway J.S. 2023
8 Data
STEP 4 Review the Knowledge You Need to Score High
IN THIS CHAPTER
Summary: This chapter focuses on how data is represented in the computer. To identify new information through data, it may need to be labeled to make it easier to find, sometimes compressed for ease of sharing, and stored, secured, and processed to make sense of it for solving problems or for identifying new findings.

Key Ideas
![]() Abstractions including numbers, colors, text, and instructions can be represented by binary data.
Abstractions including numbers, colors, text, and instructions can be represented by binary data.
![]() Numbers can be converted from one number system to another. Computers use the binary number system.
Numbers can be converted from one number system to another. Computers use the binary number system.
![]() Metadata helps us find and organize data.
Metadata helps us find and organize data.
![]() Computers can clean, process, and classify data more accurately and faster than people can.
Computers can clean, process, and classify data more accurately and faster than people can.
![]() Using computer programs to sift through data to look for patterns and trends can lead to new insights and knowledge.
Using computer programs to sift through data to look for patterns and trends can lead to new insights and knowledge.
![]() Searching for bias in the data collection process is important.
Searching for bias in the data collection process is important.
![]() Communicating information visually helps get the message across.
Communicating information visually helps get the message across.
![]() Scalability is key to processing large datasets effectively and efficiently.
Scalability is key to processing large datasets effectively and efficiently.
![]() Storage needs led to the creation of lossy and lossless compression techniques.
Storage needs led to the creation of lossy and lossless compression techniques.
Key Terms
Abstraction
Analog data
Bias
Binary number system
Bit
Byte
Classifying data
Cleaning data
Digital data
Filtering data
Information
Lossless data compression
Lossy data compression
Metadata
Overflow error
Patterns in data
Round-off or rounding error
Scalability
Number Systems
Data. It comes from everything we do. Someone or some organization is interested in our data. This data can be stored in variables or lists and can be input to programs or output from them. Let’s go into depth about how this data can be represented and analyzed.
Binary is the number system used in computer science. Computers read machine code, which at the lowest level, is made up of 0s and 1s. This is the binary number system. A “0” represents no electrical charge, and a “1” represents a charge. “Current” and “no current” are easy conditions to detect. These binary digits are referred to as bits. Eight bits make up a byte.
Numbers as Abstractions
Abstraction is a concept that is a little hard for many students to grasp. The basic idea is that we remove details to make something more general. This makes it easier to use the process for multiple purposes versus one specific purpose. One benefit is that we do not have to know what goes on behind the scenes, meaning how something works. We only need to know that it works. Let’s apply this concept to numbers.
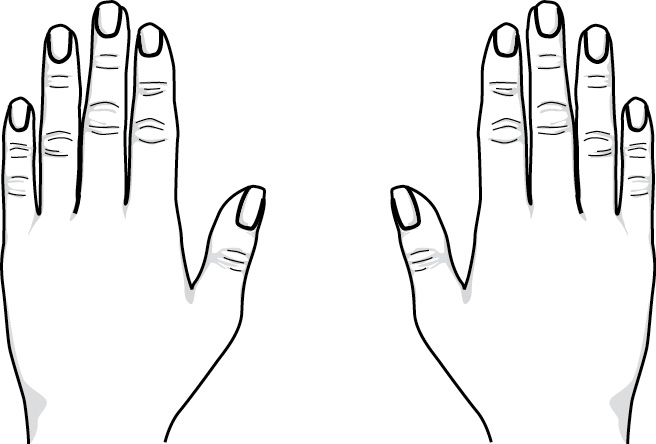
Think of several ways you can represent the number of marbles in the pile in the image.

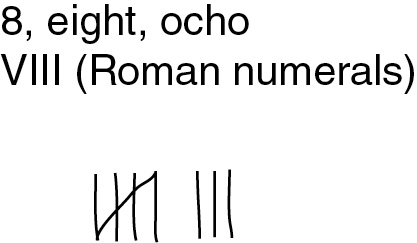
Each of these is a simplified way to represent how many marbles are in the pile. Each numeric representation is an abstraction, because they simplify the details of what we have, and we know that we have “eight” of them. Each of the different number systems represents the same amount. Other number systems can also be used.
Since this is a digital document, the image of the marbles is also represented by binary digits, 0s and 1s. We see the image of the marbles and do not need to know how the shapes and colors are represented by the bits. The words on this page are also represented by bits, 0s and 1s. All digital data are represented by binary digits.
Binary Number Conversions
All number systems use the same principles.
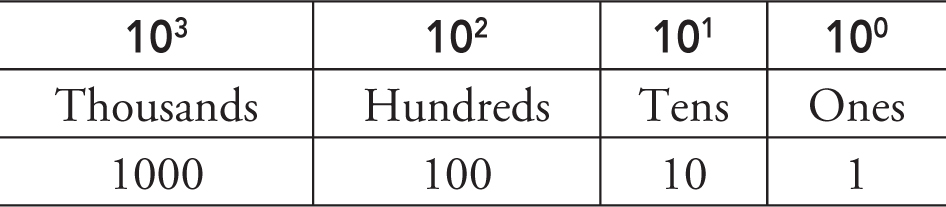
Our base 10 decimal system uses 10 numbers from 0 to 9.
Here’s a quick review of first- or second-grade math, because you probably don’t look at numbers this way anymore. When you need to represent the number 10, you have to carry over to a new column, the “tens” column, and use two numbers. Your number represents how many “tens” you have and how many “ones” you have. When you need to represent the number “100,” you have to carry over to a third column, the “hundreds” column. (The concept of “carrying over” is now often termed “regrouping.”)
Each new column represents the next power of 10.
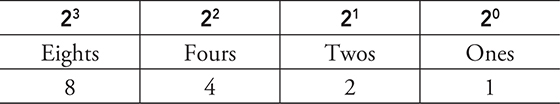
Base 2, binary, uses two numbers, 0 and 1.
When you need the number 2, you have to carry over to a new column, the “twos,” and use two numbers to represent it. Your number represents how many “twos” you have and how many “ones” you have. For the number “4,” you carry over to a third column, the “fours.” The next column is the “eights.”
Each new column to the left represents the next power of 2.
Converting Decimal Numbers to Binary
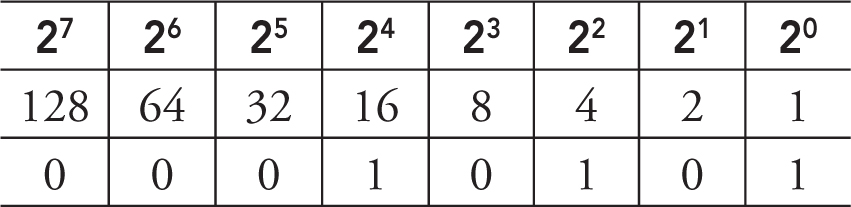
When you need to convert a decimal number to binary, create the following table on your paper. We will use a byte (8 bits), but the table can keep going to the left with 2 raised to the next power. Today, most personal computers are 64-bit machines, so the table can get quite large!

Notice that each column to the left represents an increasing power of 2 that doubles the column to the right of it.
To convert a decimal number to binary, use the following algorithm with the above table.
1. Write down the decimal number.
2. Subtract the largest number from the binary table that is the same or less. (When you subtract, you cannot have a negative number.)
3. Mark a 1 in the column on the table for the power of 2 you subtracted.
4. Mark an 0 in the columns that could not be subtracted and were skipped.
5. Repeat steps 2 to 4 until your decimal value reaches zero.
6. Note: Use leading 0’s on the left to make a byte (8 bits).
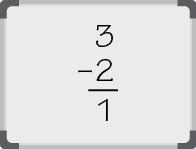
Example 1: Convert 21 to binary.
Starting from the left-most column, the first number you can subtract without having a negative result is 16. Place a 0 in each column to the left of 24 and a 1 in the column for 24.
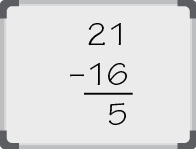
Take the number remaining after subtracting and find the next number in the table that can be subtracted without resulting in a negative number.
You cannot subtract 8, so place a 0 in the 23 column.
You can subtract 4, so place a 1 in the 22 column.
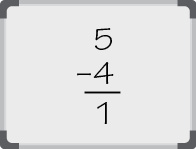
The result is now 1, so place a 0 in the 21 column and 1 in the 20 column.
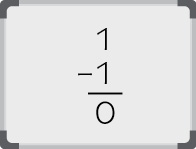
Answer: 2110 = 000101012
The subscript 10 means base 10 (decimal) and the subscript 2 means base 2 (binary).
Example 2: Convert 119 to binary.
Create your table of powers of 2 from 20 to 27.
Starting from the left-most column, the first number you can subtract without having a negative result is 64. Place a 0 in the 27 column to the left of 26 and a 1 in the column for 26. Subtract the value of 26, which is 64, from 119.
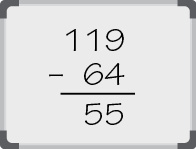
The next power of 2 is 25, which is 32. This can be subtracted without a negative result, so place a 1 in the 25 column.
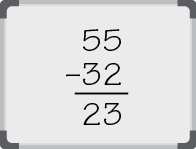
The next power of 2 is 24, which is 16. This can be subtracted without a negative result, so place a 1 in the 24 column.
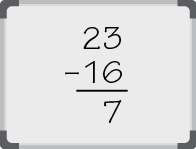
We cannot subtract 8 and have a positive result, so place a 0 in the 23 column. We can subtract 4, so place a 1 in the 22 column.
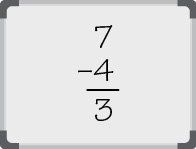
We can subtract 2 from 3, so place a 1 in the 21 column.
The result is now 1, so place a 1 in the 20 column.
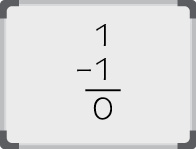
The result of the conversion is:
11910 = 011101112
Converting Binary Numbers to Decimal
To convert a binary number to decimal:
1. Write the binary table as we did in the examples above with each bit of the binary number in the appropriate column.
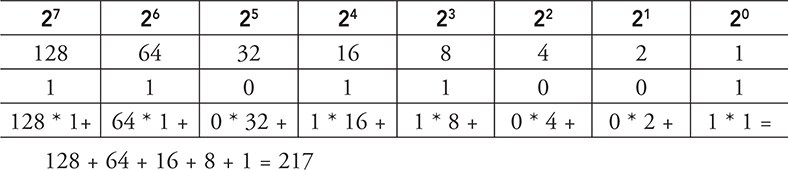
2. For columns that have a 1 in them, add the values of the power of 2. (You are multiplying 0 or 1 times the value of the power of 2 in each column.)
3. The total of all columns with a 1 in them equals the decimal value equivalent.
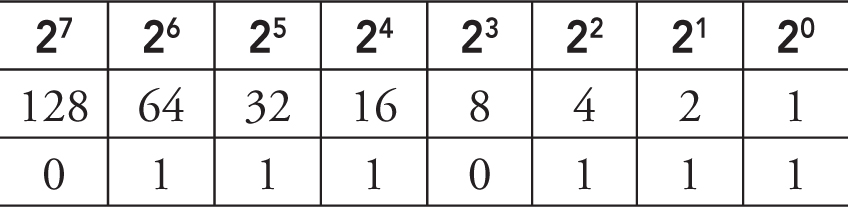
Example 1: Convert 00011011 to decimal.
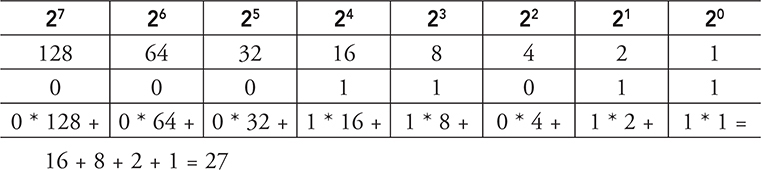
Example 2: Convert 11011001 to decimal.
Anytime you have a binary number that is all 1s to the right, the number in decimal is always 1 less than the next power of 2. Logically this makes sense, since you cannot have the number 2 in binary. The next value would need a new column and would be the next power of 2. For example:
000001112 = 710 because the next value in the chart would be 23 = 8 or 10002
000111112 = 3110 because the next column is 25 or 32
011111112 = 127 because the next column is 27 or 128
How Binary Numbers Can Be Interpreted
Letters
In addition to the numbers we just reviewed, binary numbers can also represent letters for text fields. Each letter has a binary value mapped to it. The software for the particular application knows when it sees a binary number whether it is looking for a number or a letter and interprets it accordingly.
Colors
Binary numbers are also used to represent colors. The human eye primarily detects red, green, and blue. Other colors are a combination of these three colors in different amounts. Computer monitors work the same way and add differing amounts of red, green, and blue to create the colors that are displayed. That is where RGB, for red, green, and blue, came to be known and can still be seen as a label for monitor and projector connections.
Earlier color representations used a byte (8 bits) for colors using three bits for red, three for green, and two for blue: RRRGGGBB. Only 256 colors could be represented using 1 byte. The retro arcade games and old video games you may have seen used 256 colors.
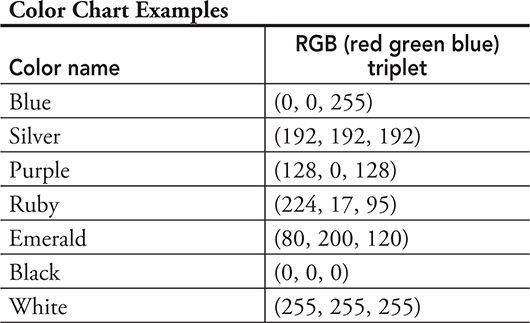
Now computers use one byte for each color. RRRRRRRRGGGGGGGGBBBBBBBB. With eight numbers for each color, we can create 256 possible shades of red times 256 possible green shades times 256 possible blue shades:
256 * 256 * 256 = 16,777,216 possible colors
Notice in the table below:
Blue has the full amount of blue, but no other color.
Black is zero amounts of red, green, and blue.
Silver has equal amounts of red, green, and blue.
The software program takes in the binary value and interprets it as a color, text value, or number, based on what the program is expecting.
Machine Instructions
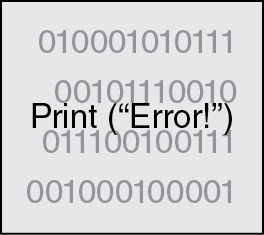
When your code is converted from the natural language type command, such as: print(“Error!”), to machine language, it is converted to binary. Just as with numbers, text, and colors, the compiler or interpreter is software that knows how to convert the values and what they represent in binary.
print(“Error!”)
The text “Error!” is converted to binary as below.
01000101 01110010 01110010 01110010 01110010 00100001
The “print” command is also converted to binary along with the instructions in binary that tell the program how to print text.
In summary, if we simply had a binary number: 00101001, we would not know what it represented. It could be a number, text, color, instruction, or other representation. However, the software using it knows what it is and how to interpret it.
Overflow Errors
Overflow errors occur in computers when the integer to be represented needs more bits than the programming language can represent. A fixed number of bits are assigned to hold integers in many programming languages. When the limit is reached, an overflow error occurs. This varies for different computers, and you are not expected to know this value for each computer for the AP exam.
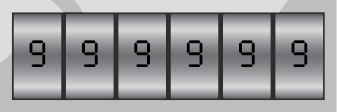
Think of it like a car odometer when it is at the highest value it can show.
When you travel one more mile or kilometer, the odometer can roll over to 000001. A computer does not roll over to 1 when it reaches the maximum value it can hold. Instead, the bit that represents the number’s sign (positive or negative) is flipped. The overflow error for an expected positive number as the result is a negative number and the result indicating an overflow error for an expected negative number is a positive number.
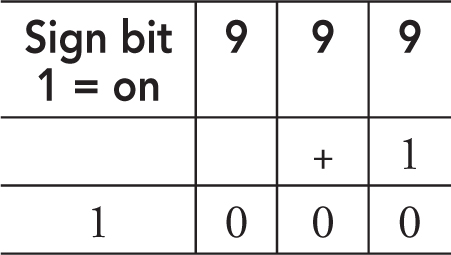
Example: Assume 999 is the largest number that can be represented even though we know it would be in binary. If you add 1 to it, you would expect the result to be 1000. Since the computer cannot process this number, it produces -000 as the result, which is the smallest number our example here can represent. It does the addition, but 1 is now in the sign position, which flips our value to be negative. Your program will not produce an error when this occurs. Be sure to test for this condition, especially when you know very large or small numbers may be used with the program. It takes the same number of digits to represent a positive number as the negative of it. You can think of it as needing the same number of digits if you took the absolute value of a negative number. Both the positive and negative numbers have a sign digit included.

Other programming languages represent integers based on the size of the computer’s memory rather than being set by the programming language. On the AP exam, this is how numbers will be represented. You will not need to calculate a value that would create an overflow error, but you might see a question about the concept.
Rounding or Round-off Errors
Rounding errors occur because of the way numbers with decimal points are stored in the computer. They are imprecise and are stored as a whole number + the decimal point + the fractional part of the number. This imprecise nature can cause rounding errors and possibly inaccurate results in your programs.
Example: 1.0 could be stored as 0.999999998
You are not responsible for knowing the ranges for real numbers on the AP exam.
Whole numbers are stored precisely as the integer they represent.
Analog Data
Analog data is a continuous stream of data values. Think of the sound a train whistle makes as it nears and then leaves a crossing. It changes pitch (higher and lower tones) and gets louder and softer as it nears and leaves the crossing. It can be represented by a continuous wave representing the sound. Analog data can represent anything, including colors. Back in the predigital days, music was on albums and cassettes in analog format. When we made a copy of the recording, it was not an exact duplicate, and we lost some of the sound quality.
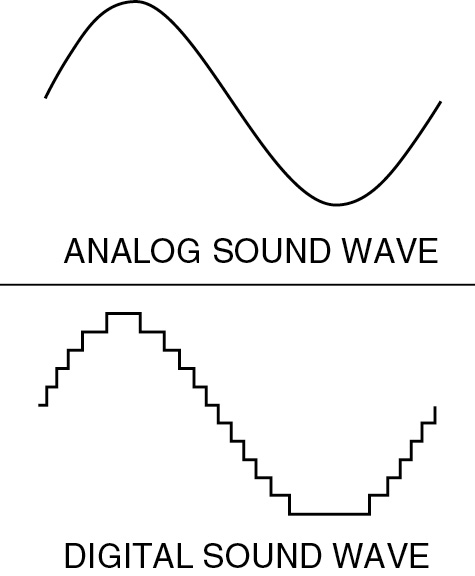
As we know, digital data is just 0s and 1s. It approximates the continuous stream of analog data by taking samples or measured values of it at defined intervals such as each millisecond. The digital data plays these values back and it appears continuous due to the sampling rate. The conversion of analog data to digital is an abstraction, because we don’t know or need to know what happens in between each digital value taken at its point in time. We just know that it sounds or appears the same as it did when it was in analog format.
With today’s digital data, a master version of a recording or image is just 0s and 1s, so you can easily make an exact match with no loss of quality. This has an impact on the ethics and legality of sharing perfect digital copies of music, videos, games, and books.
Data Compression: Lossless and Lossy
There are considerations and trade-offs that have to be constantly evaluated when it comes to storing data. Image files become large very quickly. Therefore, compression techniques were developed to decrease their size. Some images store data by pixel (picture element). If you had an image that was 300 × 400 pixels = 120,000 pixels, with 3 bytes per pixel for color as described previously, it would take approximately 120000 * 3 = 360,000 bytes for one picture. Depending on the bandwidth, this image could take up to a minute to download, which is quite slow for one image.
We can reduce the amount of space needed to represent the image or other file through data compression:
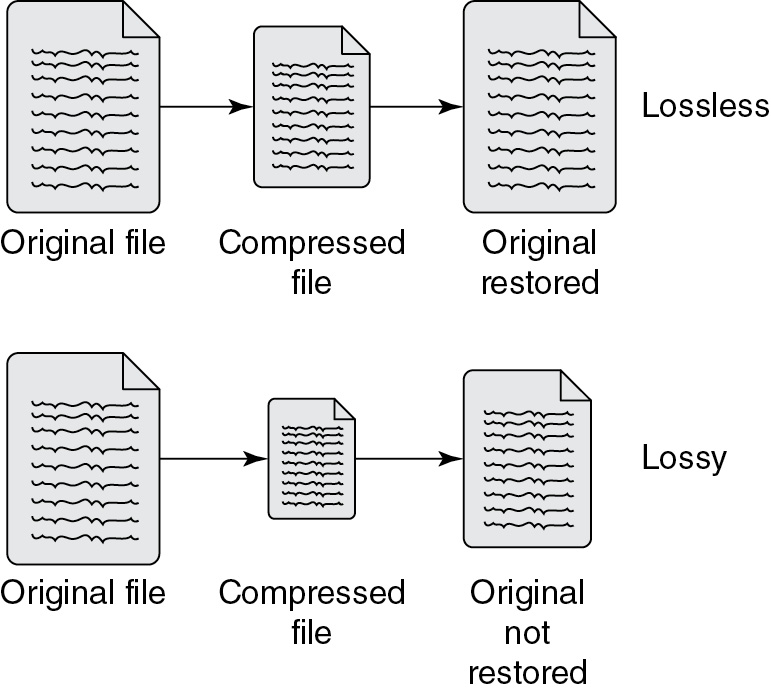
• Lossless compression techniques allow the original image to be restored. No data is lost, but the file size cannot be as compressed as with lossy techniques.
• Lossy compression techniques lose some data in the compression process. The original can never be restored, but the compression is greater than with lossless techniques.
Many compression techniques assign a code to each character, including numbers and special characters. Characters that appear more frequently get a shorter code; those that appear less frequently get a longer code. The larger the file, the greater the opportunity for a greater savings on file size. To illustrate, think of a song with verses and a refrain. The verses are usually unique while the refrain is the same and repeats after each verse. The refrain provides an opportunity for compression with fewer symbols needed to represent it.
If full file restoration is not required, then a lossy compression algorithm is best, especially when the data is quite large and will take a long time to transmit. If you need the file restored to its original resolution, then you must use a lossless compression program. For example, medical and financial data would need to use a lossless compression technique.
JPEG (Joint Photographic Experts Group) images reduce file sizes up to 90% by replacing similar colors with the same color in large parts of the image. The replacements generally cannot be detected by the human eye.
The same concepts apply for music and video files. There are lossy and lossless compression programs that can be used with these files. As with image files, the original file can be restored with the lossless technique but not with a lossy one.
Processing Data to Get Information
Computers and Data
So much raw data is being collected constantly in all fields. Every purchase you make, those you return, websites you visit—all involve data that businesses collect. But what does it mean? Computers enable us to process data to turn it into information for decision making and research. Computers can often identify patterns in data that individuals would not be able to detect. As is often the case, there are also trade-offs to consider with large amounts of data.
Data collected from all types of events—such as visits, searches, inquiries, orders, returns, temperatures, scores, attendees, acres planted, acres harvested, fish, birds, photos, videos, and audio files—are considered to be raw data. These are all just values and descriptions until we make sense of it. While humans can usually do an adequate job on small amounts of data, there is no way we could process the vast amounts of data now collected in many raw datasets. We get tired, distracted, and bored, and then errors occur or opportunities are missed. Computers were made for this!
How Computers Help Process Data
People often enter data differently. This is almost a given if different people enter it. When I fill out a form, for my address, sometimes I use “Road” and other times I abbreviate it as “Rd.” Atlanta has multiple streets with “Peachtree” in the name. If someone leaves off street, road, drive, and so on, the data is incomplete and inaccurate. Sometimes I make typos but don’t see them until I’ve already hit “Enter”—if I see them at all. Sometimes data comes in from multiple sources or locations and needs to be combined. Data needs to be consistent for patterns to emerge and insights identified. There are programs created to make these minor changes that will make the data consistent but not change the meaning of it for future analysis.
• Cleaning: One area computers are very helpful with is “cleaning” the data. This includes removing corrupt data, removing or repairing incomplete data, and verifying ranges or dates. Removing or flagging invalid data is very useful. Cleaning data can also change values such as “dr.” to “Drive” for consistency. Again, individuals could easily miss errors in the data, which could cause incorrect results in later processing.
• Filtering: Computers are also able to easily “filter” data. This means that different subsets can be identified and extracted to help people make meaning of the data. For example, all temperature values greater than 98.6 could be meaningful and need further processing or perhaps just a count of how many there are in the entire dataset might be useful.
• Classifying: Additionally, computers can help make meaning of large datasets by grouping data with common features and values. These groupings or classifications would be based on criteria provided by people who need to work with the data. There could be single or multiple criteria used for these groupings. These would depend on the reason that the data was collected.
• Bias: This can unintentionally be present in data. It occurs when the data collected does not represent all the possibilities in the pool of available options. For example, the census used to not have an option to check for multiracial individuals, so people had to choose one. This would potentially overrepresent the population of some races and underrepresent others. Prior data was biased with no way to identify when it occurred or a way to correct it. Bias in data does not go away by collecting larger amounts of data to analyze.
• Patterns: The data analysis starts with a hypothesis or question to check. The data is then processed using this criteria to see if patterns emerge. Computers are able to identify patterns in data that people are either unable to recognize or cannot process enough data to see the pattern. This process is known as “data mining.” New discoveries and understandings are often made this way. When new or unexpected patterns emerge, the data has been transformed into information for people to begin to interpret. Computers make processing huge amounts of data possible so people can make sense of it. Machine learning is related to data mining, but it uses the data to make predictions. Through these predictions, actions can be programmed to occur when certain criteria are met, making it appear that the device has “learned” how to react or perform. This is how artificial intelligence (AI) works.
Correlations
Be cautious about correlations between data values. A correlation may not mean one thing caused the other. Always do further research with data from additional sources, not just more data from the same source, to prove the relationship exists. There is a website where the author, Tyler Vigen, correlates margarine consumption with the divorce rate in Maine and civil engineering degrees with mozzarella cheese consumption. These make the point—they may correlate, but one is not caused by the other! Take a few minutes and explore some of the funny examples.
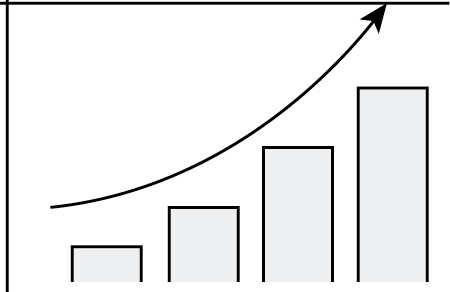
Scalability
Scalability is the ability to increase the capacity of a resource without having to go to a completely new solution, and for that resource to continue to operate at acceptable levels when the increased capacity is being added. This means you do not have to bring the entire system down to add new resources. Everything already in place keeps operating normally, and new resources are added without impacting routine processing. The increase should be transparent to anyone using the resource. For example, processing should not slow down as the amount of data increases when solutions are scalable. In the case of data, the resource would be additional servers to store and process the data. Scalability is an important aspect to be able to store and process large datasets. These files cannot fit on our computers or most organizations’ servers. Parallel computing systems may be needed to process these large datasets. See the Big Idea 4 chapter on computing systems and networks for more information about parallel systems.
The “cloud” is considered a scalable resource. People connect, store, share, and communicate across the Internet. As traffic or demand for resources increases, the cloud service manages the demand by providing additional resources such as servers. Networks can also provide scalability. As more devices are added to the network, network managers increase access points and other devices to accommodate the additional network devices and traffic.
Scalability also includes the ability to downsize as needed, again without impacting the storage or processing.
Metadata
Metadata is data that describes data and can help others find the data and use it more effectively. It is not the content of the data, but includes information about the data such as:
• Date
• Time stamp
• Author/owner
• File size
• File type
Changing, adding, or deleting metadata does not impact or change the actual data in any way. It allows us to organize and add structure to our data in addition to making it easier to find. Metadata includes “tags” that are used to identify the content. These tags enable web searches to find the data more easily. Multiple tags about a file are useful to help people find it with their search criteria. When you are adding anything to the web, think carefully about the tags you provide. Think about ways you would search for information like yours. The more tags the better, because we all think in different ways and our search criteria will be different, but we all are looking for the best outcomes to our searches.
How People Work with Computers to Process Data
We have the data cleaned and organized. Now it’s time to process it! Software tools such as spreadsheets and databases can be used to filter, organize, and search the data. Search tools and filtering systems are needed to help analyze the data and recognize patterns. You are not required to know details about a specific tool. Programs can repeat and reframe data in the search for patterns. Sometimes data may be transformed, which might be extracting specific sections from data, such as age, or doubling values to see if a trend occurs. It could mean eliminating negative values from a subset used for analysis. Sometimes it’s a calculation such as averages. For example, clothing businesses can get an awareness of what colors and sleeve lengths to order and sell in certain parts of the country during certain times of the year.

Sharing and Communicating Information
What did your analysis find? All of the work collecting and processing the data leads to this! Sharing the results and effectively communicating them is the next step. After data has been cleaned and organized, it needs to be reported and represented in ways so people can easily view it. There are many tools available to aid in communicating the insights identified from the data to others. Graphics in the form of charts, tables, and other designs are useful to present data in a visual format and in a summary format. Remember the phrase, “A picture paints a thousand words”? Use it. The human brain is wired to process information visually, so the use of images and other visual tools are effective ways to convey a message to help others understand it. Offering ways for others to interact with the data, such as providing sound files or videos when someone selects an option, is also useful. There are many apps and digital tools to present the information in an inviting and engaging format.

Identifying patterns and insights is a lot like sifting through the sand and dirt and then finding gold flakes or nuggets. To an organization, data converted to knowledge or information is like gold!

![]() Review Questions
Review Questions
Concepts
1. Which data compression technique provides the most compression?
(A) Lossy
(B) Lossless
(C) Filtering
(D) Classification
2. Which of the following best describes abstraction?
(A) Adding complexity so the concept can apply to more uses
(B) Simplifying complexity to make the concept more general
(C) Combining procedures to make a new one
(D) A set of instructions to do a task
3. Why is cleaning data important?
(A) It ensures incomplete data does not hide or skew results.
(B) It removes bad data.
(C) It repairs incomplete data.
(D) All of the above.
4. If analyzing data indicates a company should only hire people with a college degree because they stay at the company longer, what is this a potential indication of?
(A) Good data management practices leading to good hiring practices
(B) Frequency analysis to identify commonalities in the data
(C) Bias in collecting the data
(D) Data assessment and inquiry of hiring practices
5. What is one way in which number systems are abstract?
(A) The same amount can be represented by different number representations.
(B) A number can be best represented by one number system.
(C) Symbols can not be used to add, subtract, multiply, or divide them in their abstract form.
(D) They use constants.
6. Why is analyzing data with computers important?
(A) To identify patterns that humans cannot see
(B) To increase the viability of server farms
(C) To verify existing solutions to problems
(D) To test due diligence
7. What is the number system used by computers?
(A) Base 10 (decimal)
(B) Base 8 (octal)
(C) Base 2 (binary)
(D) Base 16 (hexadecimal)
8. When does an overflow error occur?
(A) When the computer runs out of memory to store program instructions
(B) When the flow of binary digits reaches a broken pathway and cannot arrive at its destination
(C) When an integer requires more bits to represent it than the programming language provides
(D) When the numerator in a calculation is larger than the denominator
9. What is information about the author of a document considered to be?
(A) Metadata
(B) Content
(C) Context
(D) Mididata
10. What is the amount of data compression an algorithm can produce reliant upon?
(A) No repeating parts of the file being compressed
(B) Several patterns in the data
(C) A large file size
(D) A small file size
11. How can an organization begin the process of analyzing data?
(A) By following an iterative development process
(B) By establishing measurements the data should show
(C) By developing hypotheses and questions to test
(D) By checking to see if the data matches previously collected data
12. What is 21410 in binary?
(A) 11010100
(B) 11010110
(C) 11010111
(D) 01101011
13. What is a reason to perform additional research on correlations found through data analysis?
(A) There may not be an actual cause-and-effect relationship between the correlation variables.
(B) A single source may not provide enough data for a conclusion.
(C) To understand the relationship between the variables.
(D) All of the above.
14. The letter “M” is represented by 01001101 in binary. What is this in decimal?
(A) 414
(B) 76
(C) 77
(D) 1101
15. Metadata is used to
(A) provide updates to the data.
(B) help find and organize data.
(C) brand the data.
(D) sort the data.
16. Which number type is stored imprecisely in memory?
(A) Integers
(B) Numbers with decimals
(C) Both
(D) Neither
17. When is sampling needed?
(A) Sampling is used to store analog data.
(B) Sampling is used to approximate real-world data.
(C) Sampling is used when converting from digital data to analog data.
(D) Sampling is used when converting from analog data to digital data.
18. An example of metadata about sea turtle nests could be
(A) number of eggs in the nest.
(B) location of the nest.
(C) number of incubation days.
(D) tracking number assigned to the nest.
19. Being able to add or remove resources to store large datasets is called
(A) scalability.
(B) filtering.
(C) efficiency.
(D) routing.
Application of Concepts
20. Data compression algorithms are used when the data
(A) needs to be shared with a large number of people.
(B) needs to be kept secure.
(C) is too large to send in a timely manner.
(D) needs to be sent a large physical distance away.
21. How many more bits are available if you go from a 32-bit computer to a 64-bit machine?
(A) Twice as many
(B) 32 more
(C) 232 more
(D) 322 more
22. Your program is comparing temperatures to determine how many patients have a fever. Your selection statement’s condition is not working correctly when the variable patient_temp is 98.6. What could be one reason why?
IF (patient_temp = 98.6)
(A) The format is incorrect for this condition.
(B) A round-off error occurred.
(C) An overflow error occurred.
(D) The test condition is invalid.
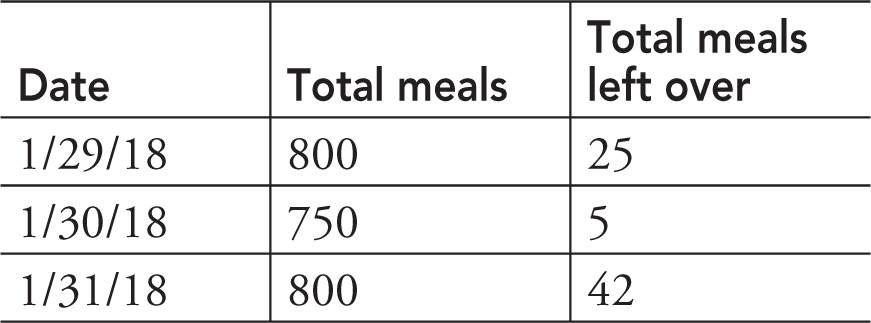
23. Given a table of lunchroom leftovers, what can be determined from the data?
(A) Most popular items
(B) Days of field trips when classes missed lunch
(C) Days with high absenteeism
(D) Amount of wasted budget dollars
24. A company purchases a large block of data from a social media site. If they want to analyze the data to learn more about potential customers, what techniques should they use?
(A) Simulations to test different hypotheses about what data could be present
(B) Data analysis to identify patterns and relationships in the data for further analysis
(C) Maximization to get the highest return on their purchase of the data
(D) Data processing to use the data with existing company software to see if it will run on their systems or if new ones will need to be developed
25. What order should these be in to go from smallest to largest?
1. Binary—01110111
2. Decimal—111
3. Binary—01111011
(A) 1, 2, 3
(B) 2, 1, 3
(C) 3, 1, 2
(D) 3, 2, 1
26. A magnet school wants to advertise its students’ success taking AP exams to prospective families. What’s the best method to share the summarized data?
(A) Post an image of student results on social media sites.
(B) Create an interactive pie chart that can drill down to topics and overall scores posted on the school’s website.
(C) Write a report for a marketing pamphlet.
(D) Send an e-mail to families with middle-school-age children.
27. Which topic needs the use of programs to analyze the data to identify insights?
(A) The average number of students who drive to school each day
(B) The record of wins and losses for all sports teams under their current coaches compared to prior years’ win/loss records
(C) The number of library books in a school district that need to be replaced each year
(D) The standardized test scores for current students compared to test scores across the country for the past decade
28. A school district wants to analyze the data about their high school graduates who attend local community colleges. What information can the school district obtain from the following data that the school has available?
Student name
Number of students in the graduating class by high school
High school graduation year
Student self-reported plans for after high school
Total numbers from local community colleges of enrolled students and their high school
Total number of local community college students enrolled in each degree program
(A) Average number of in-state students who enrolled in a local community college
(B) If the number of local graduates who enroll in a local community college is increasing, decreasing, or stable
(C) Number of local high school students who graduate from a local community college
(D) Popular degree programs in the community colleges
![]() Answers and Explanations
Answers and Explanations
1. A—Lossy data compression provides the most compression. Filtering and classification are not data compression techniques.
2. B—Abstraction means simplifying and taking away details to make something more general and flexible.
3. D—Data needs to be cleaned to remove or repair corrupt or incomplete data to ensure valid data is used for research and analysis.
4. C—This represents bias in that if a company historically mainly hired people with college degrees, then the data being analyzed would show that they stayed with the company longer because of higher numbers overall.
5. A—Number systems are abstract because the same amount can be represented by different number representations, such as binary, decimal, or hexadecimal.
6. A—Analyzing data allows us to identify patterns that could help solve problems or identify new possibilities that people likely could not process.
7. C—Computers use the binary or base 2 number system consisting of 0s and 1s.
8. C—An overflow error occurs when a number needs more bits to hold it than the programming language provides. Think of it like a three-position odometer reaching 999. At the next mile, it should read 1,000, but it cannot store a number that large. Instead, it rolls over to 1, which is an invalid representation of the mileage.
9. A—Information about the author of a document is metadata or data about the data.
10. B—Algorithms can provide a larger percentage of compression when there is repetition in the data, such as sections with repeating patterns. The entire pattern can be represented by one character or symbol in the compressed result. While larger data files are more likely to have these patterns, it’s not a guarantee, and smaller datasets can also have repeating sequences.
11. C—Developing hypotheses and questions and testing these with the data helps gain insight and knowledge about it.
12. B—21410 is 11010110 in binary.
13. D—Each of these is a reason to perform additional research and analysis to validate the correlation.
14. C—010011012 = 77
(01001101)2 = (0 × 28) + (1 × 27) + (0 × 26) + (0 × 25) + (1 × 24) + (1 × 23) + (0 × 22) + (1 × 21) + (1 × 20) = (77)10
15. B—Metadata helps organize and tag data so that it can more easily be found.
16. B—Integers, or whole numbers, are stored precisely. Real numbers with a decimal and fractional part are stored imprecisely in computer memory.
17. D—Sampling is used to convert analog data to digital by taking samples of the analog data at intervals to create a digital representation of those values.
18. D—Data about the data would be the tracking number for the nest. The other values are details about the nest itself.
19. A—Scalability is adding or removing resources to store and process large datasets.
20. C—Compression techniques are used when data is too large to send in ways such as an attachment to an e-mail or when it would take too long to send it in its original, expanded form.
21. C—The computer increases from 232 to 264 bits. Therefore, the increase is 232 bits.
22. B—A round-off error occurred. If the variable patient_temp contained 98.6, it could be stored in memory imprecisely as 98.5555559. The selection statement is then comparing 98.5555559 to 98.6, so the condition is false, when it is expected to be true.
23. D—While answers B and C hint at the cause, you cannot tell for sure from the table data. You can take the number of meals left over and multiply it by the cost of each meal to determine the budget dollars lost.
24. B—Data analysis is the transformation of data to identify patterns and connections. Companies can then use the data to identify business opportunities to take advantage of or threats to avoid.
25. B—The binary number 01110111 converts to 119 in decimal. The binary number 01111011 converts to 123. Therefore, the decimal number is smallest, then the first binary number in #1, then the second binary number in #3.
26. B—Prospective families will likely check the school’s website for additional information. Therefore, an interactive pie chart can provide high-level information and drill down to more information when sections of the pie are selected. Social media accounts may not reach all families, and a marketing pamphlet cannot provide as much information or the drill-down ability. Sending a mass e-mail may be flagged as spam, and families may not open an e-mail from an unexpected source.
27. D—The test scores compared to all other scores for the prior decade will be a large dataset. Searching for correlations between current student data and prior data is a task that needs programs to process the data. The other options will have exact numbers on manageable-sized datasets that a person could identify manually or by using a local computer for processing.
28. B—With the high school graduation year along with the community college enrollment numbers plus the students’ high schools, the school district can determine if the number of their high school graduates who enroll in local community colleges is increasing, decreasing, or stable over time.
![]() Rapid Review
Rapid Review
Data is being generated all the time, around us and by us, through sensors, mouse clicks, camera clicks, recordings, buttons pressed, and screens swiped, among many other ways. This data can provide valuable information to various interested parties but only after it has been processed by computers. Then, the data can be analyzed to see what new information can be extracted.
Computers, at their lowest level, use binary numbers, 0 and 1, to represent everything. Therefore, a sequence of binary numbers could represent an object such a number, color, sound, image, or instruction. Computer programs are written to interpret the sequence based on what they need.
Numbers are an abstraction to represent “how many.” Different number systems such as decimal and binary, express “how many” in different representations. These number representations can be converted to other number systems. Round-off errors can occur due to how the decimal portion of numbers are stored in computers. Real numbers are not stored precisely in computer memory. This means 1.0 could be stored as 0.9999998, resulting in round-off errors. Programming languages may have a set number of bits that can represent integers. Attempts to use more bits to represent a number result in an overflow error.
Analog data has continuous values and creates a smooth curve as values change. Digital data uses only 0s and 1s and approximates analog data by using samplings of the analog values.
Transmitting data to and from locations creates a concern around how to send such large amounts of data. Compression techniques, both lossy and lossless, were created and use algorithms to decrease the original file size to make transmission and storage easier. Lossless techniques enable the original file to be restored, while lossy techniques create smaller files, but the original file cannot be restored.
Metadata is identifying data about data, such as date and time created and owner of the data. When metadata is used effectively to organize and tag data, searches can successfully find what the person needs.
Humans cannot process large datasets manually. Computers must be used to help find the patterns, trends, and connections the data provide. There are tools, such as spreadsheets and databases, to store the data and then run queries to identify features of the data. Big data is too large to use standard processing tools and needs scalable solutions that can seamlessly add more resources as the data grows to store and process it.
Processing raw data includes activities such as cleaning and filtering data. It can also include classifying the data into various groupings. These activities can help identify patterns in the data that can then provide valuable information. Once data has been processed and analyzed into information, it needs to be communicated to other interested groups. Visual representations can effectively communicate the findings and can be done through tables, diagrams, charts, summary representations, or interactive displays.
All materials on the site are licensed Creative Commons Attribution-Sharealike 3.0 Unported CC BY-SA 3.0 & GNU Free Documentation License (GFDL)
If you are the copyright holder of any material contained on our site and intend to remove it, please contact our site administrator for approval.
© 2016-2026 All site design rights belong to S.Y.A.