CCNP Security FIREWALL 642-618 Official Cert Guide (2012)
Chapter 16. Traffic Analysis Tools
This chapter covers the following topics:
• Testing Network Connectivity: This section covers the ping and traceroute commands, which you can use to test connectivity and reachability.
• Using Packet Tracer: This section covers a method to trace virtual packets through a Cisco ASA to verify which actions will be taken by a variety of security features.
• Using Packet Capture: This section explains how you can capture actual packets as they pass through ASA interfaces.
Sometimes, you might want to verify connectivity from an ASA to some other device or how an ASA and its security features will behave when certain packets arrive. You might also want to know what sort of traffic has passed through an ASA to reach a certain host or why packets are not being forwarded through the ASA. The ASA offers the following traffic analysis tools that you can use:
• Ping: A test is sent from an ASA interface toward a destination, as a test to see whether the destination is reachable and will send a reply.
• Traceroute: A packet is sent from an ASA interface toward a destination, in an effort to discover each router hop along the path.
• Packet Tracer: A simulated packet is sent through the ASA security features, as a test to see whether the packet will be forwarded or not.
• Packet Capture: Packets passing through an interface and matching given conditions are captured in a buffer and can be displayed later.
Most likely, these tools will be covered in the CCNP FIREWALL exam, so you should be familiar with their functions and use.
“Do I Know This Already?” Quiz
The “Do I Know This Already?” quiz allows you to assess whether you should read this entire chapter thoroughly or jump to the “Exam Preparation Tasks” section. If you are in doubt about your answers to these questions or your own assessment of your knowledge of the topics, read the entire chapter. Table 16-1 lists the major headings in this chapter and their corresponding “Do I Know This Already?” quiz questions. You can find the answers in Appendix A, “Answers to the ‘Do I Know This Already?’ Quizzes.”
Table 16-1. “Do I Know This Already?” Section-to-Question Mapping
Caution
The goal of self-assessment is to gauge your mastery of the topics in this chapter. If you do not know the answer to a question or are only partially sure of the answer, you should mark that question as wrong for purposes of the self-assessment. Giving yourself credit for an answer you correctly guess skews your self-assessment results and might provide you with a false sense of security.
1. Which ASA command can be used as a test to verify that a host is reachable via ICMP and TCP from an ASA interface? (Choose one.)
a. ping
b. traceroute
c. test
d. icmp permit
e. tcp permit
2. By default, what protocol does an ASA use in its traceroute probe packets? (Choose one answer.)
a. ICMP echo request
b. ICMP echo reply
c. UDP port 65535
d. UDP port 33434
e. UDP port 171
3. Which one of the following is the most correct statement about the Packet Tracer ASA feature?
a. Packet Tracer displays packets that are received on an ASA interface.
b. Packet Tracer uses traceroute packets to trace a path through the network.
c. Packet Tracer uses a virtual packet to trace the path through the ASA functions.
d. Packet Tracer injects real packets into the protected network.
4. Which one of the following describes the type of traffic that can be tested with Packet Tracer?
a. An HTTP connection between two hosts
b. Only ICMP echo (ping) packets
c. A stream of RTP packets
d. A single virtual packet
5. Which of the following represent ASA functions that can be tested with Packet Tracer? (Choose all that apply.)
a. Routing table lookup
b. Network address translation entries
c. Host connection limits
d. Access list results
e. All of these answers are correct.
6. Which of the following packet parameters can be configured with Packet Tracer? (Choose all that apply.)
a. Number of packets to send
b. Protocol
c. Source IP address and port number
d. Destination IP address and port number
e. QoS information (IP ToS and DSCP)
7. How does an ASA determine which interface to use when a virtual packet is injected as part of a Packet Tracer test?
a. It uses the source IP address found in the virtual packet.
b. It performs a reverse path forwarding (RPF) lookup.
c. You must specify the ingress interface.
d. The virtual packet is injected into all configured and connected interfaces.
8. Suppose the following command is entered to perform a packet capture:
ciscoasa# capture data
Which of the following answers correctly describes the data that will be captured?
a. All packets moving through all active interfaces.
b. No packets; an access list has not yet been defined.
c. No packets; an interface has not been specified.
d. Only packets entering an interface.
9. Suppose the following commands have been entered on an ASA:
ciscoasa(config)# access-list MYACL extended permit ip any host 192.168.3.4
ciscoasa# capture MYDATA access-list MYACL interface outside
Which of the following correctly describes the resulting actions?
a. Only packets destined for inside host 192.168.3.4 will be captured on the outside interface.
b. Only packets destined for outside host 192.168.3.4 will be captured on the outside interface.
c. Only packets destined for host 192.168.3.4 will be captured and forwarded; the implicit “deny” statement in the access list will drop all other packets, preventing them from being forwarded.
d. No packets will be captured because the access list has not been applied to the ASA interface.
10. By default, how many bytes of data can a capture buffer contain?
a. An unlimited number
b. 128 KB
c. 512 KB
d. 1 MB
11. Suppose a capture session named MYCAPTURE has been configured to capture packets on the outside interface. Which one of the following commands should you use to stop the running capture so that you can view the buffer contents?
a. ciscoasa# clear capture MYCAPTURE
b. ciscoasa# no capture MYCAPTURE
c. ciscoasa# capture MYCAPTURE pause
d. ciscoasa# no capture MYCAPTURE interface outside
12. Which of the following answers best describes the purpose of the following command:
ciscoasa# capture outside type asp-drop shunned
a. You want to capture and shun packets on the outside interface.
b. You want to capture packets that have been shunned, regardless of the interface.
c. You want to capture packets that have been shunned only on the outside interface.
d. You want to capture packets in a capture buffer in the asp-drop format.
Foundation Topics
After you have configured an ASA to become part of a network, you might need to do some simple testing to verify that it can reach other devices successfully. Once you have configured it to protect a network with security policies, it isn’t always easy to verify that the policies have been configured correctly. For example, you might read through the modular policy framework (MPF) and access list configurations and mentally work through the operations. If the configuration is complex, you might miss something. You might also depend on users to report connections getting dropped or applications not working.
You might also need to gain some visibility into the traffic that is coming into or going out of an ASA interface. Without a dedicated external network analyzer or “sniffer,” how can you view and verify packets that arrive or leave the ASA?
This chapter discusses each of these topics in detail and presents ASA features that you can use to validate how traffic will be handled and view traffic in motion.
Testing Network Connectivity
When you have connected and configured ASA interfaces and the necessary IP routing information, you might want to verify that the ASA can reach other parts of the network. You can use the ping command to send test packets from the ASA toward a destination to make sure that the destination is reachable. The destination might be something as simple as the next-hop router, which would verify that the ASA can reach devices on its local subnet. You might also test destinations further away, to see if the intervening network path is up and functioning.
To start a ping test, use the following command syntax:
ciscoasa# ping [if_name] destination [data pattern] [repeat count] [size bytes] [timeout seconds] [validate]
At the least, you can specify only the destination IP address or hostname. If you do not specify an interface name, the ASA will use a route lookup to determine which of its interfaces will source the ping packets. Example 16-1 shows the results of two ping commands with minimal arguments. The first command is successful, where an exclamation mark denotes each successful reply. The second command is not; each ping packet was not returned from the destination, as denoted by question marks.
Example 16-1. Using the ping Command to Test Reachability
ciscoasa# ping 209.165.200.225
Type escape sequence to abort.
Sending 5, 100-byte ICMP Echos to 209.165.200.225, timeout is 2 seconds:
!!!!!
Success rate is 100 percent (5/5), round-trip min/avg/max = 1/1/1 ms
ciscoasa#
ciscoasa# ping 209.165.200.228
Type escape sequence to abort.
Sending 5, 100-byte ICMP Echos to 209.165.200.228, timeout is 2 seconds:
?????
Success rate is 0 percent (0/5)
ciscoasa#
You can also use the data keyword to specify a 16-bit hexadecimal data pattern to be sent in the ICMP packet payload, the repeat keyword to specify the number of ICMP packets to send (default 5), the size keyword to specify the packet size (default 64 bytes), the timeout keyword to set the number of seconds to wait for each ICMP packet to be returned (default 2 seconds), and the validate keyword to validate each reply packet that is received.
If you use the ping command without any other arguments, the ASA will prompt for each one, as shown in Example 16-2. Default values are shown within square brackets. You can type the Enter key to accept a default.
Example 16-2. Using the ping Command Alone to Prompt for Arguments
ciscoasa# ping
Interface: outside
Target IP address: 209.165.200.225
Repeat count: [5]
Datagram size: [100]
Timeout in seconds: [2]
Extended commands [n]: y
Verbose? [no]:
Validate reply data? [no]:
Data pattern [0xabcd]:
Sweep range of sizes [n]:
Type escape sequence to abort.
Sending 5, 100-byte ICMP Echos to 209.165.200.225, timeout is 2 seconds:
!!!!!
Success rate is 100 percent (5/5), round-trip min/avg/max = 1/1/1 ms
ciscoasa#
By default, an ASA will permit any inbound ICMP packets to terminate on and be answered by any of its interfaces. For example, a host on a public network could successfully ping the ASA’s outside interface to determine that the ASA is alive or that it exists. You can use the icmp command to control what ICMP traffic is allowed to reach an ASA interface. You can specify the source IP address and mask, an optional ICMP Type field, and the ASA interface name where ICMP packets are received, as follows:
ciscoasa(config)# icmp {permit | deny} ip_address mask [icmp_type] if_name
The icmp_type field can be one of the following keywords or numeric values: echo-reply (0), unreachable (3), echo (8), time-exceeded (11).
Suppose you want to prevent hosts from being able to ping the ASA itself on its outside interface. You could use the following command to keep the ASA from responding to pings:
ciscoasa(config)# icmp deny any outside
Even though it might be tempting to deny all inbound ICMP traffic, you might also be blocking some ICMP packet types that are necessary for networking functions. For example, ICMP unreachable (type 3) packets are used by the Path MTU Discovery function to determine what MTU size can be used along a network path for a VPN connection. You could permit ICMP unreachables and deny all other types with the following commands:
ciscoasa(config)# icmp permit any unreachable outside
ciscoasa(config)# icmp deny any outside
Beginning with ASA release 8.4(1), you can leverage the ping tcp command to test TCP reachability. The ASA will attempt to open a new TCP connection by sending a TCP SYN to the destination host. If the destination is reachable and agreeable, it will reply with a SYN. At that point, the ASA will send a TCP RST to reset the connection and repeat the process if further repeats are necessary.
Use the following command syntax:
ciscoasa# ping tcp [if_name] destination [port]] [repeat count] [source address
port] [timeout seconds]
You can specify the source ASA interface, the destination, the destination TCP port, the repeat count, a source address and TCP port, and a timeout value. In Example 16-3, the ASA is testing TCP reachability to destination 209.165.201.199 at TCP port 25.
Example 16-3. Using the ping tcp Command to Test TCP Reachability
ciscoasa# ping tcp outside 209.165.201.199 25
Type escape sequence to abort.
No source specified. Pinging from identity interface.
Sending 5 TCP SYN requests to 209.165.201.199 port 25
from 209.165.200.227, timeout is 2 seconds:
!!!!!
Success rate is 100 percent (5/5), round-trip min/avg/max = 1/1/1 ms
ciscoasa#
Ping tests can show whether a destination is reachable or not, but they don’t provide any information about the path that the test packets took to reach the destination. You can use the traceroute command to test the path from the ASA to the destination, on a hop-by-hop basis.
Traceroute sends a sequence of probe packets toward the destination. The first probe has its time-to-live (TTL) set to one; at the first router hop, the TTL is decremented and expires, so that router returns an ICMP time-exceeded packet to the ASA. The ASA increments the TTL value in each successive probe packet so that routers located at increments along the path will make themselves known too. In this way, the ASA is able to trace the path toward the destination one hop at a time.
The traceroute command has the following syntax:
ciscoasa# traceroute destination [port number][numeric][probe probe_num][source
source] [timeout seconds][ttl ttl_min ttl_max][use-icmp]
By default, probe packets are sent using UDP port 33434. You can use the port keyword to use a different UDP port instead, or you can use the use-icmp keyword to send ICMP echo request packets. You can also specify a source, and the timeout period that the ASA will wait for each probe to be answered. As each probe is answered, the ASA will attempt to resolve the name of the router through a DNS lookup, unless you specify the numeric keyword to display IP addresses only.
By default, the ASA will begin with a TTL value of one and will keep incrementing indefinitely. You can use the ttl keyword to specify the minimum and maximum TTL limits. The ASA will send three probes at each TTL increment by default. You can use the probe keyword to change the number of probes.
Example 16-4 shows a traceroute to destination 72.247.200.170. Two router hops have been discovered; beyond that point, the probe packets have been dropped. Undiscovered router hops are displayed with an asterisk.
Example 16-4. Using the traceroute Command to Discover a Network Path
ciscoasa# traceroute 72.247.200.170 numeric
Type escape sequence to abort.
Tracing the route to 72.247.200.170
1 209.165.200.225 0 msec 0 msec 0 msec
2 192.168.254.6 0 msec 0 msec 0 msec
3 * * *
4 * * [Ctrl-c typed here]
ciscoasa#
Note
You can interrupt lengthy ping or traceroute processes on an ASA by entering an escape sequence of Ctrl-c.
Using Packet Tracer
After you have configured a variety of security features on an ASA, you might have a difficult time verifying that packets can move successfully from one interface to another. You might also want to verify that a specific security feature will block certain types of traffic.
You can use the Packet Tracer feature to verify many of the ASA security mechanisms, in the order that they are encountered as a packet moves from one ASA interface to another. A typical series of security features tested might look like the following:
• Flow lookup: Checks for existing xlate and conn entries
• UN-NAT: Checks for address translation entries
• Access list lookup: Checks for any applicable ACL entries
• IP options lookup: Checks handling of IP options in the ingress packet
• NAT: Checks the Reverse Path Forwarding (RPF) information
• NAT: Checks for host connection limits
• IP options lookup: Checks handling of IP options in egress packet
• Flow creation: Creates new xlate and conn entries, if needed
• Route lookup: Checks for a route to the destination address
The exact list of security features tested depends on the current ASA configuration. First, Packet Tracer takes a look at the running configuration to build the list of features, and then it carries out its tests on each feature. Packet Tracer doesn’t include tests from any of the ASA’s application inspection engines because only a single packet is used for the end-to-end test.

Packet Tracer uses a virtual or synthetic packet that is injected into the data stream on an ingress interface. The virtual packet is passed through each of the ASA functions, as if a real packet were being handled. This means that you will even see actual syslog information being generated on the ASA as the trace progresses. The ASA will remove the virtual packet once it is queued in the egress interface buffer for transmission so that it never appears on the network.
You can define many parameters about the virtual packet so that it will represent a typical real packet that might be encountered on the network.
You can use Packet Tracer from Cisco Adaptive Security Device Manager (ASDM) by selecting Tools > Packet Tracer. A new Packet Tracer window will appear, containing a string of symbols representing each ASA function that will be tested. Enter the following information to define the test packet:
• Choose the ingress interface, where the packet will enter the firewall; at the upper-left corner of the window, select an interface name from the drop-down menu.
• Select the Packet Type, either TCP, UDP, ICMP, or IP, from the list across the top of the window.
• Enter the Source IP Address and Source Port.
• Enter the Destination IP Address and Destination Port.
Click the Start button. Packet Tracer will animate a packet as it moves from function to function. When the trace is complete, the results will be shown in the bottom half of the window. Be aware that the animation causes the step-by-step progression to appear rather slowly. You can speed up the trace by unchecking the Show Animation check box.
As an example, suppose you have configured an ASA to permit HTTPS traffic from the public Internet to reach inside host 192.168.1.199, but all other traffic should be denied. Figure 16-1 shows the results of an HTTPS test packet that has passed each test, designated by green check marks in the Action column next to each successful phase.
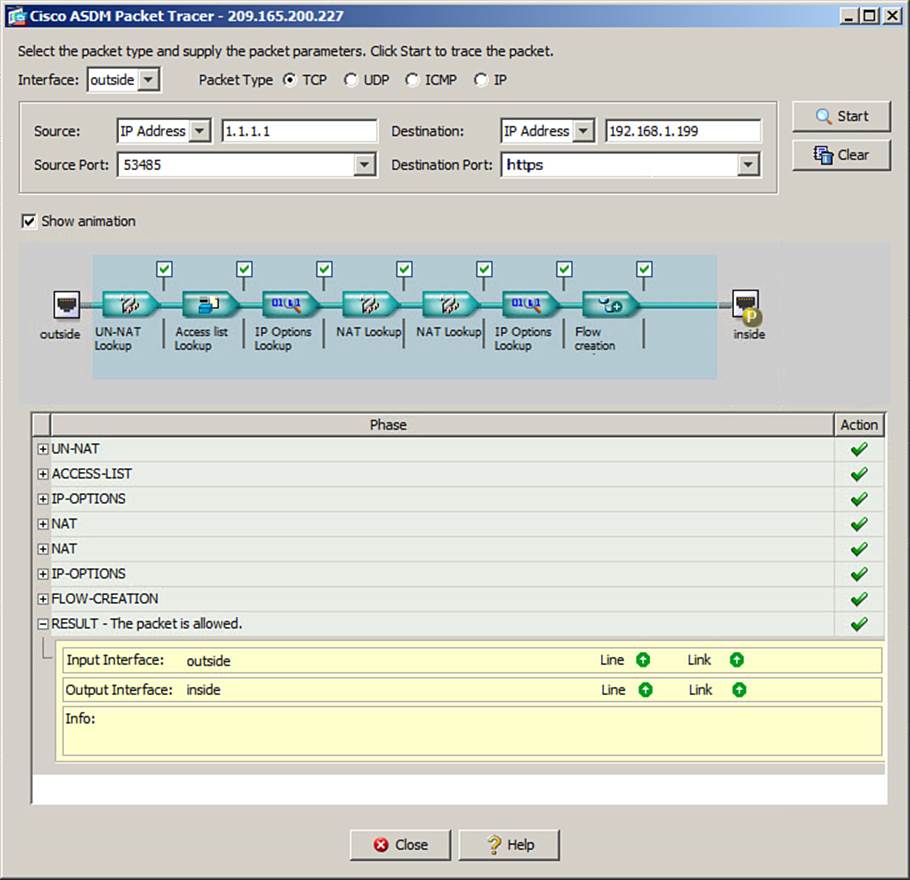
Figure 16-1. Using Packet Tracer in ASDM to Verify Successful Handling of a Packet
Figure 16-1 also shows that you can expand RESULT to see the ingress and egress interfaces, indicating that the packet is able to enter and exit the ASA. The outcome of each phase is shown in a collapsed list. You can click the plus sign next to any phase to see more detailed information about the test.
If the trace is not successful and the packet is dropped, you will see a red X symbol next to the phase that failed or denied the packet. As an example, Figure 16-2 shows the results of a Packet Tracer test using an HTTP packet. The access list has denied and dropped the HTTP packet, so a red X is shown next to the ACCESS-LIST test phase, as well as above the inside interface icon in the animation.
You can also use Packet Tracer from the command-line interface (CLI) by entering the following command:
ciscoasa# packet-tracer input src_interface protocol src_addr src_port dest_addr
dest_port [detailed] [xml]
You can add the detailed keyword to display more detailed information about packets that are dropped. By adding the xml keyword, the ASA will provide the Packet Tracer output in XML format.
Example 16-5 shows the command used to test with an HTTPS packet, while Example 16-6 shows the results of an HTTP packet test. Each phase of the Packet Tracer output represents one security feature or mechanism that is being tested. These examples show the same packet tests used in the ASDM Packet Tracer shown in Figures 16-1 and 16-2, respectively.
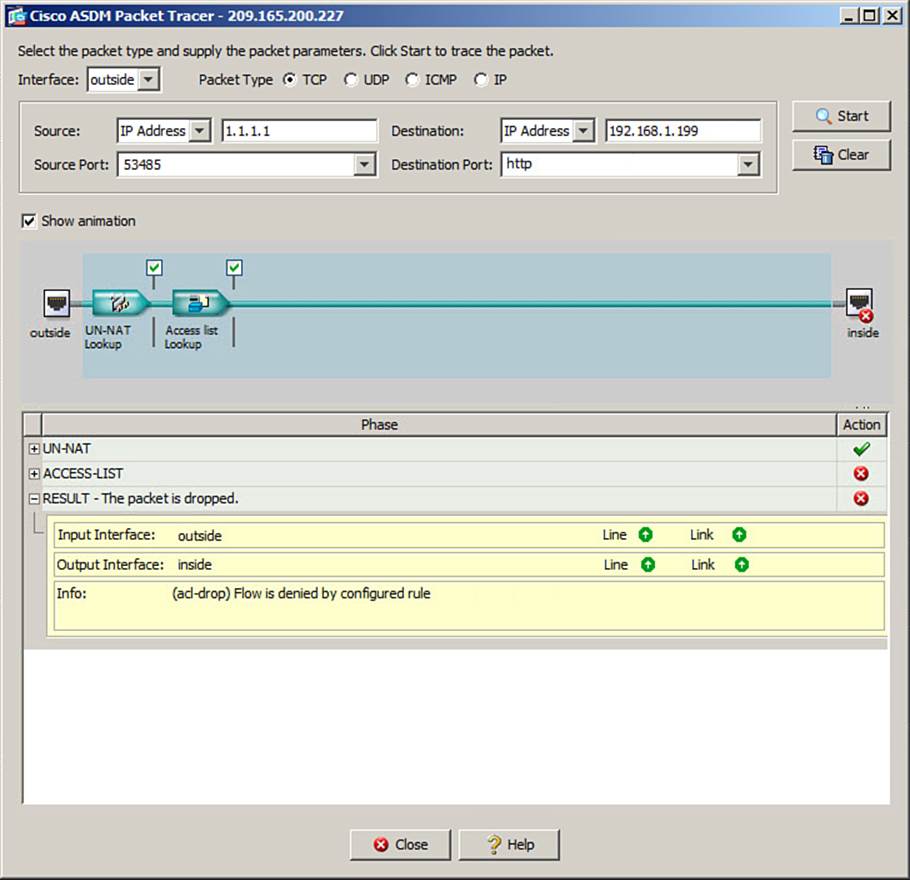
Figure 16-2. Using Packet Tracer in ASDM to Verify That a Test Packet Has Been Dropped
Example 16-5. Using Packet Tracer to Test ASA Rules for an Inbound HTTPS Packet
ciscoasa# packet-tracer input outside tcp 1.1.1.1 53485 192.168.1.199 https
Phase: 1
Type: UN-NAT
Subtype: static
Result: ALLOW
Config:
static (inside,outside) 192.168.1.199 192.168.1.199 netmask 255.255.255.255
match ip inside host 192.168.1.199 outside any
static translation to 192.168.1.199
translate_hits = 0, untranslate_hits = 5
Additional Information:
NAT divert to egress interface inside
Untranslate 192.168.1.199/0 to 192.168.1.199/0 using netmask 255.255.255.255
Phase: 2
Type: ACCESS-LIST
Subtype: log
Result: ALLOW
Config:
access-group OUTSIDE in interface outside
access-list OUTSIDE extended permit tcp any host 192.168.1.199 eq https
Additional Information:
Phase: 3
Type: IP-OPTIONS
Subtype:
Result: ALLOW
Config:
Additional Information:
Phase: 4
Type: NAT
Subtype: rpf-check
Result: ALLOW
Config:
static (inside,outside) 192.168.1.199 192.168.1.199 netmask 255.255.255.255
match ip inside host 192.168.1.199 outside any
static translation to 192.168.1.199
translate_hits = 0, untranslate_hits = 5
Additional Information:
Phase: 5
Type: NAT
Subtype: host-limits
Result: ALLOW
Config:
static (inside,outside) 192.168.1.199 192.168.1.199 netmask 255.255.255.255
match ip inside host 192.168.1.199 outside any
static translation to 192.168.1.199
translate_hits = 0, untranslate_hits = 5
Additional Information:
Phase: 6
Type: IP-OPTIONS
Subtype:
Result: ALLOW
Config:
Additional Information:
Phase: 7
Type: FLOW-CREATION
Subtype:
Result: ALLOW
Config:
Additional Information:
New flow created with id 48, packet dispatched to next module
Result:
input-interface: outside
input-status: up
input-line-status: up
output-interface: inside
output-status: up
output-line-status: up
Action: allow
ciscoasa#
Example 16-6. Using Packet Tracer to Test ASA Rules for an Inbound HTTP Packet
ciscoasa# packet-tracer input outside tcp 1.1.1.1 53485 192.168.1.199 http
Phase: 1
Type: UN-NAT
Subtype: static
Result: ALLOW
Config:
static (inside,outside) 192.168.1.199 192.168.1.199 netmask 255.255.255.255
match ip inside host 192.168.1.199 outside any
static translation to 192.168.1.199
translate_hits = 0, untranslate_hits = 9
Additional Information:
NAT divert to egress interface inside
Untranslate 192.168.1.199/0 to 192.168.1.199/0 using netmask 255.255.255.255
Phase: 2
Type: ACCESS-LIST
Subtype:
Result: DROP
Config:
Implicit Rule
Additional Information:
Result:
input-interface: outside
input-status: up
input-line-status: up
output-interface: inside
output-status: up
output-line-status: up
Action: drop
Drop-reason: (acl-drop) Flow is denied by configured rule
ciscoasa#
Using Packet Capture
To gain visibility into the traffic that is entering or exiting an ASA, you could use an external network protocol analyzer or packet sniffer—provided that it is connected to a network switch that can mirror traffic to it. A more convenient approach is to use the packet capture feature that is integrated into the ASA.
You can use the packet capture feature to collect a copy of packets as they enter and exit ASA interfaces. You can define one or more capture sessions on an ASA, each operating independently. Captured packets are stored in a memory buffer and can be viewed much like a protocol analyzer or sniffer trace. You can also copy the buffer contents onto an external device for viewing and analysis.
Using the Packet Capture Wizard in ASDM
You can also set up a packet capture in ASDM by using the Packet Capture Wizard. The wizard configures capture sessions that are identical to the capture command in the CLI, except that a GUI front end is used instead.
The Packet Capture Wizard sets up two separate capture sessions: one on an ingress interface and one on an egress interface. Each session captures traffic in both directions, collecting packets as they enter and exit the ASA.
To use the ASDM Packet Capture Wizard, choose Wizards > Packet Capture Wizard. A window describing the five steps of the wizard will appear, as shown in Figure 16-3. Click the Next button.
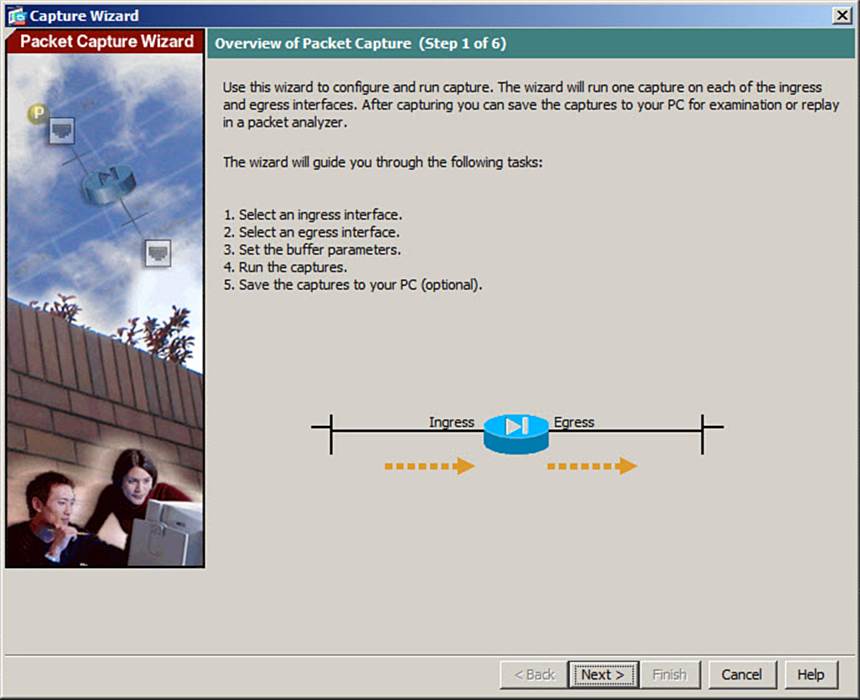
Figure 16-3. Initiating the Packet Capture Wizard in ASDM
Enter the ingress interface traffic information, as shown in Figure 16-4. This includes the ingress interface (inside in the example), source and destination addresses and subnet masks, and the protocol. In the example, all IP traffic will be captured. Click the Next button.
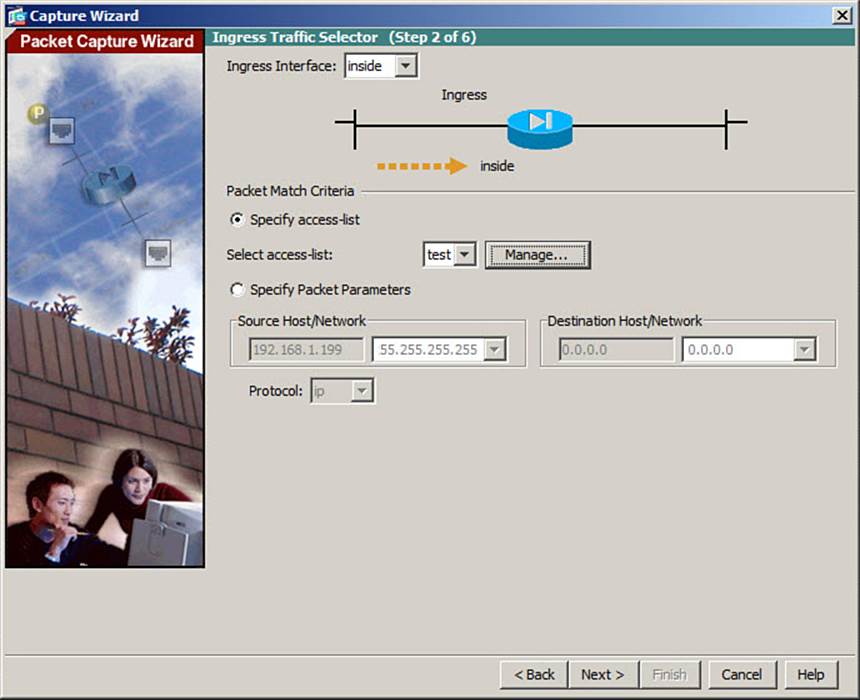
Figure 16-4. Configuring the Ingress Interface Capture Session
Enter the egress interface traffic information, as shown in Figure 16-5. This includes the egress interface (outside in the example) and the source and destination addresses and subnet masks. In the example, all IP traffic will be captured. Click the Next button.
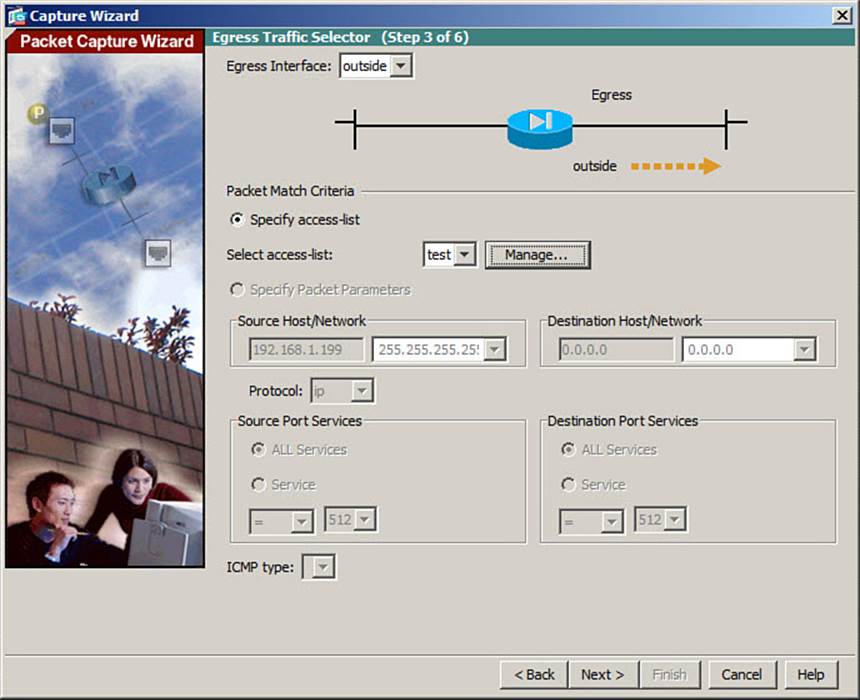
Figure 16-5. Configuring the Egress Interface Capture Session
Enter the capture buffer parameters, as shown in Figure 16-6. The maximum packet size (1522 in the example) and capture buffer size (524,288 bytes in the example) are given here. Check the Use Circular Buffer check box if you want the capture to use a circular buffer. By default, the capture will stop when the buffer is full. By default, you will manually tell the Packet Capture Wizard when to collect the capture buffer contents. Otherwise, you can check the Get Capture Every 10 Seconds check box to automatically fetch the buffers at regular intervals. Click the Nextbutton to continue.
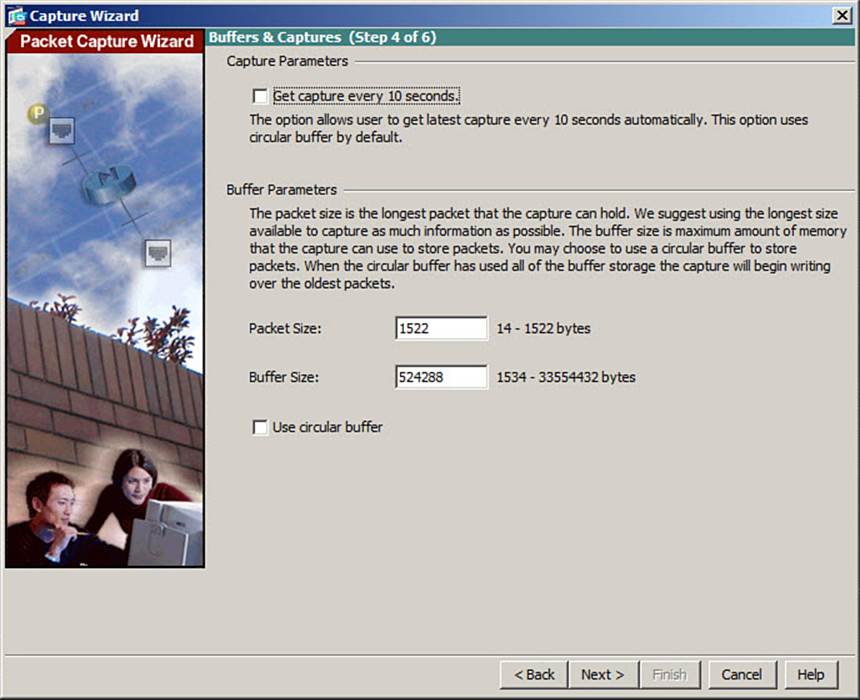
Figure 16-6. Configuring Capture and Buffer Parameters
A summary window will display, as shown in Figure 16-7. The summary shows all the CLI commands that ASDM will add to the ASA configuration to build the two packet capture sessions. Click the Next button to continue.
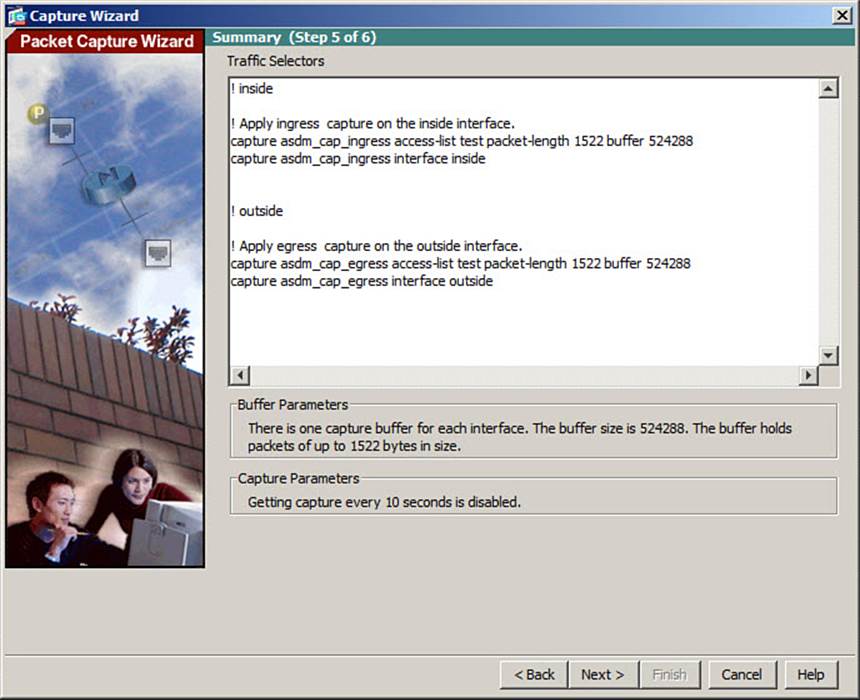
Figure 16-7. Reviewing the Capture Session Commands
Start the captures by clicking the Start button. If you have configured the capture to fetch the buffer contents every 10 seconds, packet headers will be shown in the Run Captures window automatically. Otherwise, the window will remain mostly empty while the capture is running; to see the capture buffer contents, click the Get Capture Buffer button, as shown in Figure 16-8.
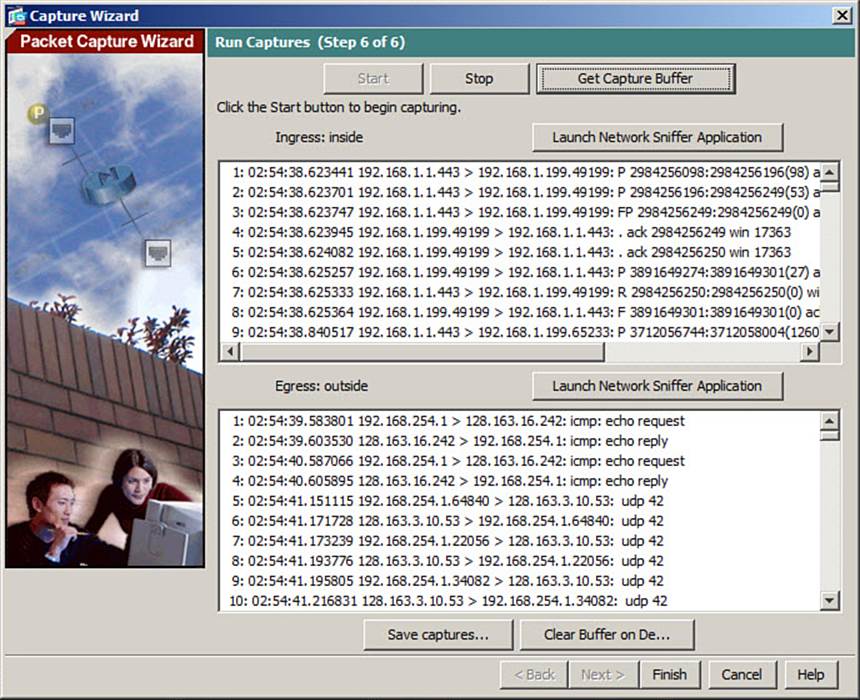
Figure 16-8. Displaying Capture Buffer Contents
The capture buffer for the ingress interface capture session is shown in the topmost box, while the egress interface session is shown in the bottom box.
You can save the capture buffers on your local PC by clicking the Save Captures button. Select ASCII to save the capture in plaintext, or PCAP to save it in a standard format that a network analyzer like Wireshark or OmniPeek can decode. Click Save Ingress Capture or Save Egress Capture to begin saving the capture buffer to a file on your local machine.
You can also load the capture directly into a network analyzer application by clicking the Launch Network Sniffer Application button. You should have a PCAP-compliant network analyzer application installed on your local machine. If you have problems getting ASDM to find the application, go to Tools > Preferences, and choose the location of the application’s startup file in the Network Sniffer Application box.
Capturing Packets from the CLI

While ASDM presents a streamlined approach to configuring a packet capture, you can use the CLI instead for more versatile control.
Begin by defining an access list that will be used to identify the traffic to be captured. You can set up a capture session that doesn’t use an access list at all, but it will capture all traffic passing through. The access list is used to flag packets for capture—not to permit or deny them from passing through the interface. Therefore, only the permit keyword is useful here. An implicit deny statement is at the end of the access list, which causes all other traffic to pass without being captured.
If you need to specify IP addresses or port numbers, you should use values that are relevant to any NAT or PAT configured on the ASA. For example, a capture session can monitor inbound traffic on an interface before NAT is performed, and it can monitor outbound traffic after NAT is performed.
Next, use the following command to define a capture session:
ciscoasa# capture session_name [interface {int_name | asa_dataplane | cplane}
[parameters]
By default, all packets moving through all ASA interfaces are captured. You should try to narrow the scope of the captured packets as much as possible so that only packets of interest are captured. You can specify the ASA interface name where the capture should take place.
If you need to capture packets that are passing internally between the ASA and an integrated security module, you can use the asa_dataplane keyword to capture data packets or the cplane keyword to capture control plane packets, respectively.
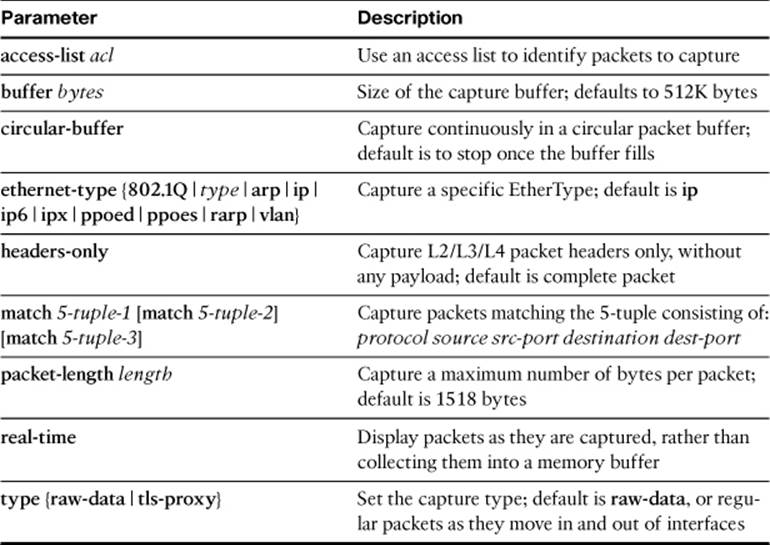
You can specify additional parameters, as listed in Table 16-2, to make the capture session more specific.
Table 16-2. Capture Session Parameters for the capture session_name Command
As an example, suppose you want to capture all packets that involve HTTPS connections with inside host 192.168.1.199, as they are seen on the outside ASA interface. Example 16-7 shows the configuration commands that can be used to define the capture access list and to define the capture session. Notice that the access list has two parts: one line permits HTTPS packets destined toward the server, and another line permits HTTPS packets coming from the server. In this way, the ASA will capture bidirectional traffic at the outside interface.
Example 16-7. Commands Used to Configure a Capture Session
ciscoasa(config)# access-list CAPTURE1 extended permit tcp any host 192.168.1.199
eq https
ciscoasa(config)# access-list CAPTURE1 extended permit tcp host 192.168.1.199 eq
https any
ciscoasa(config)# exit
ciscoasa# capture example access-list CAPTURE1 interface outside
In some situations, you might want to define several capture sessions. For example, you might want to use one capture session to capture packets on the outside interface, and use another capture session to capture packets on the inside interface. You can also assign multiple capture sessions to the same interface, each capturing a different subnet of traffic. Each capture session is independent and captures its own data in a separate capture buffer.
After you have defined a capture session, you need to monitor it for activity and retrieve the captured data. If you have defined several capture sessions, you might have trouble remembering which one is performing a certain function. You can list the current capture sessions with the show capture command. In Example 16-8, the ASA has three capture sessions defined: two bound to the outside interface and one bound to the inside interface.
Example 16-8. Displaying Capture Sessions
ciscoasa# show capture
capture example type raw-data access-list CAPTURE1 interface outside [Capturing -
229170 bytes]
capture cap-out type raw-data access-list CAPTURE2 interface outside [Capturing -
8721 bytes]
capture cap-in type raw-data interface inside [Buffer Full - 524080 bytes]
ciscoasa#
You can display the contents of a capture session buffer at any time, even if the capture is still active. To view the buffer contents from the CLI, you can use the following command:
ciscoasa# show capture session_name [access-list acl_name] {detail | dump | decode}
[packet-number packet] [count count]
A summary of each packet saved in the capture buffer named session_name is displayed, even though the capture session is still active. You can add the access-list keyword to use an ACL (defined ahead of time) as a display filter. Only packets that are permitted by the display filter access list are displayed.
By default, the decode keyword is assumed, displaying packets in an abbreviated form. Example 16-9 lists some of the packet contents from the capture session defined in Example 16-7.
Example 16-9. Displaying the Contents of a Packet Capture Session
ciscoasa# show capture example
1003 packets captured
1: 17:55:51.562150 192.168.1.199.443 > 10.4.1.2.35074: R
1521662497:1521662497(0) ack 2531877694 win 6422
2: 17:55:52.047665 10.4.1.2.35114 > 192.168.1.199.443: F
3066883736:3066883736(0) ack 1904075855 win 64051
3: 17:55:52.048520 10.4.1.2.35563 > 192.168.1.199.443: S
2049110290:2049110290(0) win 64512 <mss 1350,nop,nop,sackOK>
4: 17:55:52.051678 192.168.1.199.443 > 10.4.1.2.35114: . ack 3066883737 win 5123
5: 17:55:52.051846 192.168.1.199.443 > 10.4.1.2.35563: S 142125136:142125136(0)
ack 2049110291 win 3900 <mss 1300,sackOK,eol>
6: 17:55:52.052029 192.168.1.199.443 > 10.4.1.2.35114: F
1904075855:1904075855(0) ack 3066883737 win 5123
If the capture buffer is large, you can display only a subset of captured packets. Add the packet-number keyword to specify the first packet number to display, and the count keyword to specify the number of packets to display.
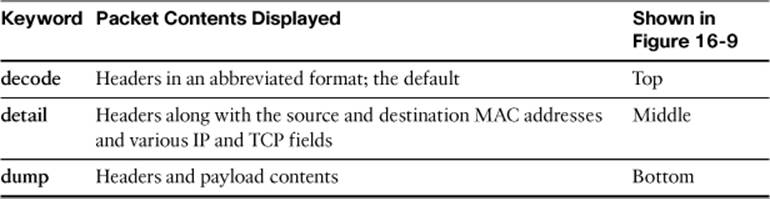
The show capture command can display packet contents in several formats, depending on which keyword is given. Table 16-3 lists the possible keywords, output formats, and corresponding examples in Figure 16-9.
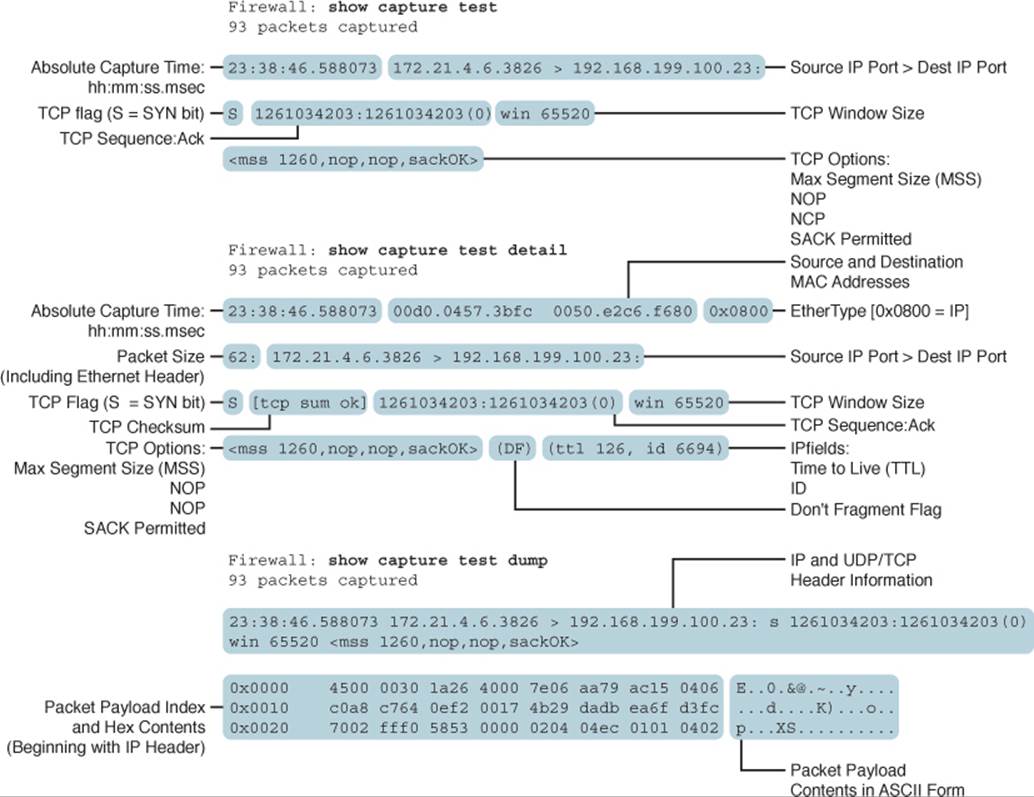
Figure 16-9. Examples of Different show capture Output Formats
Table 16-3. show capture Keywords and Output Formats
Controlling a Capture Session
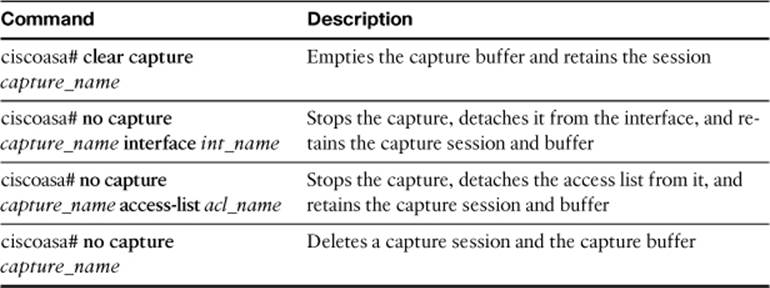
After a capture session is defined and activated, you might need to stop it as soon as some interesting data is captured. You might also want to clear the buffer so that new data can be captured in an empty buffer. When you are finished with a capture session, you need to delete it.
You can use the commands listed in Table 16-4 to control an existing capture session.
Table 16-4. Commands to Control a Data Capture Session
Copying Capture Buffer Contents
Sometimes you might find that viewing the contents of a capture buffer from a command-line interface becomes too cumbersome or confusing. This can happen when the capture buffer becomes very large—too large to navigate with CLI commands or display filters.
At other times, the capture buffer might contain useful information that deserves further review. For example, you might have a PC-based tool that can import captured data for viewing and analysis. You also might want to archive the capture buffer for future use.
You can copy a capture session to a TFTP server with the following command:
ciscoasa# copy capture: session-name tftp://server/path [pcap]
The entire buffer from the capture session named session-name is copied to the TFTP server at IP address server into the file and directory defined by path, which is relative to the TFTP server’s root directory. The resulting capture file contains the same text that is seen with the show capturecommand. You can also add the pcap keyword to save the capture buffer in the PCAP format, which can be imported into many network analysis tools.
With the following command, the capture session named bigtest is copied to the TFTP server at 192.168.254.10 as file bigtest in the TFTP root directory:
ciscoasa# copy capture:bigtest tftp://192.168.254.10/bigtest
You can also use a web browser to display a capture buffer as if you had used the show capture command. You also can download the capture buffer in PCAP format and save it as a file—all without leaving your web browser and without needing a TFTP server running on your PC.
First, enable the HTTP server on the ASA with the http server enable command. By doing this, HTTPS (TCP port 443) will be enabled by default. Be sure to allow your web browser’s IP address to access the ASA by entering the http ip-address command. Next, open a web browser to the following URL:
https://asa_address/capture/session_name[/pcap]
Figure 16-10 shows a capture session named test being viewed in a web browser. As soon as the capture buffer text is displayed in the web browser, you can save it as a file through your browser application.
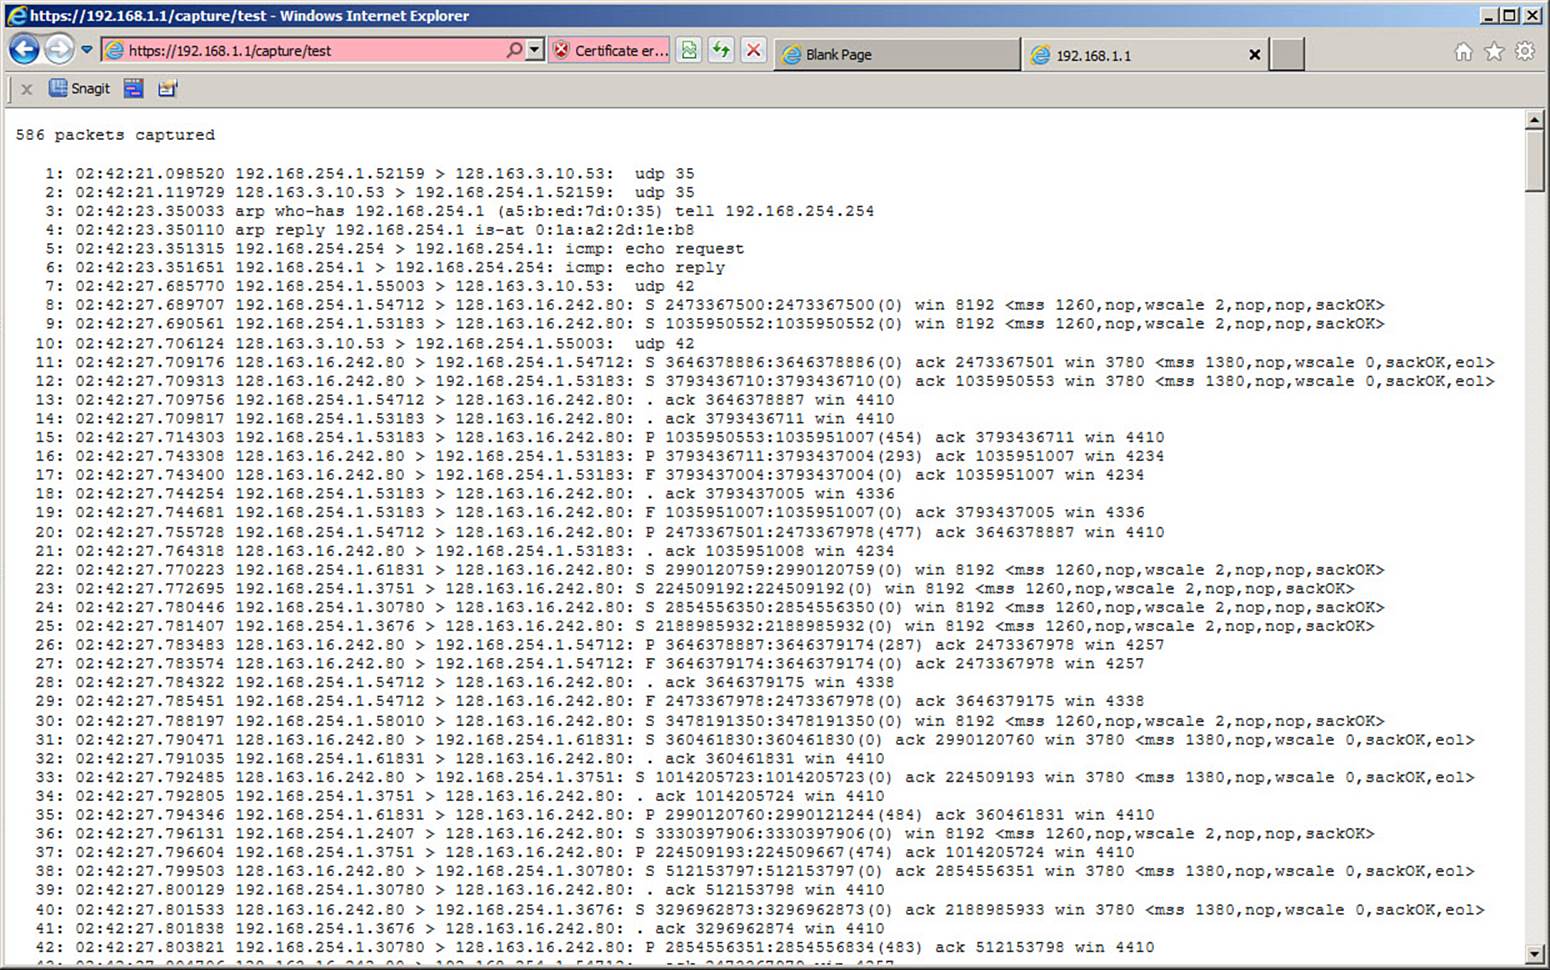
Figure 16-10. Using a Web Browser to Display the Contents of a Capture Buffer
You can also use the web browser to download the capture buffer as a file in PCAP format. To do this, add the /pcap keyword to the end of the URL. This time, the browser automatically fetches the capture file rather than displaying the capture text. As soon as you have the capture file downloaded in PCAP format, you can use a network analysis tool to examine and interpret the contents.
Capturing Dropped Packets
Suppose you use a packet capture and expect to see certain packets. However, for some reason, the packets don’t appear in the capture buffer. Perhaps the missing packets are being dropped for some reason, but the normal raw data packet capture doesn’t provide any helpful information.
The ASA offers a novel packet capture feature that can capture packets that are dropped internally, anywhere along the accelerated security path (ASP). This allows you to see which packets were dropped and the reason why. Because the ASP drop capture collects packets that are dropped by internal security features, the capture cannot be applied to any specific ASA interface.
You can use the following command syntax to define an ASP drop capture session:
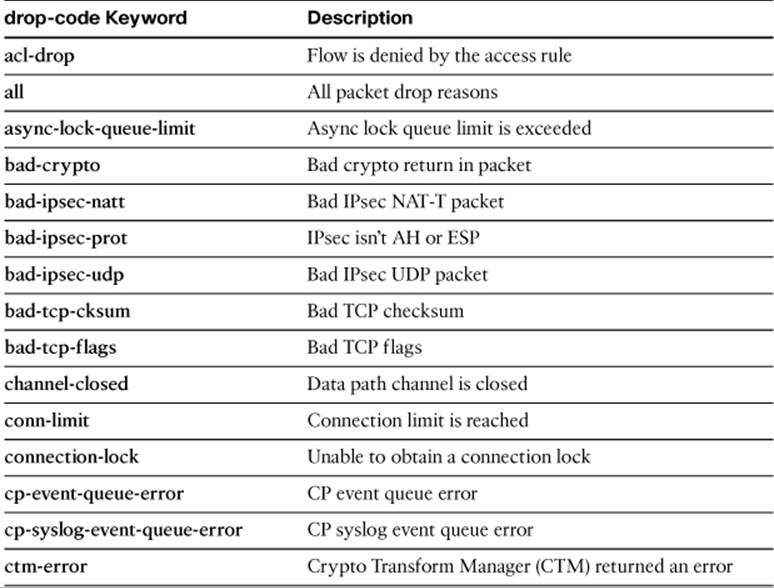
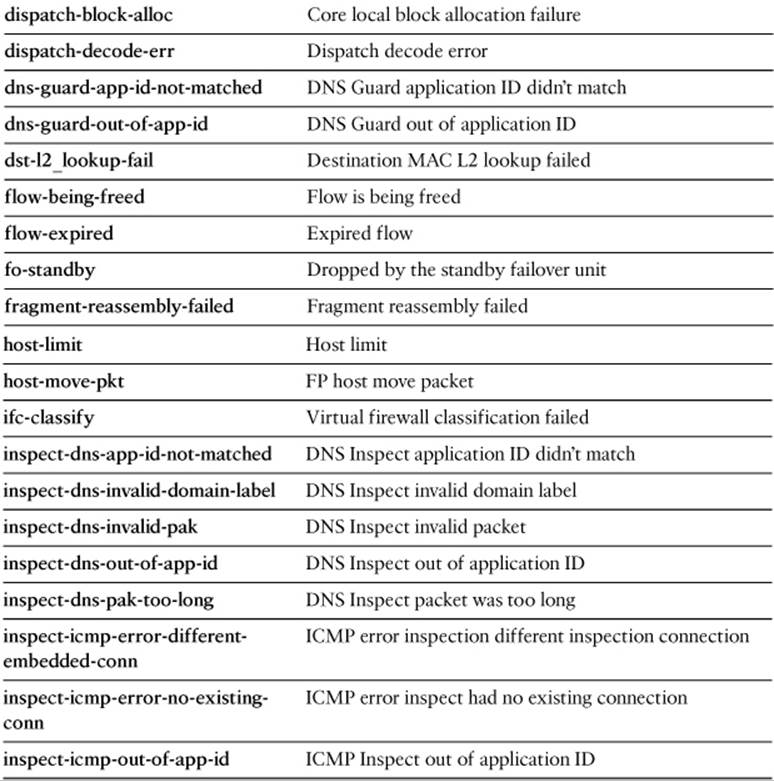
ciscoasa# capture session_name type asp-drop drop-code [parameters]
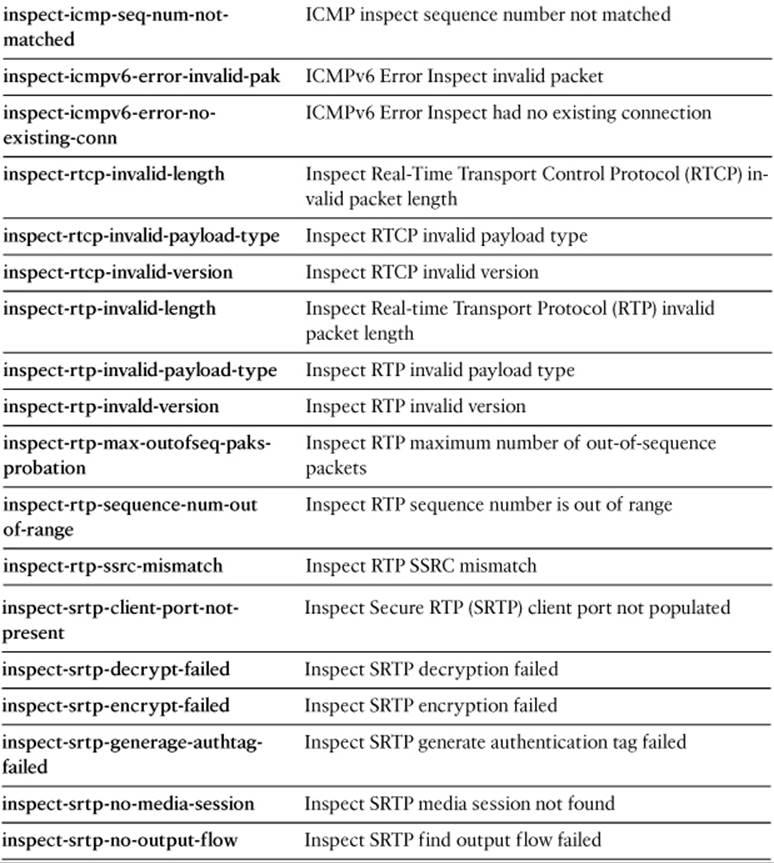
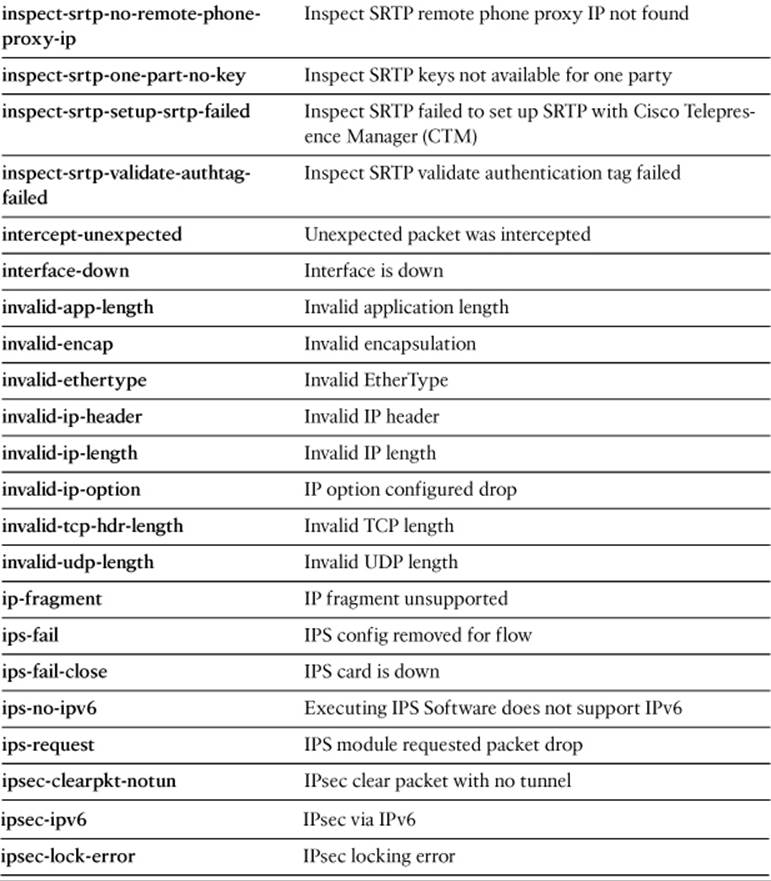
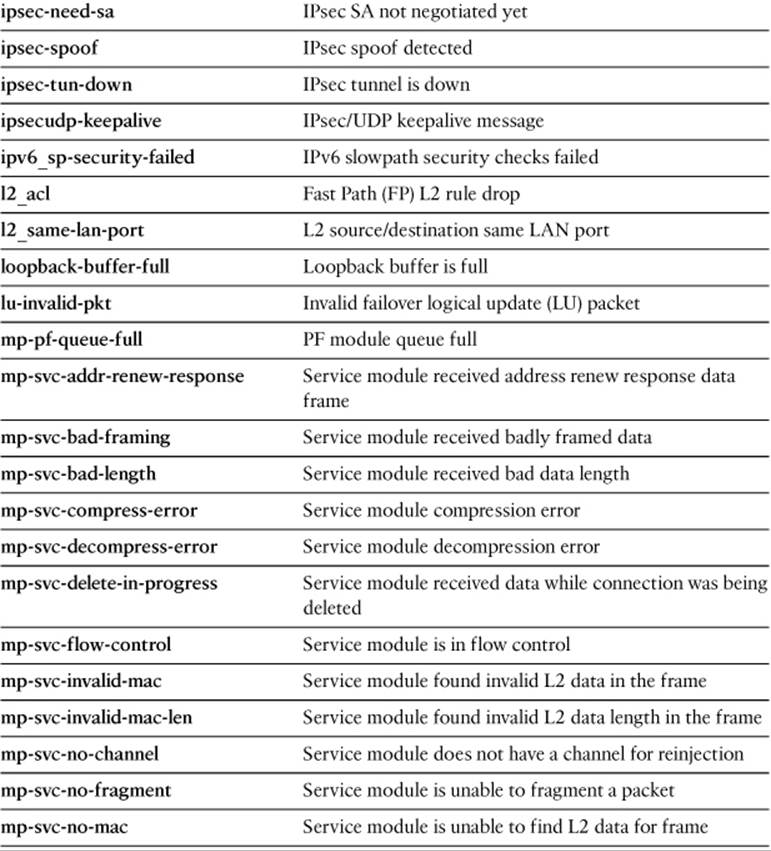
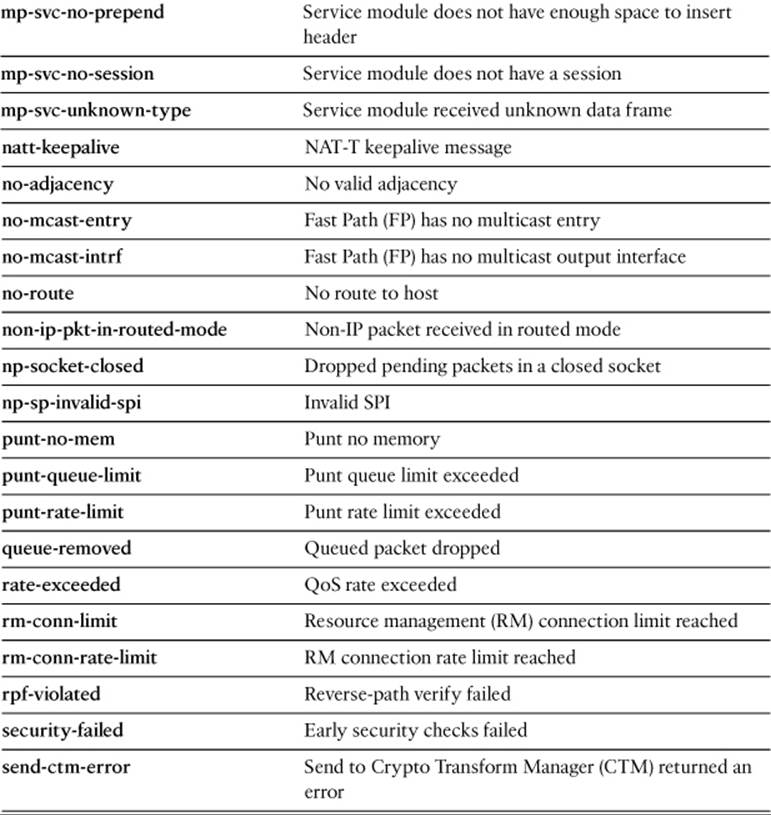
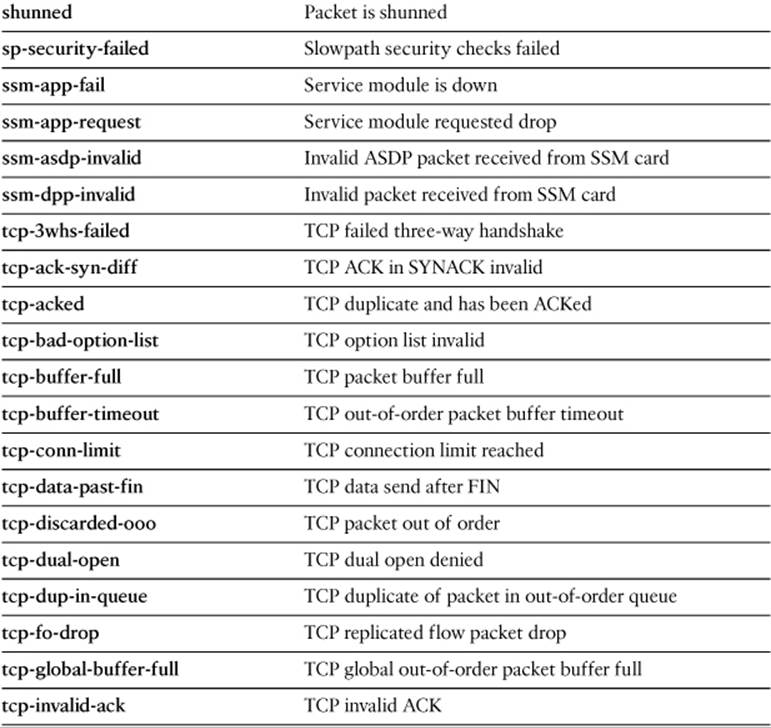
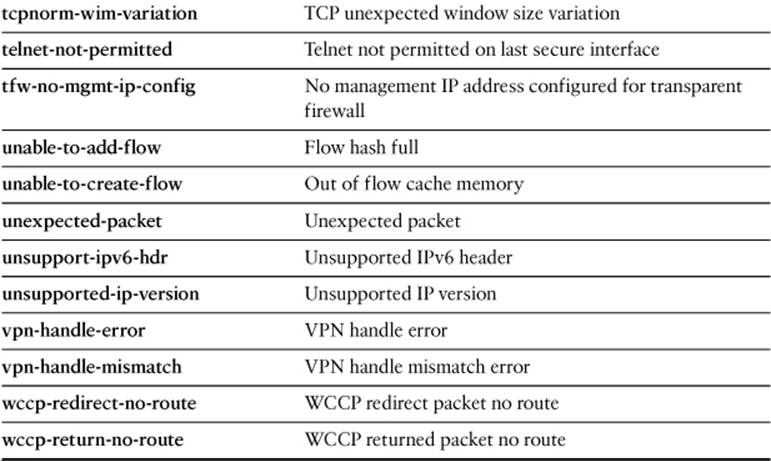
Specify one of the drop-code reason keywords listed in Table 16-5, as well as any other capture session parameters needed to narrow the packet capture.
Table 16-5. drop-code Keywords for the capture type asp-drop Command
In Example 16-10, a capture session has been created to collect all packets that have been dropped by any interface access list. Notice that the capture buffer lists the packet headers, but gives no specific information about which ACL dropped them.
Example 16-10. Capturing Dropped Packets Due to an Interface ACL
ciscoasa# capture ACL-DROPS type asp-drop acl-drop
ciscoasa# show capture ACL-DROPS
578 packets captured
1: 11:18:10.787984 209.63.99.134 > 192.168.1.30: icmp: net 66.213.244.62 unreachable
2: 11:18:13.910811 209.63.99.134 > 192.168.1.30: icmp: net 66.213.244.62 unreachable
3: 11:18:14.514835 96.17.157.62.3478 > 192.168.1.30.1032: udp 66
4: 11:18:29.092829 10.100.22.134.68 > 255.255.255.255.67: udp 300
5: 11:18:51.725762 66.220.147.33.80 > 192.168.1.30.19679: .
1457242373:1457242870(497) ack 428983025 win 4607
6: 11:19:03.121713 10.100.22.32.68 > 255.255.255.255.67: udp 300
7: 11:19:17.184270 10.100.20.201.32768 > 255.255.255.255.9900: udp 504
8: 11:19:37.721138 209.63.99.134 > 192.168.1.30: icmp: net 66.213.244.62 unreachable
Example 16-11 shows a different capture session that collects packets that are dropped because the first packet in a TCP connection is not a SYN. In this case, each initial packet had the FIN bit set.
Example 16-11. Capturing Dropped Packets Due to Unexpected TCP SYN
ciscoasa# capture TCP-SYN type asp-drop tcp-not-syn
ciscoasa# show capture TCP-SYN
6 packets captured
1: 11:08:14.674830 10.100.21.246.2400 > 74.125.113.103.80: F 2121766286:21217
66286(0) ack 1104027538 win 64365
2: 11:08:14.675151 10.100.21.246.2400 > 74.125.113.103.80: F 2121766286:21217
66286(0) ack 1104027538 win 64365
3: 11:08:14.784368 10.100.21.246.2320 > 74.125.113.103.80: F 1229347491:12293
47491(0) ack 2129350502 win 64365
4: 11:08:14.784947 10.100.21.246.2321 > 74.125.113.103.80: F 1791113785:17911
13785(0) ack 1674072656 win 64365
5: 11:08:17.534182 10.100.21.246.2401 > 74.125.113.103.80: F 92431968:9243196
8(0) ack 1601214786 win 64365
6: 11:08:19.159064 10.100.21.246.2400 > 74.125.113.103.80: F 2121766286:21217
66286(0) ack 1104027538 win 64365
6 packets shown
ciscoasa#
Combining Packet Tracer and Packet Capture
An ASA can gather Packet Tracer information about packets as they are captured, providing the best of both tools in one location. The capture session is configured normally, with the addition of the trace keyword. By default, Packet Tracer information will be collected for the first 50 packets that are captured and require inspection. You can add the trace-count keyword to specify the number of packets to trace, using the following command syntax:
ciscoasa# capture session-name trace [trace-count packets] [parameters]
You can display the capture buffer contents, along with the Packet Tracer results, by adding the trace keyword to the show capture command, as follows:
ciscoasa# show capture session-name trace
Example 16-12 shows the commands used to create a packet capture with packet tracing for 100 packets, as well as the results collected in the capture buffer.
Example 16-12. Adding Packet Tracer Information to a Packet Capture
ciscoasa# capture CAP-TRACE access-list HOSTS trace trace-count 100 interface outside
ciscoasa# show capture CAP-TRACE trace
1244 packets captured
1: 11:29:27.530261 192.168.103.30.21738 > 65.55.5.233.80: .
368454744:368455956(1212) ack 792630732 win 64512
Result:
Action: allow
2: 11:29:27.530459 192.168.103.30.21738 > 65.55.5.233.80: P
368455956:368456428(472) ack 792630732 win 64512
Result:
Action: allow
3: 11:29:27.584411 192.168.16.212.80 > 192.168.103.30.21849: S
864712665:864712665(0) ack 3416467652 win 3900 <mss 1300,sackOK,eol>
Phase: 1
Type: FLOW-LOOKUP
Subtype:
Result: ALLOW
Config:
Additional Information:
Found flow with id 2032063, using existing flow
Phase: 2
Type: ROUTE-LOOKUP
Subtype: output and adjacency
Result: ALLOW
Config:
Additional Information:
found next-hop 10.100.20.1 using egress ifc inside
adjacency Active
next-hop mac address 0000.0c07.ac00 hits 287316
Result:
Action: allow
4: 11:29:27.585006 192.168.103.30.21849 > 192.168.16.212.80: . ack 864712666
win 64512
Result:
Action: allow
Summary
By becoming familiar with the Packet Tracer and packet capture features, you can leverage these advanced tools to gain additional visibility into traffic movement within an ASA. Packet Tracer can provide insight into some “what if” scenarios to validate how a simulated packet will be handled. Packet capture can provide evidence of the actual packets that have passed into, passed out of, or been dropped by an ASA.
Exam Preparation Tasks
As mentioned in the section, “How to Use This Book,” in the Introduction, you have a couple of choices for exam preparation: the exercises here, Chapter 17, “Final Preparation,” and the exam simulation questions on the CD-ROM.
Review All Key Topics
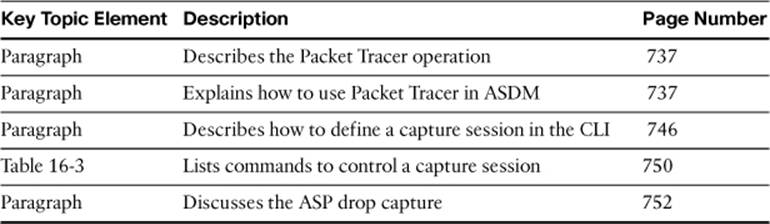
Review the most important topics in this chapter, noted with the Key Topic icon in the outer margin of the page. Table 16-6 lists a reference of these key topics and the page numbers on which each is found.
Table 16-6. Key Topics for Chapter 16
Command Reference to Check Your Memory
This section includes the most important configuration and EXEC commands covered in this chapter. It might not be necessary to memorize the complete syntax of every command, but you should be able to remember the basic keywords that are needed.
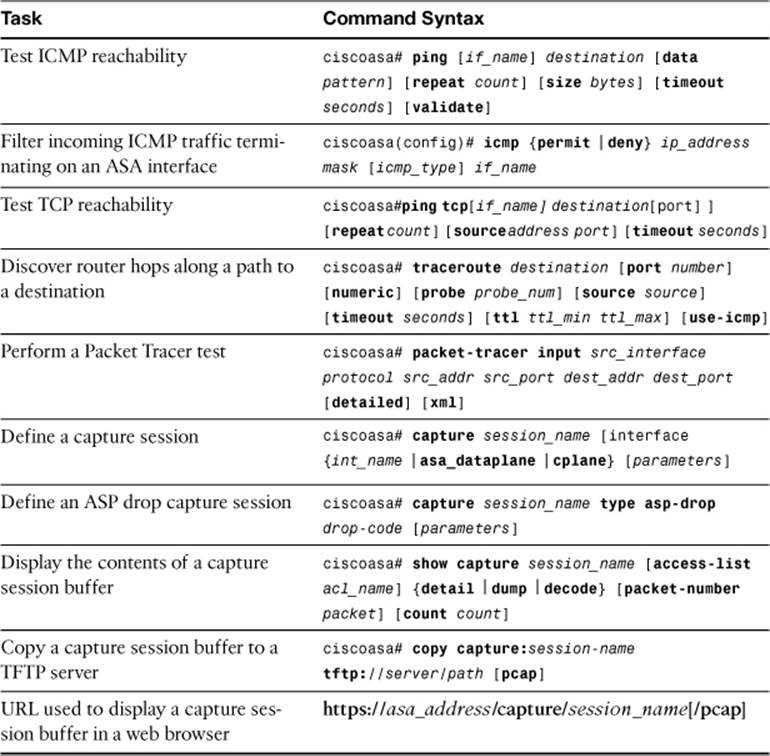
To test your memory of the commands, cover the right side of Table 16-7 with a piece of paper, read the description on the left side, and then see how much of the command you can remember.
Table 16-7. Commands Related to Traffic Analysis
The FIREWALL exam focuses on practical, hands-on skills that are used by a networking professional. Therefore, you should be able to identify the commands needed to configure and test an ASA feature.
All materials on the site are licensed Creative Commons Attribution-Sharealike 3.0 Unported CC BY-SA 3.0 & GNU Free Documentation License (GFDL)
If you are the copyright holder of any material contained on our site and intend to remove it, please contact our site administrator for approval.
© 2016-2026 All site design rights belong to S.Y.A.