Computer Organization and Design (2016)
Computer Abstractions and Technology
This chapter explains that although it is difficult to predict exactly what level of cost/performance computers will have in the future, it’s very probable that they will be much better than they are today. To participate in these advances, computer designers and programmers must understand a wider variety of issues, including factors such as power, reliability, cost of ownership, and scalability. While this chapter focuses on cost, performance, and power, it emphasizes that the best designs will strike the appropriate balance for a given market among all the factors. This chapter also discusses the Post-PC era, with personal mobile devices (PMDs) and tablets largely replacing desktop computers, and Cloud Computing and Warehouse Scale Computers (WSCs) taking over from the traditional server.
Keywords
power wall; uniprocessor; multiprocessor; Intel Core i7; desktop computer; server; supercomputer; datacenter; embedded computer; multicore microprocessor; systems software; operating system; compiler; instruction; assembler; assembly language; machine language; high-level programming language; input device; output device; liquid crystal display; active matrix display; motherboard; integrated circuit; chip; memory; dynamic random access memory; DRAM; dual inline memory module; DIMM; central processor unit; CPU; datapath; control; cache memory; static random access memory; SRAM; abstraction; instruction set architecture; architecture; application binary interface; ABI; implementation; volatile memory; nonvolatile memory; main memory; primary memory; secondary memory; magnetic disk; hard disk; flash memory; local area network; LAN; wide area network; WAN; vacuum tube; transistor; very large scale integrated circuit; VLSI; response time; execution time; throughput; bandwidth; CPU execution time; CPU time; user CPU time; system CPU time; clock cycle; clock period; clock cycles per instruction; CPI; instruction count; instruction mix; silicon; semiconductor; silicon crystal ingot; wafer; defect; die; yield; workload; benchmark; Amdahl’s law; million instructions per second; MIPS; cloud computing; mobile computing; cloud; mobile; personal mobile device; PMD; warehouse scale computer; WSC; Software as a Service; SaaS
Civilization advances by extending the number of important operations which we can perform without thinking about them.
Alfred North Whitehead, An Introduction to Mathematics, 1911
1.1 Introduction
1.2 Eight Great Ideas in Computer Architecture
1.3 Below Your Program
1.4 Under the Covers
1.5 Technologies for Building Processors and Memory
1.6 Performance
1.7 The Power Wall
1.8 The Sea Change: The Switch from Uniprocessors to Multiprocessors
1.9 Real Stuff: Benchmarking the Intel Core i7
1.10 Fallacies and Pitfalls
1.11 Concluding Remarks
![]() 1.12 Historical Perspective and Further Reading
1.12 Historical Perspective and Further Reading
1.13 Exercises
1.1 Introduction
Welcome to this book! We’re delighted to have this opportunity to convey the excitement of the world of computer systems. This is not a dry and dreary field, where progress is glacial and where new ideas atrophy from neglect. No! Computers are the product of the incredibly vibrant information technology industry, all aspects of which are responsible for almost 10% of the gross national product of the United States, and whose economy has become dependent in part on the rapid improvements in information technology promised by Moore’s Law. This unusual industry embraces innovation at a breath-taking rate. In the last 30 years, there have been a number of new computers whose introduction appeared to revolutionize the computing industry; these revolutions were cut short only because someone else built an even better computer.
This race to innovate has led to unprecedented progress since the inception of electronic computing in the late 1940s. Had the transportation industry kept pace with the computer industry, for example, today we could travel from New York to London in a second for a penny. Take just a moment to contemplate how such an improvement would change society—living in Tahiti while working in San Francisco, going to Moscow for an evening at the Bolshoi Ballet—and you can appreciate the implications of such a change.
Computers have led to a third revolution for civilization, with the information revolution taking its place alongside the agricultural and the industrial revolutions. The resulting multiplication of humankind’s intellectual strength and reach naturally has affected our everyday lives profoundly and changed the ways in which the search for new knowledge is carried out. There is now a new vein of scientific investigation, with computational scientists joining theoretical and experimental scientists in the exploration of new frontiers in astronomy, biology, chemistry, and physics, among others.
The computer revolution continues. Each time the cost of computing improves by another factor of 10, the opportunities for computers multiply. Applications that were economically infeasible suddenly become practical. In the recent past, the following applications were “computer science fiction.”
■ Computers in automobiles: Until microprocessors improved dramatically in price and performance in the early 1980s, computer control of cars was ludicrous. Today, computers reduce pollution, improve fuel efficiency via engine controls, and increase safety through blind spot warnings, lane departure warnings, moving object detection, and air bag inflation to protect occupants in a crash.
■ Cell phones: Who would have dreamed that advances in computer systems would lead to more than half of the planet having mobile phones, allowing person-to-person communication to almost anyone anywhere in the world?
■ Human genome project: The cost of computer equipment to map and analyze human DNA sequences was hundreds of millions of dollars. It’s unlikely that anyone would have considered this project had the computer costs been 10 to 100 times higher, as they would have been 15 to 25 years earlier. Moreover, costs continue to drop; you will soon be able to acquire your own genome, allowing medical care to be tailored to you.
■ World Wide Web: Not in existence at the time of the first edition of this book, the web has transformed our society. For many, the web has replaced libraries and newspapers.
■ Search engines: As the content of the web grew in size and in value, finding relevant information became increasingly important. Today, many people rely on search engines for such a large part of their lives that it would be a hardship to go without them.
Clearly, advances in this technology now affect almost every aspect of our society. Hardware advances have allowed programmers to create wonderfully useful software, which explains why computers are omnipresent. Today’s science fiction suggests tomorrow’s killer applications: already on their way are glasses that augment reality, the cashless society, and cars that can drive themselves.
Classes of Computing Applications and Their Characteristics
Although a common set of hardware technologies (see Sections 1.4 and 1.5) is used in computers ranging from smart home appliances to cell phones to the largest supercomputers, these different applications have different design requirements and employ the core hardware technologies in different ways. Broadly speaking, computers are used in three different classes of applications.
Personal computers (PCs) are possibly the best known form of computing, which readers of this book have likely used extensively. Personal computers emphasize delivery of good performance to single users at low cost and usually execute third-party software. This class of computing drove the evolution of many computing technologies, which is only about 35 years old!
personal computer (PC)
A computer designed for use by an individual, usually incorporating a graphics display, a keyboard, and a mouse.
Servers are the modern form of what were once much larger computers, and are usually accessed only via a network. Servers are oriented to carrying large workloads, which may consist of either single complex applications—usually a scientific or engineering application—or handling many small jobs, such as would occur in building a large web server. These applications are usually based on software from another source (such as a database or simulation system), but are often modified or customized for a particular function. Servers are built from the same basic technology as desktop computers, but provide for greater computing, storage, and input/output capacity. In general, servers also place a greater emphasis on dependability, since a crash is usually more costly than it would be on a single-user PC.
server
A computer used for running larger programs for multiple users, often simultaneously, and typically accessed only via a network.
Servers span the widest range in cost and capability. At the low end, a server may be little more than a desktop computer without a screen or keyboard and cost a thousand dollars. These low-end servers are typically used for file storage, small business applications, or simple web serving (see Section 6.10). At the other extreme are supercomputers, which at the present consist of thousands of processors and many terabytes of memory, and cost tens to hundreds of millions of dollars. Supercomputers are usually used for high-end scientific and engineering calculations, such as weather forecasting, oil exploration, protein structure determination, and other large-scale problems. Although such supercomputers represent the peak of computing capability, they represent a relatively small fraction of the servers and a relatively small fraction of the overall computer market in terms of total revenue.
supercomputer
A class of computers with the highest performance and cost; they are configured as servers and typically cost tens to hundreds of millions of dollars.
terabyte (TB)
Originally 1,099,511,627,776 (240) bytes, although communications and secondary storage systems developers started using the term to mean 1,000,000,000,000 (1012) bytes. To reduce confusion, we now use the term tebibyte (TiB) for 240 bytes, defining terabyte (TB) to mean 1012 bytes. Figure 1.1 shows the full range of decimal and binary values and names.
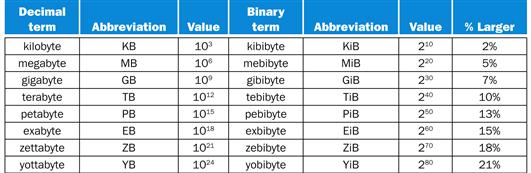
FIGURE 1.1 The 2X vs. 10Y bytes ambiguity was resolved by adding a binary notation for all the common size terms.
In the last column we note how much larger the binary term is than its corresponding decimal term, which is compounded as we head down the chart. These prefixes work for bits as well as bytes, so gigabit (Gb) is 109 bits while gibibits (Gib) is 230 bits.
Embedded computers are the largest class of computers and span the widest range of applications and performance. Embedded computers include the microprocessors found in your car, the computers in a television set, and the networks of processors that control a modern airplane or cargo ship. Embedded computing systems are designed to run one application or one set of related applications that are normally integrated with the hardware and delivered as a single system; thus, despite the large number of embedded computers, most users never really see that they are using a computer!
embedded computer
A computer inside another device used for running one predetermined application or collection of software.
Embedded applications often have unique application requirements that combine a minimum performance with stringent limitations on cost or power. For example, consider a music player: the processor need only be as fast as necessary to handle its limited function, and beyond that, minimizing cost and power are the most important objectives. Despite their low cost, embedded computers often have lower tolerance for failure, since the results can vary from upsetting (when your new television crashes) to devastating (such as might occur when the computer in a plane or cargo ship crashes). In consumer-oriented embedded applications, such as a digital home appliance, dependability is achieved primarily through simplicity—the emphasis is on doing one function as perfectly as possible. In large embedded systems, techniques of redundancy from the server world are often employed. Although this book focuses on general-purpose computers, most concepts apply directly, or with slight modifications, to embedded computers.
Elaboration
Elaborations are short sections used throughout the text to provide more detail on a particular subject that may be of interest. Disinterested readers may skip over an elaboration, since the subsequent material will never depend on the contents of the elaboration.
Many embedded processors are designed using processor cores, a version of a processor written in a hardware description language, such as Verilog or VHDL (see Chapter 4). The core allows a designer to integrate other application-specific hardware with the processor core for fabrication on a single chip.
Welcome to the PostPC Era
The continuing march of technology brings about generational changes in computer hardware that shake up the entire information technology industry. Since the last edition of the book we have undergone such a change, as significant in the past as the switch starting 30 years ago to personal computers. Replacing the PC is the personal mobile device (PMD). PMDs are battery operated with wireless connectivity to the Internet and typically cost hundreds of dollars, and, like PCs, users can download software (“apps”) to run on them. Unlike PCs, they no longer have a keyboard and mouse, and are more likely to rely on a touch-sensitive screen or even speech input. Today’s PMD is a smart phone or a tablet computer, but tomorrow it may include electronic glasses. Figure 1.2 shows the rapid growth time of tablets and smart phones versus that of PCs and traditional cell phones.
Personal mobile devices (PMDs)
are small wireless devices to connect to the Internet; they rely on batteries for power, and software is installed by downloading apps. Conventional examples are smart phones and tablets.
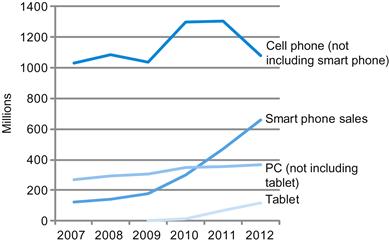
FIGURE 1.2 The number manufactured per year of tablets and smart phones, which reflect the PostPC era, versus personal computers and traditional cell phones.
Smart phones represent the recent growth in the cell phone industry, and they passed PCs in 2011. Tablets are the fastest growing category, nearly doubling between 2011 and 2012. Recent PCs and traditional cell phone categories are relatively flat or declining.
Taking over from the traditional server is Cloud Computing, which relies upon giant datacenters that are now known as Warehouse Scale Computers (WSCs). Companies like Amazon and Google build these WSCs containing 100,000 servers and then let companies rent portions of them so that they can provide software services to PMDs without having to build WSCs of their own. Indeed, Software as a Service (SaaS) deployed via the cloud is revolutionizing the software industry just as PMDs and WSCs are revolutionizing the hardware industry. Today’s software developers will often have a portion of their application that runs on the PMD and a portion that runs in the Cloud.
Cloud Computing
refers to large collections of servers that provide services over the Internet; some providers rent dynamically varying numbers of servers as a utility.
Software as a Service (SaaS)
delivers software and data as a service over the Internet, usually via a thin program such as a browser that runs on local client devices, instead of binary code that must be installed, and runs wholly on that device. Examples include web search and social networking.
What You Can Learn in This Book
Successful programmers have always been concerned about the performance of their programs, because getting results to the user quickly is critical in creating successful software. In the 1960s and 1970s, a primary constraint on computer performance was the size of the computer’s memory. Thus, programmers often followed a simple credo: minimize memory space to make programs fast. In the last decade, advances in computer design and memory technology have greatly reduced the importance of small memory size in most applications other than those in embedded computing systems.
Programmers interested in performance now need to understand the issues that have replaced the simple memory model of the 1960s: the parallel nature of processors and the hierarchical nature of memories. Moreover, as we explain in Section 1.7, today’s programmers need to worry about energy efficiency of their programs running either on the PMD or in the Cloud, which also requires understanding what is below your code. Programmers who seek to build competitive versions of software will therefore need to increase their knowledge of computer organization.
We are honored to have the opportunity to explain what’s inside this revolutionary machine, unraveling the software below your program and the hardware under the covers of your computer. By the time you complete this book, we believe you will be able to answer the following questions:
■ How are programs written in a high-level language, such as C or Java, translated into the language of the hardware, and how does the hardware execute the resulting program? Comprehending these concepts forms the basis of understanding the aspects of both the hardware and software that affect program performance.
■ What is the interface between the software and the hardware, and how does software instruct the hardware to perform needed functions? These concepts are vital to understanding how to write many kinds of software.
■ What determines the performance of a program, and how can a programmer improve the performance? As we will see, this depends on the original program, the software translation of that program into the computer’s language, and the effectiveness of the hardware in executing the program.
■ What techniques can be used by hardware designers to improve performance? This book will introduce the basic concepts of modern computer design. The interested reader will find much more material on this topic in our advanced book, Computer Architecture: A Quantitative Approach.
■ What techniques can be used by hardware designers to improve energy efficiency? What can the programmer do to help or hinder energy efficiency?
■ What are the reasons for and the consequences of the recent switch from sequential processing to parallel processing? This book gives the motivation, describes the current hardware mechanisms to support parallelism, and surveys the new generation of “multicore” microprocessors (see Chapter 6).
■ Since the first commercial computer in 1951, what great ideas did computer architects come up with that lay the foundation of modern computing?
multicore microprocessor
A microprocessor containing multiple processors (“cores”) in a single integrated circuit.
Without understanding the answers to these questions, improving the performance of your program on a modern computer or evaluating what features might make one computer better than another for a particular application will be a complex process of trial and error, rather than a scientific procedure driven by insight and analysis.
This first chapter lays the foundation for the rest of the book. It introduces the basic ideas and definitions, places the major components of software and hardware in perspective, shows how to evaluate performance and energy, introduces integrated circuits (the technology that fuels the computer revolution), and explains the shift to multicores.
In this chapter and later ones, you will likely see many new words, or words that you may have heard but are not sure what they mean. Don’t panic! Yes, there is a lot of special terminology used in describing modern computers, but the terminology actually helps, since it enables us to describe precisely a function or capability. In addition, computer designers (including your authors) love using acronyms, which are easy to understand once you know what the letters stand for! To help you remember and locate terms, we have included a highlighted definition of every term in the margins the first time it appears in the text. After a short time of working with the terminology, you will be fluent, and your friends will be impressed as you correctly use acronyms such as BIOS, CPU, DIMM, DRAM, PCIe, SATA, and many others.
acronym
A word constructed by taking the initial letters of a string of words. For example: RAM is an acronym for Random Access Memory, and CPU is an acronym for Central Processing Unit.
To reinforce how the software and hardware systems used to run a program will affect performance, we use a special section, Understanding Program Performance, throughout the book to summarize important insights into program performance. The first one appears below.
Understanding Program Performance
The performance of a program depends on a combination of the effectiveness of the algorithms used in the program, the software systems used to create and translate the program into machine instructions, and the effectiveness of the computer in executing those instructions, which may include input/output (I/O) operations. This table summarizes how the hardware and software affect performance.
|
Hardware or software component |
How this component affects performance |
Where is this topic covered? |
|
Algorithm |
Determines both the number of source-level statements and the number of I/O operations executed |
Other books! |
|
Programming language, compiler, and architecture |
Determines the number of computer instructions for each source-level statement |
Chapters 2 and 3 |
|
Processor and memory system |
Determines how fast instructions can be executed |
Chapters 4, 5, and 6 |
|
I/O system (hardware and operating system) |
Determines how fast I/O operations may be executed |
Chapters 4, 5, and 6 |
To demonstrate the impact of the ideas in this book, we improve the performance of a C program that multiplies a matrix times a vector in a sequence of chapters. Each step leverages understanding how the underlying hardware really works in a modern microprocessor to improve performance by a factor of 200!
■ In the category of data level parallelism, in Chapter 3 we use subword parallelism via C intrinsics to increase performance by a factor of 3.8.
■ In the category of instruction level parallelism, in Chapter 4 we use loop unrolling to exploit multiple instruction issue and out-of-order execution hardware to increase performance by another factor of 2.3.
■ In the category of memory hierarchy optimization, in Chapter 5 we use cache blocking to increase performance on large matrices by another factor of 2.5.
■ In the category of thread level parallelism, in Chapter 6 we use parallel for loops in OpenMP to exploit multicore hardware to increase performance by another factor of 14.
Check Yourself
Check Yourself sections are designed to help readers assess whether they comprehend the major concepts introduced in a chapter and understand the implications of those concepts. Some Check Yourself questions have simple answers; others are for discussion among a group. Answers to the specific questions can be found at the end of the chapter. Check Yourself questions appear only at the end of a section, making it easy to skip them if you are sure you understand the material.
1. The number of embedded processors sold every year greatly outnumbers the number of PC and even PostPC processors. Can you confirm or deny this insight based on your own experience? Try to count the number of embedded processors in your home. How does it compare with the number of conventional computers in your home?
2. As mentioned earlier, both the software and hardware affect the performance of a program. Can you think of examples where each of the following is the right place to look for a performance bottleneck?
■ The algorithm chosen
■ The programming language or compiler
■ The operating system
■ The processor
■ The I/O system and devices
1.2 Eight Great Ideas in Computer Architecture
We now introduce eight great ideas that computer architects have been invented in the last 60 years of computer design. These ideas are so powerful they have lasted long after the first computer that used them, with newer architects demonstrating their admiration by imitating their predecessors. These great ideas are themes that we will weave through this and subsequent chapters as examples arise. To point out their influence, in this section we introduce icons and highlighted terms that represent the great ideas and we use them to identify the nearly 100 sections of the book that feature use of the great ideas.
Design for Moore’s Law
The one constant for computer designers is rapid change, which is driven largely by Moore’s Law. It states that integrated circuit resources double every 18–24 months. Moore’s Law resulted from a 1965 prediction of such growth in IC capacity made by Gordon Moore, one of the founders of Intel. As computer designs can take years, the resources available per chip can easily double or quadruple between the start and finish of the project. Like a skeet shooter, computer architects must anticipate where the technology will be when the design finishes rather than design for where it starts. We use an “up and to the right” Moore’s Law graph to represent designing for rapid change.

Use Abstraction to Simplify Design
Both computer architects and programmers had to invent techniques to make themselves more productive, for otherwise design time would lengthen as dramatically as resources grew by Moore’s Law. A major productivity technique for hardware and software is to use abstractions to represent the design at different levels of representation; lower-level details are hidden to offer a simpler model at higher levels. We’ll use the abstract painting icon to represent this second great idea.

Make the Common Case Fast
Making the common case fast will tend to enhance performance better than optimizing the rare case. Ironically, the common case is often simpler than the rare case and hence is often easier to enhance. This common sense advice implies that you know what the common case is, which is only possible with careful experimentation and measurement (see Section 1.6). We use a sports car as the icon for making the common case fast, as the most common trip has one or two passengers, and it’s surely easier to make a fast sports car than a fast minivan!

Performance via Parallelism
Since the dawn of computing, computer architects have offered designs that get more performance by performing operations in parallel. We’ll see many examples of parallelism in this book. We use multiple jet engines of a plane as our icon for parallel performance.

Performance via Pipelining
A particular pattern of parallelism is so prevalent in computer architecture that it merits its own name: pipelining. For example, before fire engines, a “bucket brigade” would respond to a fire, which many cowboy movies show in response to a dastardly act by the villain. The townsfolk form a human chain to carry a water source to fire, as they could much more quickly move buckets up the chain instead of individuals running back and forth. Our pipeline icon is a sequence of pipes, with each section representing one stage of the pipeline.

Performance via Prediction
Following the saying that it can be better to ask for forgiveness than to ask for permission, the final great idea is prediction. In some cases it can be faster on average to guess and start working rather than wait until you know for sure, assuming that the mechanism to recover from a misprediction is not too expensive and your prediction is relatively accurate. We use the fortune-teller’s crystal ball as our prediction icon.

Hierarchy of Memories
Programmers want memory to be fast, large, and cheap, as memory speed often shapes performance, capacity limits the size of problems that can be solved, and the cost of memory today is often the majority of computer cost. Architects have found that they can address these conflicting demands with a hierarchy of memories, with the fastest, smallest, and most expensive memory per bit at the top of the hierarchy and the slowest, largest, and cheapest per bit at the bottom. As we shall see in Chapter 5, caches give the programmer the illusion that main memory is nearly as fast as the top of the hierarchy and nearly as big and cheap as the bottom of the hierarchy. We use a layered triangle icon to represent the memory hierarchy. The shape indicates speed, cost, and size: the closer to the top, the faster and more expensive per bit the memory; the wider the base of the layer, the bigger the memory.

Dependability via Redundancy
Computers not only need to be fast; they need to be dependable. Since any physical device can fail, we make systems dependable by including redundant components that can take over when a failure occurs and to help detect failures. We use the tractor-trailer as our icon, since the dual tires on each side of its rear axels allow the truck to continue driving even when one tire fails. (Presumably, the truck driver heads immediately to a repair facility so the flat tire can be fixed, thereby restoring redundancy!)

1.3 Below Your Program
In Paris they simply stared when I spoke to them in French; I never did succeed in making those idiots understand their own language.
Mark Twain, The Innocents Abroad, 1869
A typical application, such as a word processor or a large database system, may consist of millions of lines of code and rely on sophisticated software libraries that implement complex functions in support of the application. As we will see, the hardware in a computer can only execute extremely simple low-level instructions. To go from a complex application to the simple instructions involves several layers of software that interpret or translate high-level operations into simple computer instructions, an example of the great idea of abstraction.
Figure 1.3 shows that these layers of software are organized primarily in a hierarchical fashion, with applications being the outermost ring and a variety of systems software sitting between the hardware and applications software.
systems software
Software that provides services that are commonly useful, including operating systems, compilers, loaders, and assemblers.
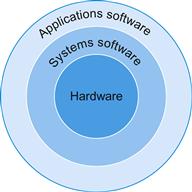
FIGURE 1.3 A simplified view of hardware and software as hierarchical layers, shown as concentric circles with hardware in the center and applications software outermost.
In complex applications, there are often multiple layers of application software as well. For example, a database system may run on top of the systems software hosting an application, which in turn runs on top of the database.
There are many types of systems software, but two types of systems software are central to every computer system today: an operating system and a compiler. An operating system interfaces between a user’s program and the hardware and provides a variety of services and supervisory functions. Among the most important functions are:
■ Handling basic input and output operations
■ Allocating storage and memory
■ Providing for protected sharing of the computer among multiple applications using it simultaneously.
operating system
Supervising program that manages the resources of a computer for the benefit of the programs that run on that computer.
Examples of operating systems in use today are Linux, iOS, and Windows.
Compilers perform another vital function: the translation of a program written in a high-level language, such as C, C++, Java, or Visual Basic into instructions that the hardware can execute. Given the sophistication of modern programming languages and the simplicity of the instructions executed by the hardware, the translation from a high-level language program to hardware instructions is complex. We give a brief overview of the process here and then go into more depth in Chapter 2 and in Appendix A.
compiler
A program that translates high-level language statements into assembly language statements.
From a High-Level Language to the Language of Hardware
To actually speak to electronic hardware, you need to send electrical signals. The easiest signals for computers to understand are on and off, and so the computer alphabet is just two letters. Just as the 26 letters of the English alphabet do not limit how much can be written, the two letters of the computer alphabet do not limit what computers can do. The two symbols for these two letters are the numbers 0 and 1, and we commonly think of the computer language as numbers in base 2, or binary numbers. We refer to each “letter” as a binary digit or bit. Computers are slaves to our commands, which are called instructions. Instructions, which are just collections of bits that the computer understands and obeys, can be thought of as numbers. For example, the bits
1000110010100000
tell one computer to add two numbers. Chapter 2 explains why we use numbers for instructions and data; we don’t want to steal that chapter’s thunder, but using numbers for both instructions and data is a foundation of computing.
binary digit
Also called a bit. One of the two numbers in base 2 (0 or 1) that are the components of information.
instruction
A command that computer hardware understands and obeys.
The first programmers communicated to computers in binary numbers, but this was so tedious that they quickly invented new notations that were closer to the way humans think. At first, these notations were translated to binary by hand, but this process was still tiresome. Using the computer to help program the computer, the pioneers invented programs to translate from symbolic notation to binary. The first of these programs was named an assembler. This program translates a symbolic version of an instruction into the binary version. For example, the programmer would write
add A,B
and the assembler would translate this notation into
1000110010100000
assembler
A program that translates a symbolic version of instructions into the binary version.
This instruction tells the computer to add the two numbers A and B. The name coined for this symbolic language, still used today, is assembly language. In contrast, the binary language that the machine understands is the machine language.
assembly language
A symbolic representation of machine instructions.
machine language
A binary representation of machine instructions.
Although a tremendous improvement, assembly language is still far from the notations a scientist might like to use to simulate fluid flow or that an accountant might use to balance the books. Assembly language requires the programmer to write one line for every instruction that the computer will follow, forcing the programmer to think like the computer.
The recognition that a program could be written to translate a more powerful language into computer instructions was one of the great breakthroughs in the early days of computing. Programmers today owe their productivity—and their sanity—to the creation of high-level programming languages and compilers that translate programs in such languages into instructions. Figure 1.4 shows the relationships among these programs and languages, which are more examples of the power of abstraction.
high-level programming language
A portable language such as C, C++, Java, or Visual Basic that is composed of words and algebraic notation that can be translated by a compiler into assembly language.
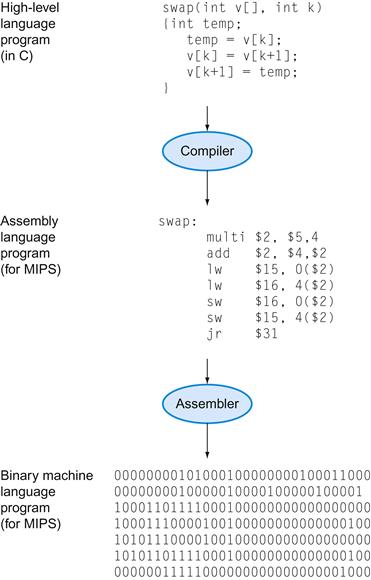
FIGURE 1.4 C program compiled into assembly language and then assembled into binary machine language.
Although the translation from high-level language to binary machine language is shown in two steps, some compilers cut out the middleman and produce binary machine language directly. These languages and this program are examined in more detail in Chapter 2.
A compiler enables a programmer to write this high-level language expression:
A+B
The compiler would compile it into this assembly language statement:
add A,B
As shown above, the assembler would translate this statement into the binary instructions that tell the computer to add the two numbers A and B.
High-level programming languages offer several important benefits. First, they allow the programmer to think in a more natural language, using English words and algebraic notation, resulting in programs that look much more like text than like tables of cryptic symbols (see Figure 1.4). Moreover, they allow languages to be designed according to their intended use. Hence, Fortran was designed for scientific computation, Cobol for business data processing, Lisp for symbol manipulation, and so on. There are also domain-specific languages for even narrower groups of users, such as those interested in simulation of fluids, for example.
The second advantage of programming languages is improved programmer productivity. One of the few areas of widespread agreement in software development is that it takes less time to develop programs when they are written in languages that require fewer lines to express an idea. Conciseness is a clear advantage of high-level languages over assembly language.
The final advantage is that programming languages allow programs to be independent of the computer on which they were developed, since compilers and assemblers can translate high-level language programs to the binary instructions of any computer. These three advantages are so strong that today little programming is done in assembly language.
1.4 Under the Covers
Now that we have looked below your program to uncover the underlying software, let’s open the covers of your computer to learn about the underlying hardware. The underlying hardware in any computer performs the same basic functions: inputting data, outputting data, processing data, and storing data. How these functions are performed is the primary topic of this book, and subsequent chapters deal with different parts of these four tasks.
When we come to an important point in this book, a point so important that we hope you will remember it forever, we emphasize it by identifying it as a Big Picture item. We have about a dozen Big Pictures in this book, the first being the five components of a computer that perform the tasks of inputting, outputting, processing, and storing data.
Two key components of computers are input devices, such as the microphone, and output devices, such as the speaker. As the names suggest, input feeds the computer, and output is the result of computation sent to the user. Some devices, such as wireless networks, provide both input and output to the computer.
input device
A mechanism through which the computer is fed information, such as a microphone.
output device
A mechanism that conveys the result of a computation to a user, such as a display, or to another computer.
Chapters 5 and 6 describe input/output (I/O) devices in more detail, but let’s take an introductory tour through the computer hardware, starting with the external I/O devices.
The BIG Picture
The five classic components of a computer are input, output, memory, datapath, and control, with the last two sometimes combined and called the processor. Figure 1.5 shows the standard organization of a computer. This organization is independent of hardware technology: you can place every piece of every computer, past and present, into one of these five categories. To help you keep all this in perspective, the five components of a computer are shown on the front page of each of the following chapters, with the portion of interest to that chapter highlighted.
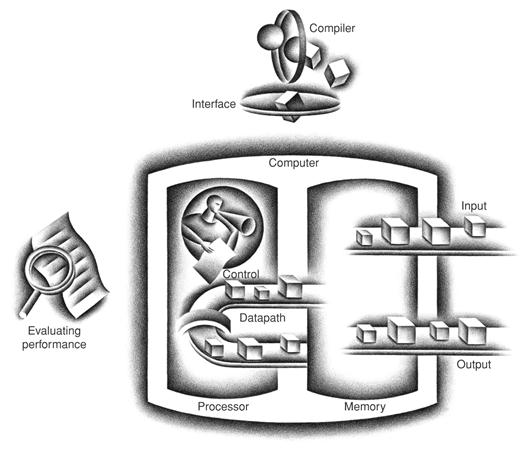
FIGURE 1.5 The organization of a computer, showing the five classic components.
The processor gets instructions and data from memory. Input writes data to memory, and output reads data from memory. Control sends the signals that determine the operations of the datapath, memory, input, and output.
Through the Looking Glass
Through computer displays I have landed an airplane on the deck of a moving carrier, observed a nuclear particle hit a potential well, flown in a rocket at nearly the speed of light and watched a computer reveal its innermost workings.
Ivan Sutherland, the “father” of computer graphics, Scientific American, 1984
The most fascinating I/O device is probably the graphics display. Most personal mobile devices use liquid crystal displays (LCDs) to get a thin, low-power display. The LCD is not the source of light; instead, it controls the transmission of light. A typical LCD includes rod-shaped molecules in a liquid that form a twisting helix that bends light entering the display, from either a light source behind the display or less often from reflected light. The rods straighten out when a current is applied and no longer bend the light. Since the liquid crystal material is between two screens polarized at 90 degrees, the light cannot pass through unless it is bent. Today, most LCD displays use an active matrix that has a tiny transistor switch at each pixel to precisely control current and make sharper images. A red-green-blue mask associated with each dot on the display determines the intensity of the three-color components in the final image; in a color active matrix LCD, there are three transistor switches at each point.
liquid crystal display
A display technology using a thin layer of liquid polymers that can be used to transmit or block light according to whether a charge is applied.
active matrix display
A liquid crystal display using a transistor to control the transmission of light at each individual pixel.
The image is composed of a matrix of picture elements, or pixels, which can be represented as a matrix of bits, called a bit map. Depending on the size of the screen and the resolution, the display matrix in a typical tablet ranges in size from 1024×768 to 2048×1536. A color display might use 8 bits for each of the three colors (red, blue, and green), for 24 bits per pixel, permitting millions of different colors to be displayed.
pixel
The smallest individual picture element. Screens are composed of hundreds of thousands to millions of pixels, organized in a matrix.
The computer hardware support for graphics consists mainly of a raster refresh buffer, or frame buffer, to store the bit map. The image to be represented onscreen is stored in the frame buffer, and the bit pattern per pixel is read out to the graphics display at the refresh rate. Figure 1.6 shows a frame buffer with a simplified design of just 4 bits per pixel.
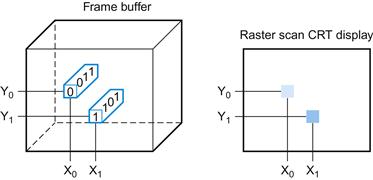
FIGURE 1.6 Each coordinate in the frame buffer on the left determines the shade of the corresponding coordinate for the raster scan CRT display on the right.
Pixel (X0, Y0) contains the bit pattern 0011, which is a lighter shade on the screen than the bit pattern 1101 in pixel (X1, Y1).
The goal of the bit map is to faithfully represent what is on the screen. The challenges in graphics systems arise because the human eye is very good at detecting even subtle changes on the screen.
Touchscreen
While PCs also use LCD displays, the tablets and smartphones of the PostPC era have replaced the keyboard and mouse with touch sensitive displays, which has the wonderful user interface advantage of users pointing directly what they are interested in rather than indirectly with a mouse.
While there are a variety of ways to implement a touch screen, many tablets today use capacitive sensing. Since people are electrical conductors, if an insulator like glass is covered with a transparent conductor, touching distorts the electrostatic field of the screen, which results in a change in capacitance. This technology can allow multiple touches simultaneously, which allows gestures that can lead to attractive user interfaces.
Opening the Box
Figure 1.7 shows the contents of the Apple iPad 2 tablet computer. Unsurprisingly, of the five classic components of the computer, I/O dominates this reading device. The list of I/O devices includes a capacitive multitouch LCD display, front facing camera, rear facing camera, microphone, headphone jack, speakers, accelerometer, gyroscope, Wi-Fi network, and Bluetooth network. The datapath, control, and memory are a tiny portion of the components.
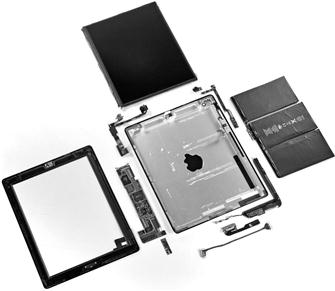
FIGURE 1.7 Components of the Apple iPad 2 A1395.
The metal back of the iPad (with the reversed Apple logo in the middle) is in the center. At the top is the capacitive multitouch screen and LCD display. To the far right is the 3.8 V, 25 watt-hour, polymer battery, which consists of three Li-ion cell cases and offers 10 hours of battery life. To the far left is the metal frame that attaches the LCD to the back of the iPad. The small components surrounding the metal back in the center are what we think of as the computer; they are often L-shaped to fit compactly inside the case next to the battery. Figure 1.8 shows a close-up of the L-shaped board to the lower left of the metal case, which is the logic printed circuit board that contains the processor and the memory. The tiny rectangle below the logic board contains a chip that provides wireless communication: Wi-Fi, Bluetooth, and FM tuner: it fits into a small slot in the lower left corner of the logic board. Near the upper left corner of the case is another L-shaped component, which is a front-facing camera assembly that includes the camera, headphone jack, and microphone. Near the right upper corner of the case is the board containing the volume control and silent/screen rotation lock button along with a gyroscope and accelerometer. These last two chips combine to allow the iPad to recognize 6-axis motion. The tiny rectangle next to it is the rear-facing camera. Near the bottom right of the case is the L-shaped speaker assembly. The cable at the bottom is the connector between the logic board and the camera/volume control board. The board between the cable and the speaker assembly is the controller for the capacitive touchscreen. (Courtesy iFixit, www.ifixit.com)
The small rectangles in Figure 1.8 contain the devices that drive our advancing technology, called integrated circuits and nicknamed chips. The A5 package seen in the middle of in Figure 1.8 contains two ARM processors that operate with a clock rate of 1 GHz. The processor is the active part of the computer, following the instructions of a program to the letter. It adds numbers, tests numbers, signals I/O devices to activate, and so on. Occasionally, people call the processor the CPU, for the more bureaucratic-sounding central processor unit.
integrated circuit
Also called a chip. A device combining dozens to millions of transistors.
central processor unit (CPU)
Also called processor. The active part of the computer, which contains the datapath and control and which adds numbers, tests numbers, signals I/O devices to activate, and so on.
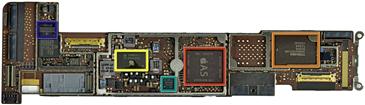
FIGURE 1.8 The logic board of Apple iPad 2 in Figure 1.7. The photo highlights five integrated circuits. The large integrated circuit in the middle is the Apple A5 chip, which contains a dual ARM processor cores that run at 1 GHz as well as 512 MB of main memory inside the package. Figure 1.9 shows a photograph of the processor chip inside the A5 package. The similar sized chip to the left is the 32 GB flash memory chip for nonvolatile storage. There is an empty space between the two chips where a second flash chip can be installed to double storage capacity of the iPad. The chips to the right of the A5 include power controller and I/O controller chips. (Courtesy iFixit, www.ifixit.com)
Descending even lower into the hardware, Figure 1.9 reveals details of a microprocessor. The processor logically comprises two main components: datapath and control, the respective brawn and brain of the processor. The datapath performs the arithmetic operations, and control tells the datapath, memory, and I/O devices what to do according to the wishes of the instructions of the program. Chapter 4 explains the datapath and control for a higher-performance design.
datapath
The component of the processor that performs arithmetic operations
control
The component of the processor that commands the datapath, memory, and I/O devices according to the instructions of the program.
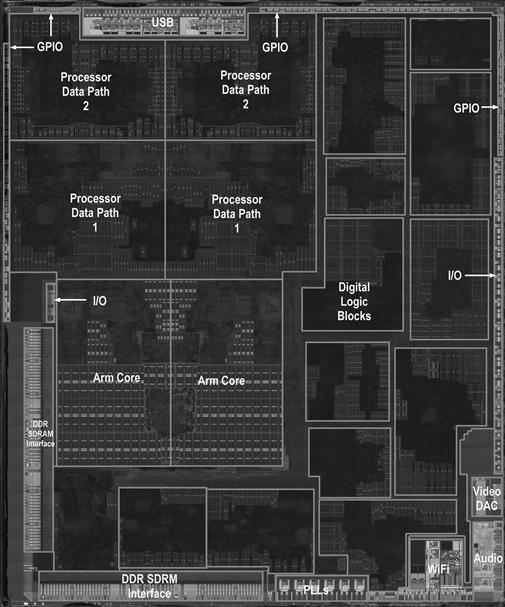
FIGURE 1.9 The processor integrated circuit inside the A5 package. The size of chip is 12.1 by 10.1 mm, and it was manufactured originally in a 45-nm process (see Section 1.5). It has two identical ARM processors or cores in the middle left of the chip and a PowerVR graphical processor unit (GPU) with four datapaths in the upper left quadrant. To the left and bottom side of the ARM cores are interfaces to main memory (DRAM). (Courtesy Chipworks, www.chipworks.com)
The A5 package in Figure 1.8 also includes two memory chips, each with 2 gibibits of capacity, thereby supplying 512 MiB. The memory is where the programs are kept when they are running; it also contains the data needed by the running programs. The memory is built from DRAM chips. DRAM stands for dynamic random access memory. Multiple DRAMs are used together to contain the instructions and data of a program. In contrast to sequential access memories, such as magnetic tapes, the RAM portion of the term DRAM means that memory accesses take basically the same amount of time no matter what portion of the memory is read.
memory
The storage area in which programs are kept when they are running and that contains the data needed by the running programs.
dynamic random access memory (DRAM)
Memory built as an integrated circuit; it provides random access to any location. Access times are 50 nanoseconds and cost per gigabyte in 2012 was $5 to $10.
Descending into the depths of any component of the hardware reveals insights into the computer. Inside the processor is another type of memory—cache memory. Cache memory consists of a small, fast memory that acts as a buffer for the DRAM memory. (The nontechnical definition of cache is a safe place for hiding things.) Cache is built using a different memory technology, static random access memory (SRAM). SRAM is faster but less dense, and hence more expensive, than DRAM (see Chapter 5). SRAM and DRAM are two layers of the memory hierarchy.
cache memory
A small, fast memory that acts as a buffer for a slower, larger memory.
static random access memory (SRAM)
Also memory built as an integrated circuit, but faster and less dense than DRAM.
As mentioned above, one of the great ideas to improve design is abstraction. One of the most important abstractions is the interface between the hardware and the lowest-level software. Because of its importance, it is given a special name: the instruction set architecture, or simply architecture, of a computer. The instruction set architecture includes anything programmers need to know to make a binary machine language program work correctly, including instructions, I/O devices, and so on. Typically, the operating system will encapsulate the details of doing I/O, allocating memory, and other low-level system functions so that application programmers do not need to worry about such details. The combination of the basic instruction set and the operating system interface provided for application programmers is called the application binary interface (ABI).
instruction set architecture
Also called architecture. An abstract interface between the hardware and the lowest-level software that encompasses all the information necessary to write a machine language program that will run correctly, including instructions, registers, memory access, I/O, and so on.
application binary interface (ABI)
The user portion of the instruction set plus the operating system interfaces used by application programmers. It defines a standard for binary portability across computers.
An instruction set architecture allows computer designers to talk about functions independently from the hardware that performs them. For example, we can talk about the functions of a digital clock (keeping time, displaying the time, setting the alarm) independently from the clock hardware (quartz crystal, LED displays, plastic buttons). Computer designers distinguish architecture from an implementation of an architecture along the same lines: an implementation is hardware that obeys the architecture abstraction. These ideas bring us to another Big Picture.
implementation
Hardware that obeys the architecture abstraction.
The BIG Picture
Both hardware and software consist of hierarchical layers using abstraction, with each lower layer hiding details from the level above. One key interface between the levels of abstraction is the instruction set architecture—the interface between the hardware and low-level software. This abstract interface enables many implementations of varying cost and performance to run identical software.
A Safe Place for Data
Thus far, we have seen how to input data, compute using the data, and display data. If we were to lose power to the computer, however, everything would be lost because the memory inside the computer is volatile—that is, when it loses power, it forgets. In contrast, a DVD disk doesn’t forget the movie when you turn off the power to the DVD player, and is thus a nonvolatile memory technology.
volatile memory
Storage, such as DRAM, that retains data only if it is receiving power.
nonvolatile memory
A form of memory that retains data even in the absence of a power source and that is used to store programs between runs. A DVD disk is nonvolatile.
To distinguish between the volatile memory used to hold data and programs while they are running and this nonvolatile memory used to store data and programs between runs, the term main memory or primary memory is used for the former, and secondary memory for the latter. Secondary memory forms the next lower layer of the memory hierarchy. DRAMs have dominated main memory since 1975, but magnetic disks dominated secondary memory starting even earlier. Because of their size and form factor, personal Mobile Devices use flash memory, a nonvolatile semiconductor memory, instead of disks. Figure 1.8 shows the chip containing the flash memory of the iPad 2. While slower than DRAM, it is much cheaper than DRAM in addition to being nonvolatile. Although costing more per bit than disks, it is smaller, it comes in much smaller capacities, it is more rugged, and it is more power efficient than disks. Hence, flash memory is the standard secondary memory for PMDs. Alas, unlike disks and DRAM, flash memory bits wear out after 100,000 to 1,000,000 writes. Thus, file systems must keep track of the number of writes and have a strategy to avoid wearing out storage, such as by moving popular data. Chapter 5describes disks and flash memory in more detail.
main memory
Also called primary memory. Memory used to hold programs while they are running; typically consists of DRAM in today’s computers.
secondary memory
Nonvolatile memory used to store programs and data between runs; typically consists of flash memory in PMDs and magnetic disks in servers.
magnetic disk
Also called hard disk. A form of nonvolatile secondary memory composed of rotating platters coated with a magnetic recording material. Because they are rotating mechanical devices, access times are about 5 to 20 milliseconds and cost per gigabyte in 2012 was $0.05 to $0.10.
flash memory
A nonvolatile semiconductor memory. It is cheaper and slower than DRAM but more expensive per bit and faster than magnetic disks. Access times are about 5 to 50 microseconds and cost per gigabyte in 2012 was $0.75 to $1.00.
Communicating with Other Computers
We’ve explained how we can input, compute, display, and save data, but there is still one missing item found in today’s computers: computer networks. Just as the processor shown in Figure 1.5 is connected to memory and I/O devices, networks interconnect whole computers, allowing computer users to extend the power of computing by including communication. Networks have become so popular that they are the backbone of current computer systems; a new personal mobile device or server without a network interface would be ridiculed. Networked computers have several major advantages:
■ Communication: Information is exchanged between computers at high speeds.
■ Resource sharing: Rather than each computer having its own I/O devices, computers on the network can share I/O devices.
■ Nonlocal access: By connecting computers over long distances, users need not be near the computer they are using.
Networks vary in length and performance, with the cost of communication increasing according to both the speed of communication and the distance that information travels. Perhaps the most popular type of network is Ethernet. It can be up to a kilometer long and transfer at up to 40 gigabits per second. Its length and speed make Ethernet useful to connect computers on the same floor of a building; hence, it is an example of what is generically called a local area network. Local area networks are interconnected with switches that can also provide routing services and security. Wide area networks cross continents and are the backbone of the Internet, which supports the web. They are typically based on optical fibers and are leased from telecommunication companies.
local area network (LAN)
A network designed to carry data within a geographically confined area, typically within a single building.
wide area network (WAN)
A network extended over hundreds of kilometers that can span a continent.
Networks have changed the face of computing in the last 30 years, both by becoming much more ubiquitous and by making dramatic increases in performance. In the 1970s, very few individuals had access to electronic mail, the Internet and web did not exist, and physically mailing magnetic tapes was the primary way to transfer large amounts of data between two locations. Local area networks were almost nonexistent, and the few existing wide area networks had limited capacity and restricted access.
As networking technology improved, it became much cheaper and had a much higher capacity. For example, the first standardized local area network technology, developed about 30 years ago, was a version of Ethernet that had a maximum capacity (also called bandwidth) of 10 million bits per second, typically shared by tens of, if not a hundred, computers. Today, local area network technology offers a capacity of from 1 to 40 gigabits per second, usually shared by at most a few computers. Optical communications technology has allowed similar growth in the capacity of wide area networks, from hundreds of kilobits to gigabits and from hundreds of computers connected to a worldwide network to millions of computers connected. This combination of dramatic rise in deployment of networking combined with increases in capacity have made network technology central to the information revolution of the last 30 years.
For the last decade another innovation in networking is reshaping the way computers communicate. Wireless technology is widespread, which enabled the PostPC Era. The ability to make a radio in the same low-cost semiconductor technology (CMOS) used for memory and microprocessors enabled a significant improvement in price, leading to an explosion in deployment. Currently available wireless technologies, called by the IEEE standard name 802.11, allow for transmission rates from 1 to nearly 100 million bits per second. Wireless technology is quite a bit different from wire-based networks, since all users in an immediate area share the airwaves.
Check Yourself
■ Semiconductor DRAM memory, flash memory, and disk storage differ significantly. For each technology, list its volatility, approximate relative access time, and approximate relative cost compared to DRAM.
1.5 Technologies for Building Processors and Memory
Processors and memory have improved at an incredible rate, because computer designers have long embraced the latest in electronic technology to try to win the race to design a better computer. Figure 1.10shows the technologies that have been used over time, with an estimate of the relative performance per unit cost for each technology. Since this technology shapes what computers will be able to do and how quickly they will evolve, we believe all computer professionals should be familiar with the basics of integrated circuits.
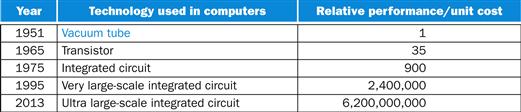
FIGURE 1.10 Relative performance per unit cost of technologies used in computers over time. Source: Computer Museum, Boston, with 2013 extrapolated by the authors. See ![]() Section 1.12.
Section 1.12.
A transistor is simply an on/off switch controlled by electricity. The integrated circuit (IC) combined dozens to hundreds of transistors into a single chip. When Gordon Moore predicted the continuous doubling of resources, he was predicting the growth rate of the number of transistors per chip. To describe the tremendous increase in the number of transistors from hundreds to millions, the adjective very large scale is added to the term, creating the abbreviation VLSI, for very large-scale integrated circuit.
transistor
An on/off switch controlled by an electric signal.
very large-scale integrated (VLSI) circuit
A device containing hundreds of thousands to millions of transistors.
This rate of increasing integration has been remarkably stable. Figure 1.11 shows the growth in DRAM capacity since 1977. For 35 years, the industry has consistently quadrupled capacity every 3 years, resulting in an increase in excess of 16,000 times!
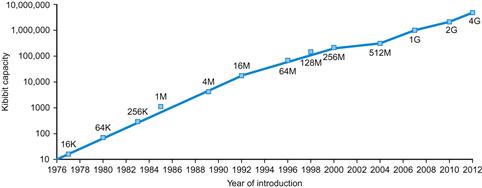
FIGURE 1.11 Growth of capacity per DRAM chip over time.
The y-axis is measured in kibibits (210 bits). The DRAM industry quadrupled capacity almost every three years, a 60% increase per year, for 20 years. In recent years, the rate has slowed down and is somewhat closer to doubling every two years to three years.
To understand how manufacture integrated circuits, we start at the beginning. The manufacture of a chip begins with silicon, a substance found in sand. Because silicon does not conduct electricity well, it is called a semiconductor. With a special chemical process, it is possible to add materials to silicon that allow tiny areas to transform into one of three devices:
■ Excellent conductors of electricity (using either microscopic copper or aluminum wire)
■ Excellent insulators from electricity (like plastic sheathing or glass)
■ Areas that can conduct or insulate under special conditions (as a switch)
silicon
A natural element that is a semiconductor.
semiconductor
A substance that does not conduct electricity well.
Transistors fall in the last category. A VLSI circuit, then, is just billions of combinations of conductors, insulators, and switches manufactured in a single small package.
The manufacturing process for integrated circuits is critical to the cost of the chips and hence important to computer designers. Figure 1.12 shows that process. The process starts with a silicon crystal ingot, which looks like a giant sausage. Today, ingots are 8–12 inches in diameter and about 12–24 inches long. An ingot is finely sliced into wafers no more than 0.1 inches thick. These wafers then go through a series of processing steps, during which patterns of chemicals are placed on each wafer, creating the transistors, conductors, and insulators discussed earlier. Today’s integrated circuits contain only one layer of transistors but may have from two to eight levels of metal conductor, separated by layers of insulators.
silicon crystal ingot
A rod composed of a silicon crystal that is between 8 and 12 inches in diameter and about 12 to 24 inches long.
wafer
A slice from a silicon ingot no more than 0.1 inches thick, used to create chips.
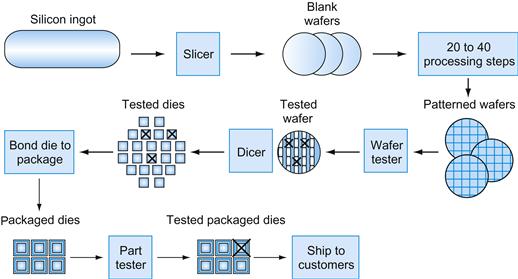
FIGURE 1.12 The chip manufacturing process.
After being sliced from the silicon ingot, blank wafers are put through 20 to 40 steps to create patterned wafers (see Figure 1.13). These patterned wafers are then tested with a wafer tester, and a map of the good parts is made. Then, the wafers are diced into dies (see Figure 1.9). In this figure, one wafer produced 20 dies, of which 17 passed testing. (X means the die is bad.) The yield of good dies in this case was 17/20, or 85%. These good dies are then bonded into packages and tested one more time before shipping the packaged parts to customers. One bad packaged part was found in this final test.
A single microscopic flaw in the wafer itself or in one of the dozens of patterning steps can result in that area of the wafer failing. These defects, as they are called, make it virtually impossible to manufacture a perfect wafer. The simplest way to cope with imperfection is to place many independent components on a single wafer. The patterned wafer is then chopped up, or diced, into these components, called dies and more informally known as chips. Figure 1.13 shows a photograph of a wafer containing microprocessors before they have been diced; earlier, Figure 1.9 shows an individual microprocessor die.
defect
A microscopic flaw in a wafer or in patterning steps that can result in the failure of the die containing that defect.
die
The individual rectangular sections that are cut from a wafer, more informally known as chips.
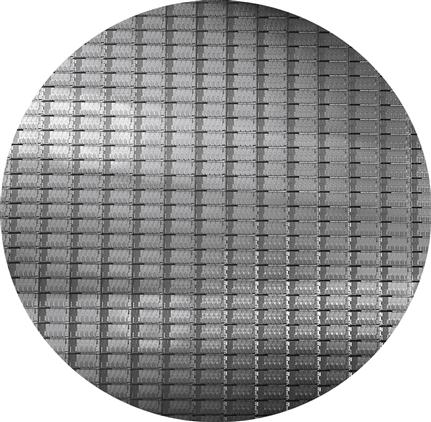
FIGURE 1.13 A 12-inch (300 mm) wafer of Intel Core i7 (Courtesy Intel).
The number of dies on this 300 mm (12 inch) wafer at 100% yield is 280, each 20.7 by 10.5 mm. The several dozen partially rounded chips at the boundaries of the wafer are useless; they are included because it’s easier to create the masks used to pattern the silicon. This die uses a 32-nanometer technology, which means that the smallest features are approximately 32 nm in size, although they are typically somewhat smaller than the actual feature size, which refers to the size of the transistors as “drawn” versus the final manufactured size.
Dicing enables you to discard only those dies that were unlucky enough to contain the flaws, rather than the whole wafer. This concept is quantified by the yield of a process, which is defined as the percentage of good dies from the total number of dies on the wafer.
yield
The percentage of good dies from the total number of dies on the wafer.
The cost of an integrated circuit rises quickly as the die size increases, due both to the lower yield and the smaller number of dies that fit on a wafer. To reduce the cost, using the next generation process shrinks a large die as it uses smaller sizes for both transistors and wires. This improves the yield and the die count per wafer. A 32-nanometer (nm) process was typical in 2012, which means essentially that the smallest feature size on the die is 32 nm.
Once you’ve found good dies, they are connected to the input/output pins of a package, using a process called bonding. These packaged parts are tested a final time, since mistakes can occur in packaging, and then they are shipped to customers.
Elaboration
The cost of an integrated circuit can be expressed in three simple equations:
The first equation is straightforward to derive. The second is an approximation, since it does not subtract the area near the border of the round wafer that cannot accommodate the rectangular dies (see Figure 1.13). The final equation is based on empirical observations of yields at integrated circuit factories, with the exponent related to the number of critical processing steps.
Hence, depending on the defect rate and the size of the die and wafer, costs are generally not linear in the die area.
Check Yourself
A key factor in determining the cost of an integrated circuit is volume. Which of the following are reasons why a chip made in high volume should cost less?
1. With high volumes, the manufacturing process can be tuned to a particular design, increasing the yield.
2. It is less work to design a high-volume part than a low-volume part.
3. The masks used to make the chip are expensive, so the cost per chip is lower for higher volumes.
4. Engineering development costs are high and largely independent of volume; thus, the development cost per die is lower with high-volume parts.
5. High-volume parts usually have smaller die sizes than low-volume parts and therefore have higher yield per wafer.
1.6 Performance
Assessing the performance of computers can be quite challenging. The scale and intricacy of modern software systems, together with the wide range of performance improvement techniques employed by hardware designers, have made performance assessment much more difficult.
When trying to choose among different computers, performance is an important attribute. Accurately measuring and comparing different computers is critical to purchasers and therefore to designers. The people selling computers know this as well. Often, salespeople would like you to see their computer in the best possible light, whether or not this light accurately reflects the needs of the purchaser’s application. Hence, understanding how best to measure performance and the limitations of performance measurements is important in selecting a computer.
The rest of this section describes different ways in which performance can be determined; then, we describe the metrics for measuring performance from the viewpoint of both a computer user and a designer. We also look at how these metrics are related and present the classical processor performance equation, which we will use throughout the text.
Defining Performance
When we say one computer has better performance than another, what do we mean? Although this question might seem simple, an analogy with passenger airplanes shows how subtle the question of performance can be. Figure 1.14 lists some typical passenger airplanes, together with their cruising speed, range, and capacity. If we wanted to know which of the planes in this table had the best performance, we would first need to define performance. For example, considering different measures of performance, we see that the plane with the highest cruising speed was the Concorde (retired from service in 2003), the plane with the longest range is the DC-8, and the plane with the largest capacity is the 747.
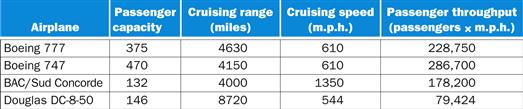
FIGURE 1.14 The capacity, range, and speed for a number of commercial airplanes.
The last column shows the rate at which the airplane transports passengers, which is the capacity times the cruising speed (ignoring range and takeoff and landing times).
Let’s suppose we define performance in terms of speed. This still leaves two possible definitions. You could define the fastest plane as the one with the highest cruising speed, taking a single passenger from one point to another in the least time. If you were interested in transporting 450 passengers from one point to another, however, the 747 would clearly be the fastest, as the last column of the figure shows. Similarly, we can define computer performance in several different ways.
If you were running a program on two different desktop computers, you’d say that the faster one is the desktop computer that gets the job done first. If you were running a datacenter that had several servers running jobs submitted by many users, you’d say that the faster computer was the one that completed the most jobs during a day. As an individual computer user, you are interested in reducing response time—the time between the start and completion of a task—also referred to as execution time. Datacenter managers are often interested in increasing throughput or bandwidth—the total amount of work done in a given time. Hence, in most cases, we will need different performance metrics as well as different sets of applications to benchmark personal mobile devices, which are more focused on response time, versus servers, which are more focused on throughput.
response time
Also called execution time. The total time required for the computer to complete a task, including disk accesses, memory accesses, I/O activities, operating system overhead, CPU execution time, and so on.
throughput
Also called bandwidth. Another measure of performance, it is the number of tasks completed per unit time.
Throughput and Response Time
Example
Do the following changes to a computer system increase throughput, decrease response time, or both?
1. Replacing the processor in a computer with a faster version
2. Adding additional processors to a system that uses multiple processors for separate tasks—for example, searching the web
Answer
Decreasing response time almost always improves throughput. Hence, in case 1, both response time and throughput are improved. In case 2, no one task gets work done faster, so only throughput increases.
If, however, the demand for processing in the second case was almost as large as the throughput, the system might force requests to queue up. In this case, increasing the throughput could also improve response time, since it would reduce the waiting time in the queue. Thus, in many real computer systems, changing either execution time or throughput often affects the other.
In discussing the performance of computers, we will be primarily concerned with response time for the first few chapters. To maximize performance, we want to minimize response time or execution time for some task. Thus, we can relate performance and execution time for a computer X:
![]()
This means that for two computers X and Y, if the performance of X is greater than the performance of Y, we have
That is, the execution time on Y is longer than that on X, if X is faster than Y.
In discussing a computer design, we often want to relate the performance of two different computers quantitatively. We will use the phrase “X is n times faster than Y”—or equivalently “X is n times as fast as Y”—to mean
![]()
If X is n times as fast as Y, then the execution time on Y is n times as long as it is on X:
![]()
Relative Performance
Example
If computer A runs a program in 10 seconds and computer B runs the same program in 15 seconds how much faster is A than B?
Answer
We know that A is n times as fast as B if
![]()
Thus the performance ratio is
![]()
and A is therefore 1.5 times as fast as B.
In the above example, we could also say that computer B is 1.5 times slower than computer A, since
![]()
means that
![]()
For simplicity, we will normally use the terminology as fast as when we try to compare computers quantitatively. Because performance and execution time are reciprocals, increasing performance requires decreasing execution time. To avoid the potential confusion between the terms increasing and decreasing, we usually say “improve performance” or “improve execution time” when we mean “increase performance” and “decrease execution time.”
Measuring Performance
Time is the measure of computer performance: the computer that performs the same amount of work in the least time is the fastest. Program execution time is measured in seconds per program. However, time can be defined in different ways, depending on what we count. The most straightforward definition of time is called wall clock time, response time, or elapsed time. These terms mean the total time to complete a task, including disk accesses, memory accesses, input/output (I/O) activities, operating system overhead—everything.
Computers are often shared, however, and a processor may work on several programs simultaneously. In such cases, the system may try to optimize throughput rather than attempt to minimize the elapsed time for one program. Hence, we often want to distinguish between the elapsed time and the time over which the processor is working on our behalf. CPU execution time or simply CPU time, which recognizes this distinction, is the time the CPU spends computing for this task and does not include time spent waiting for I/O or running other programs. (Remember, though, that the response time experienced by the user will be the elapsed time of the program, not the CPU time.) CPU time can be further divided into the CPU time spent in the program, called user CPU time, and the CPU time spent in the operating system performing tasks on behalf of the program, called system CPU time. Differentiating between system and user CPU time is difficult to do accurately, because it is often hard to assign responsibility for operating system activities to one user program rather than another and because of the functionality differences among operating systems.
CPU execution time
Also called CPU time. The actual time the CPU spends computing for a specific task.
user CPU time
The CPU time spent in a program itself.
system CPU time
The CPU time spent in the operating system performing tasks on behalf of the program.
For consistency, we maintain a distinction between performance based on elapsed time and that based on CPU execution time. We will use the term system performance to refer to elapsed time on an unloaded system and CPU performance to refer to user CPU time. We will focus on CPU performance in this chapter, although our discussions of how to summarize performance can be applied to either elapsed time or CPU time measurements.
Understanding Program Performance
Different applications are sensitive to different aspects of the performance of a computer system. Many applications, especially those running on servers, depend as much on I/O performance, which, in turn, relies on both hardware and software. Total elapsed time measured by a wall clock is the measurement of interest. In some application environments, the user may care about throughput, response time, or a complex combination of the two (e.g., maximum throughput with a worst-case response time). To improve the performance of a program, one must have a clear definition of what performance metric matters and then proceed to look for performance bottlenecks by measuring program execution and looking for the likely bottlenecks. In the following chapters, we will describe how to search for bottlenecks and improve performance in various parts of the system.
Although as computer users we care about time, when we examine the details of a computer it’s convenient to think about performance in other metrics. In particular, computer designers may want to think about a computer by using a measure that relates to how fast the hardware can perform basic functions. Almost all computers are constructed using a clock that determines when events take place in the hardware. These discrete time intervals are called clock cycles (or ticks, clock ticks, clock periods, clocks, cycles). Designers refer to the length of a clock period both as the time for a complete clock cycle(e.g., 250 picoseconds, or 250 ps) and as the clock rate (e.g., 4 gigahertz, or 4 GHz), which is the inverse of the clock period. In the next subsection, we will formalize the relationship between the clock cycles of the hardware designer and the seconds of the computer user.
clock cycle
Also called tick, clock tick, clock period, clock, or cycle. The time for one clock period, usually of the processor clock, which runs at a constant rate.
clock period
The length of each clock cycle.
Check Yourself
1. Suppose we know that an application that uses both personal mobile devices and the Cloud is limited by network performance. For the following changes, state whether only the throughput improves, both response time and throughput improve, or neither improves.
a. An extra network channel is added between the PMD and the Cloud, increasing the total network throughput and reducing the delay to obtain network access (since there are now two channels).
b. The networking software is improved, thereby reducing the network communication delay, but not increasing throughput.
c. More memory is added to the computer.
2. Computer C’s performance is 4 times as fast as the performance of computer B, which runs a given application in 28 seconds. How long will computer C take to run that application?
CPU Performance and Its Factors
Users and designers often examine performance using different metrics. If we could relate these different metrics, we could determine the effect of a design change on the performance as experienced by the user. Since we are confining ourselves to CPU performance at this point, the bottom-line performance measure is CPU execution time. A simple formula relates the most basic metrics (clock cycles and clock cycle time) to CPU time:
![]()
Alternatively, because clock rate and clock cycle time are inverses,
![]()
This formula makes it clear that the hardware designer can improve performance by reducing the number of clock cycles required for a program or the length of the clock cycle. As we will see in later chapters, the designer often faces a trade-off between the number of clock cycles needed for a program and the length of each cycle. Many techniques that decrease the number of clock cycles may also increase the clock cycle time.
Improving Performance
Example
Our favorite program runs in 10 seconds on computer A, which has a 2 GHz clock. We are trying to help a computer designer build a computer, B, which will run this program in 6 seconds. The designer has determined that a substantial increase in the clock rate is possible, but this increase will affect the rest of the CPU design, causing computer B to require 1.2 times as many clock cycles as computer A for this program. What clock rate should we tell the designer to target?
Answer
Let’s first find the number of clock cycles required for the program on A:
![]()
![]()
CPU time for B can be found using this equation:
![]()
![]()
![]()
To run the program in 6 seconds, B must have twice the clock rate of A.
Instruction Performance
The performance equations above did not include any reference to the number of instructions needed for the program. However, since the compiler clearly generated instructions to execute, and the computer had to execute the instructions to run the program, the execution time must depend on the number of instructions in a program. One way to think about execution time is that it equals the number of instructions executed multiplied by the average time per instruction. Therefore, the number of clock cycles required for a program can be written as
![]()
The term clock cycles per instruction, which is the average number of clock cycles each instruction takes to execute, is often abbreviated as CPI. Since different instructions may take different amounts of time depending on what they do, CPI is an average of all the instructions executed in the program. CPI provides one way of comparing two different implementations of the same instruction set architecture, since the number of instructions executed for a program will, of course, be the same.
clock cycles per instruction (CPI)
Average number of clock cycles per instruction for a program or program fragment.
Using the Performance Equation
Example
Suppose we have two implementations of the same instruction set architecture. Computer A has a clock cycle time of 250 ps and a CPI of 2.0 for some program, and computer B has a clock cycle time of 500 ps and a CPI of 1.2 for the same program. Which computer is faster for this program and by how much?
Answer
We know that each computer executes the same number of instructions for the program; let’s call this number I. First, find the number of processor clock cycles for each computer:
![]()
Now we can compute the CPU time for each computer:
![]()
Likewise, for B:
![]()
Clearly, computer A is faster. The amount faster is given by the ratio of the execution times:
![]()
We can conclude that computer A is 1.2 times as fast as computer B for this program.
The Classic CPU Performance Equation
We can now write this basic performance equation in terms of instruction count (the number of instructions executed by the program), CPI, and clock cycle time:
![]()
or, since the clock rate is the inverse of clock cycle time:
![]()
instruction count
The number of instructions executed by the program.
These formulas are particularly useful because they separate the three key factors that affect performance. We can use these formulas to compare two different implementations or to evaluate a design alternative if we know its impact on these three parameters.
Comparing Code Segments
Example
A compiler designer is trying to decide between two code sequences for a particular computer. The hardware designers have supplied the following facts:
For a particular high-level language statement, the compiler writer is considering two code sequences that require the following instruction counts:
Which code sequence executes the most instructions? Which will be faster? What is the CPI for each sequence?
Answer
Sequence 1 executes 2+1+2=5 instructions. Sequence 2 executes 4+1+1=6 instructions. Therefore, sequence 1 executes fewer instructions.
We can use the equation for CPU clock cycles based on instruction count and CPI to find the total number of clock cycles for each sequence:
![]()
This yields
![]()
![]()
So code sequence 2 is faster, even though it executes one extra instruction. Since code sequence 2 takes fewer overall clock cycles but has more instructions, it must have a lower CPI. The CPI values can be computed by
The BIG Picture
Figure 1.15 shows the basic measurements at different levels in the computer and what is being measured in each case. We can see how these factors are combined to yield execution time measured in seconds per program:
![]()
Always bear in mind that the only complete and reliable measure of computer performance is time. For example, changing the instruction set to lower the instruction count may lead to an organization with a slower clock cycle time or higher CPI that offsets the improvement in instruction count. Similarly, because CPI depends on type of instructions executed, the code that executes the fewest number of instructions may not be the fastest.
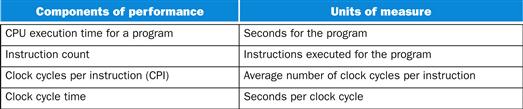
FIGURE 1.15 The basic components of performance and how each is measured.
How can we determine the value of these factors in the performance equation? We can measure the CPU execution time by running the program, and the clock cycle time is usually published as part of the documentation for a computer. The instruction count and CPI can be more difficult to obtain. Of course, if we know the clock rate and CPU execution time, we need only one of the instruction count or the CPI to determine the other.
We can measure the instruction count by using software tools that profile the execution or by using a simulator of the architecture. Alternatively, we can use hardware counters, which are included in most processors, to record a variety of measurements, including the number of instructions executed, the average CPI, and often, the sources of performance loss. Since the instruction count depends on the architecture, but not on the exact implementation, we can measure the instruction count without knowing all the details of the implementation. The CPI, however, depends on a wide variety of design details in the computer, including both the memory system and the processor structure (as we will see in Chapter 4 and Chapter 5), as well as on the mix of instruction types executed in an application. Thus, CPI varies by application, as well as among implementations with the same instruction set.
The above example shows the danger of using only one factor (instruction count) to assess performance. When comparing two computers, you must look at all three components, which combine to form execution time. If some of the factors are identical, like the clock rate in the above example, performance can be determined by comparing all the nonidentical factors. Since CPI varies by instruction mix, both instruction count and CPI must be compared, even if clock rates are identical. Several exercises at the end of this chapter ask you to evaluate a series of computer and compiler enhancements that affect clock rate, CPI, and instruction count. In ![]() Section 1.10, we’ll examine a common performance measurement that does not incorporate all the terms and can thus be misleading.
Section 1.10, we’ll examine a common performance measurement that does not incorporate all the terms and can thus be misleading.
instruction mix
A measure of the dynamic frequency of instructions across one or many programs.
Understanding Program Performance
The performance of a program depends on the algorithm, the language, the compiler, the architecture, and the actual hardware. The following table summarizes how these components affect the factors in the CPU performance equation.
|
Hardware or software component |
Affects what? |
How? |
|
Algorithm |
Instruction count, possibly CPI |
The algorithm determines the number of source program instructions executed and hence the number of processor instructions executed. The algorithm may also affect the CPI, by favoring slower or faster instructions. For example, if the algorithm uses more divides, it will tend to have a higher CPI. |
|
Programming language |
Instruction count, CPI |
The programming language certainly affects the instruction count, since statements in the language are translated to processor instructions, which determine instruction count. The language may also affect the CPI because of its features; for example, a language with heavy support for data abstraction (e.g., Java) will require indirect calls, which will use higher CPI instructions. |
|
Compiler |
Instruction count, CPI |
The efficiency of the compiler affects both the instruction count and average cycles per instruction, since the compiler determines the translation of the source language instructions into computer instructions. The compiler’s role can be very complex and affect the CPI in complex ways. |
|
Instruction set architecture |
Instruction count, clock rate, CPI |
The instruction set architecture affects all three aspects of CPU performance, since it affects the instructions needed for a function, the cost in cycles of each instruction, and the overall clock rate of the processor. |
Elaboration
Although you might expect that the minimum CPI is 1.0, as we’ll see in Chapter 4, some processors fetch and execute multiple instructions per clock cycle. To reflect that approach, some designers invert CPI to talk about IPC, or instructions per clock cycle. If a processor executes on average 2 instructions per clock cycle, then it has an IPC of 2 and hence a CPI of 0.5.
Elaboration
Although clock cycle time has traditionally been fixed, to save energy or temporarily boost performance, today’s processors can vary their clock rates, so we would need to use the average clock rate for a program. For example, the Intel Core i7 will temporarily increase clock rate by about 10% until the chip gets too warm. Intel calls this Turbo mode.
Check Yourself
A given application written in Java runs 15 seconds on a desktop processor. A new Java compiler is released that requires only 0.6 as many instructions as the old compiler. Unfortunately, it increases the CPI by 1.1. How fast can we expect the application to run using this new compiler? Pick the right answer from the three choices below:
a. ![]()
b. 15×0.6×1.1=9.9 sec
c. ![]()
1.7 The Power Wall
Figure 1.16 shows the increase in clock rate and power of eight generations of Intel microprocessors over 30 years. Both clock rate and power increased rapidly for decades, and then flattened off recently. The reason they grew together is that they are correlated, and the reason for their recent slowing is that we have run into the practical power limit for cooling commodity microprocessors.
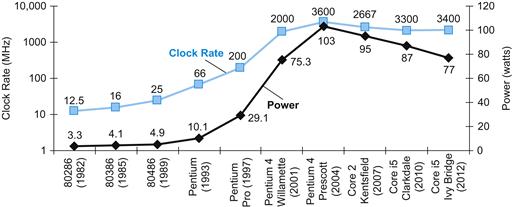
FIGURE 1.16 Clock rate and Power for Intel x86 microprocessors over eight generations and 25 years.
The Pentium 4 made a dramatic jump in clock rate and power but less so in performance. The Prescott thermal problems led to the abandonment of the Pentium 4 line. The Core 2 line reverts to a simpler pipeline with lower clock rates and multiple processors per chip. The Core i5 pipelines follow in its footsteps.
Although power provides a limit to what we can cool, in the PostPC Era the really valuable resource is energy. Battery life can trump performance in the personal mobile device, and the architects of warehouse scale computers try to reduce the costs of powering and cooling 100,000 servers as the costs are high at this scale. Just as measuring time in seconds is a safer measure of program performance than a rate like MIPS (see Section 1.10), the energy metric joules is a better measure than a power rate like watts, which is just joules/second.
The dominant technology for integrated circuits is called CMOS (complementary metal oxide semiconductor). For CMOS, the primary source of energy consumption is so-called dynamic energy—that is, energy that is consumed when transistors switch states from 0 to 1 and vice versa. The dynamic energy depends on the capacitive loading of each transistor and the voltage applied:
![]()
This equation is the energy of a pulse during the logic transition of 0 → 1 → 0 or 1 → 0 → 1. The energy of a single transition is then
![]()
The power required per transistor is just the product of energy of a transition and the frequency of transitions:
![]()
Frequency switched is a function of the clock rate. The capacitive load per transistor is a function of both the number of transistors connected to an output (called the fanout) and the technology, which determines the capacitance of both wires and transistors.
With regard to Figure 1.16, how could clock rates grow by a factor of 1000 while power grew by only a factor of 30? Energy and thus power can be reduced by lowering the voltage, which occurred with each new generation of technology, and power is a function of the voltage squared. Typically, the voltage was reduced about 15% per generation. In 20 years, voltages have gone from 5 V to 1 V, which is why the increase in power is only 30 times.
Relative Power
Example
Suppose we developed a new, simpler processor that has 85% of the capacitive load of the more complex older processor. Further, assume that it has adjustable voltage so that it can reduce voltage 15% compared to processor B, which results in a 15% shrink in frequency. What is the impact on dynamic power?
Answer
![]()
Thus the power ratio is
![]()
Hence, the new processor uses about half the power of the old processor.
The problem today is that further lowering of the voltage appears to make the transistors too leaky, like water faucets that cannot be completely shut off. Even today about 40% of the power consumption in server chips is due to leakage. If transistors started leaking more, the whole process could become unwieldy.
To try to address the power problem, designers have already attached large devices to increase cooling, and they turn off parts of the chip that are not used in a given clock cycle. Although there are many more expensive ways to cool chips and thereby raise their power to, say, 300 watts, these techniques are generally too expensive for personal computers and even servers, not to mention personal mobile devices.
Since computer designers slammed into a power wall, they needed a new way forward. They chose a different way from the way they designed microprocessors for their first 30 years.
Elaboration
Although dynamic energy is the primary source of energy consumption in CMOS, static energy consumption occurs because of leakage current that flows even when a transistor is off. In servers, leakage is typically responsible for 40% of the energy consumption. Thus, increasing the number of transistors increases power dissipation, even if the transistors are always off. A variety of design techniques and technology innovations are being deployed to control leakage, but it’s hard to lower voltage further.
Elaboration
Power is a challenge for integrated circuits for two reasons. First, power must be brought in and distributed around the chip; modern microprocessors use hundreds of pins just for power and ground! Similarly, multiple levels of chip interconnect are used solely for power and ground distribution to portions of the chip. Second, power is dissipated as heat and must be removed. Server chips can burn more than 100 watts, and cooling the chip and the surrounding system is a major expense in Warehouse Scale Computers (see Chapter 6).
1.8 The Sea Change: The Switch from Uniprocessors to Multiprocessors
Up to now, most software has been like music written for a solo performer; with the current generation of chips we’re getting a little experience with duets and quartets and other small ensembles; but scoring a work for large orchestra and chorus is a different kind of challenge.
Brian Hayes, Computing in a Parallel Universe, 2007.
The power limit has forced a dramatic change in the design of microprocessors. Figure 1.17 shows the improvement in response time of programs for desktop microprocessors over time. Since 2002, the rate has slowed from a factor of 1.5 per year to a factor of 1.2 per year.
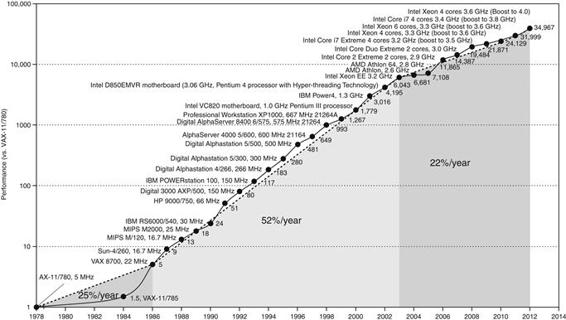
FIGURE 1.17 Growth in processor performance since the mid-1980s.
This chart plots performance relative to the VAX 11/780 as measured by the SPECint benchmarks (see Section 1.10). Prior to the mid-1980s, processor performance growth was largely technology-driven and averaged about 25% per year. The increase in growth to about 52% since then is attributable to more advanced architectural and organizational ideas. The higher annual performance improvement of 52% since the mid-1980s meant performance was about a factor of seven higher in 2002 than it would have been had it stayed at 25%. Since 2002, the limits of power, available instruction-level parallelism, and long memory latency have slowed uniprocessor performance recently, to about 22% per year.
Rather than continuing to decrease the response time of a single program running on the single processor, as of 2006 all desktop and server companies are shipping microprocessors with multiple processors per chip, where the benefit is often more on throughput than on response time. To reduce confusion between the words processor and microprocessor, companies refer to processors as “cores,” and such microprocessors are generically called multicore microprocessors. Hence, a “quadcore” microprocessor is a chip that contains four processors or four cores.
In the past, programmers could rely on innovations in hardware, architecture, and compilers to double performance of their programs every 18 months without having to change a line of code. Today, for programmers to get significant improvement in response time, they need to rewrite their program s to take advantage of multiple processors. Moreover, to get the historic benefit of running faster on new microprocessors, programmers will have to continue to improve performance of their code as the number of cores increases.
To reinforce how the software and hardware systems work hand in hand, we use a special section, Hardware/Software Interface, throughout the book, with the first one appearing below. These elements summarize important insights at this critical interface.
Hardware/Software Interface
Parallelism has always been critical to performance in computing, but it was often hidden. Chapter 4 will explain pipelining, an elegant technique that runs programs faster by overlapping the execution of instructions. This is one example of instruction-level parallelism, where the parallel nature of the hardware is abstracted away so the programmer and compiler can think of the hardware as executing instructions sequentially.
Forcing programmers to be aware of the parallel hardware and to explicitly rewrite their programs to be parallel had been the “third rail” of computer architecture, for companies in the past that depended on such a change in behavior failed (see ![]() Section 6.15). From this historical perspective, it’s startling that the whole IT industry has bet its future that programmers will finally successfully switch to explicitly parallel programming.
Section 6.15). From this historical perspective, it’s startling that the whole IT industry has bet its future that programmers will finally successfully switch to explicitly parallel programming.
Why has it been so hard for programmers to write explicitly parallel programs? The first reason is that parallel programming is by definition performance programming, which increases the difficulty of programming. Not only does the program need to be correct, solve an important problem, and provide a useful interface to the people or other programs that invoke it, the program must also be fast. Otherwise, if you don’t need performance, just write a sequential program.
The second reason is that fast for parallel hardware means that the programmer must divide an application so that each processor has roughly the same amount to do at the same time, and that the overhead of scheduling and coordination doesn’t fritter away the potential performance benefits of parallelism.
As an analogy, suppose the task was to write a newspaper story. Eight reporters working on the same story could potentially write a story eight times faster. To achieve this increased speed, one would need to break up the task so that each reporter had something to do at the same time. Thus, we must schedule the sub-tasks. If anything went wrong and just one reporter took longer than the seven others did, then the benefits of having eight writers would be diminished. Thus, we must balance the load evenly to get the desired speedup. Another danger would be if reporters had to spend a lot of time talking to each other to write their sections. You would also fall short if one part of the story, such as the conclusion, couldn’t be written until all of the other parts were completed. Thus, care must be taken to reduce communication and synchronization overhead. For both this analogy and parallel programming, the challenges include scheduling, load balancing, time for synchronization, and overhead for communication between the parties. As you might guess, the challenge is stiffer with more reporters for a newspaper story and more processors for parallel programming.
To reflect this sea change in the industry, the next five chapters in this edition of the book each have a section on the implications of the parallel revolution to that chapter:
■ Chapter 2, Section 2.11: Parallelism and Instructions: Synchronization. Usually independent parallel tasks need to coordinate at times, such as to say when they have completed their work. This chapter explains the instructions used by multicore processors to synchronize tasks.
■ Chapter 3, Section 3.6: Parallelism and Computer Arithmetic: Subword Parallelism. Perhaps the simplest form of parallelism to build involves computing on elements in parallel, such as when multiplying two vectors. Subword parallelism takes advantage of the resources supplied by Moore’s Law to provider wider arithmetic units that can operate on many operands simultaneously.
■ Chapter 4, Section 4.10: Parallelism via Instructions. Given the difficulty of explicitly parallel programming, tremendous effort was invested in the 1990s in having the hardware and the compiler uncover implicit parallelism, initially vice pipelining. This chapter describes some of these aggressive techniques, including fetching and executing multiple instructions simultaneously and guessing on the outcomes of decisions, and executing instructions speculatively using prediction.
■ Chapter 5, Section 5.10: Parallelism and Memory Hierarchies: Cache Coherence. One way to lower the cost of communication is to have all processors use the same address space, so that any processor can read or write any data. Given that all processors today use caches to keep a temporary copy of the data in faster memory near the processor, it’s easy to imagine that parallel programming would be even more difficult if the caches associated with each processor had inconsistent values of the shared data. This chapter describes the mechanisms that keep the data in all caches consistent.
■ Chapter 5, Section 5.11: Parallelism and Memory Hierarchy: Redundant Arrays of Inexpensive Disks. This section describes how using many disks in conjunction can offer much higher throughput, which was the original inspiration of Redundant Arrays of Inexpensive Disks (RAID). The real popularity of RAID proved to be to the much greater dependability offered by including a modest number of redundant disks. The section explains the differences in performance, cost, and dependability between the different RAID levels.
In addition to these sections, there is a full chapter on parallel processing. Chapter 6 goes into more detail on the challenges of parallel programming; presents the two contrasting approaches to communication of shared addressing and explicit message passing; describes a restricted model of parallelism that is easier to program; discusses the difficulty of benchmarking parallel processors; introduces a new simple performance model for multicore microprocessors; and, finally, describes and evaluates four examples of multicore microprocessors using this model.
As mentioned above, Chapters 3 to 6 use matrix vector multiply as a running example to show how each type of parallelism can significantly increase performance.
![]() Appendix C describes an increasingly popular hardware component that is included with desktop computers, the graphics processing unit (GPU). Invented to accelerate graphics, GPUs are becoming programming platforms in their own right. As you might expect, given these times, GPUs rely on parallelism.
Appendix C describes an increasingly popular hardware component that is included with desktop computers, the graphics processing unit (GPU). Invented to accelerate graphics, GPUs are becoming programming platforms in their own right. As you might expect, given these times, GPUs rely on parallelism.
![]() Appendix C describes the NVIDIA GPU and highlights parts of its parallel programming environment.
Appendix C describes the NVIDIA GPU and highlights parts of its parallel programming environment.
1.9 Real Stuff: Benchmarking the Intel Core i7
I thought [computers] would be a universally applicable idea, like a book is. But I didn’t think it would develop as fast as it did, because I didn’t envision we’d be able to get as many parts on a chip as we finally got. The transistor came along unexpectedly. It all happened much faster than we expected.
J. Presper Eckert, coinventor of ENIAC, speaking in 1991
Each chapter has a section entitled “Real Stuff” that ties the concepts in the book with a computer you may use every day. These sections cover the technology underlying modern computers. For this first “Real Stuff” section, we look at how integrated circuits are manufactured and how performance and power are measured, with the Intel Core i7 as the example.
SPEC CPU Benchmark
A computer user who runs the same programs day in and day out would be the perfect candidate to evaluate a new computer. The set of programs run would form a workload. To evaluate two computer systems, a user would simply compare the execution time of the workload on the two computers. Most users, however, are not in this situation. Instead, they must rely on other methods that measure the performance of a candidate computer, hoping that the methods will reflect how well the computer will perform with the user’s workload. This alternative is usually followed by evaluating the computer using a set of benchmarks—programs specifically chosen to measure performance. The benchmarks form a workload that the user hopes will predict the performance of the actual workload. As we noted above, to make the common case fast, you first need to know accurately which case is common, so benchmarks play a critical role in computer architecture.
workload
A set of programs run on a computer that is either the actual collection of applications run by a user or constructed from real programs to approximate such a mix. A typical workload specifies both the programs and the relative frequencies.
benchmark
A program selected for use in comparing computer performance.
SPEC (System Performance Evaluation Cooperative) is an effort funded and supported by a number of computer vendors to create standard sets of benchmarks for modern computer systems. In 1989, SPEC originally created a benchmark set focusing on processor performance (now called SPEC89), which has evolved through five generations. The latest is SPEC CPU2006, which consists of a set of 12 integer benchmarks (CINT2006) and 17 floating-point benchmarks (CFP2006). The integer benchmarks vary from part of a C compiler to a chess program to a quantum computer simulation. The floating-point benchmarks include structured grid codes for finite element modeling, particle method codes for molecular dynamics, and sparse linear algebra codes for fluid dynamics.
Figure 1.18 describes the SPEC integer benchmarks and their execution time on the Intel Core i7 and shows the factors that explain execution time: instruction count, CPI, and clock cycle time. Note that CPI varies by more than a factor of 5.
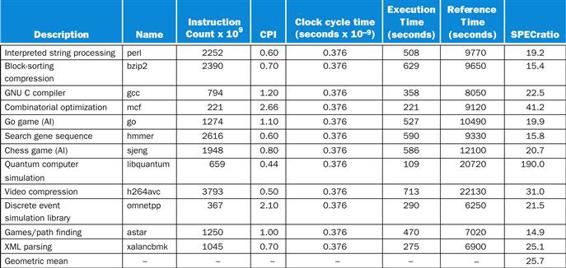
FIGURE 1.18 SPECINTC2006 benchmarks running on a 2.66 GHz Intel Core i7 920.
As the equation on page 35 explains, execution time is the product of the three factors in this table: instruction count in billions, clocks per instruction (CPI), and clock cycle time in nanoseconds. SPECratio is simply the reference time, which is supplied by SPEC, divided by the measured execution time. The single number quoted as SPECINTC2006 is the geometric mean of the SPECratios.
To simplify the marketing of computers, SPEC decided to report a single number to summarize all 12 integer benchmarks. Dividing the execution time of a reference processor by the execution time of the measured computer normalizes the execution time measurements; this normalization yields a measure, called the SPECratio, which has the advantage that bigger numeric results indicate faster performance. That is, the SPECratio is the inverse of execution time. A CINT2006 or CFP2006 summary measurement is obtained by taking the geometric mean of the SPECratios.
Elaboration
When comparing two computers using SPECratios, use the geometric mean so that it gives the same relative answer no matter what computer is used to normalize the results. If we averaged the normalized execution time values with an arithmetic mean, the results would vary depending on the computer we choose as the reference.
The formula for the geometric mean is
![]()
where Execution time ratioi is the execution time, normalized to the reference computer, for the ith program of a total of n in the workload, and
![]()
SPEC Power Benchmark
Given the increasing importance of energy and power, SPEC added a benchmark to measure power. It reports power consumption of servers at different workload levels, divided into 10% increments, over a period of time. Figure 1.19 shows the results for a server using Intel Nehalem processors similar to the above.
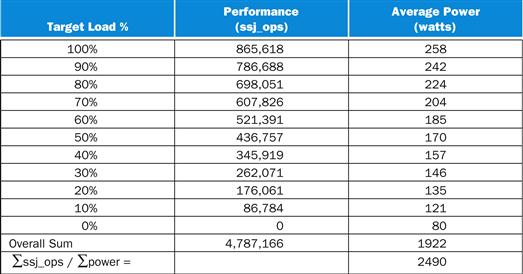
FIGURE 1.19 SPECpower_ssj2008 running on a dual socket 2.66 GHz Intel Xeon X5650 with 16 GB of DRAM and one 100 GB SSD disk.
SPECpower started with another SPEC benchmark for Java business applications (SPECJBB2005), which exercises the processors, caches, and main memory as well as the Java virtual machine, compiler, garbage collector, and pieces of the operating system. Performance is measured in throughput, and the units are business operations per second. Once again, to simplify the marketing of computers, SPEC boils these numbers down to a single number, called “overall ssj_ops per watt.” The formula for this single summarizing metric is

where ssj_opsi is performance at each 10% increment and poweri is power consumed at each performance level.
1.10 Fallacies and Pitfalls
Science must begin with myths, and the criticism of myths.
Sir Karl Popper, The Philosophy of Science, 1957
The purpose of a section on fallacies and pitfalls, which will be found in every chapter, is to explain some commonly held misconceptions that you might encounter. We call them fallacies. When discussing a fallacy, we try to give a counterexample. We also discuss pitfalls, or easily made mistakes. Often pitfalls are generalizations of principles that are true in a limited context. The purpose of these sections is to help you avoid making these mistakes in the computers you may design or use. Cost/performance fallacies and pitfalls have ensnared many a computer architect, including us. Accordingly, this section suffers no shortage of relevant examples. We start with a pitfall that traps many designers and reveals an important relationship in computer design.
Pitfall: Expecting the improvement of one aspect of a computer to increase overall performance by an amount proportional to the size of the improvement.
The great idea of making the common case fast has a demoralizing corollary that has plagued designers of both hardware and software. It reminds us that the opportunity for improvement is affected by how much time the event consumes.
A simple design problem illustrates it well. Suppose a program runs in 100 seconds on a computer, with multiply operations responsible for 80 seconds of this time. How much do I have to improve the speed of multiplication if I want my program to run five times faster?
The execution time of the program after making the improvement is given by the following simple equation known as Amdahl’s Law:
![]()
For this problem:
![]()
Amdahl’s Law
A rule stating that the performance enhancement possible with a given improvement is limited by the amount that the improved feature is used. It is a quantitative version of the law of diminishing returns.
Since we want the performance to be five times faster, the new execution time should be 20 seconds, giving
That is, there is no amount by which we can enhance-multiply to achieve a fivefold increase in performance, if multiply accounts for only 80% of the workload. The performance enhancement possible with a given improvement is limited by the amount that the improved feature is used. In everyday life this concept also yields what we call the law of diminishing returns.
We can use Amdahl’s Law to estimate performance improvements when we know the time consumed for some function and its potential speedup. Amdahl’s Law, together with the CPU performance equation, is a handy tool for evaluating potential enhancements. Amdahl’s Law is explored in more detail in the exercises.
Amdahl’s Law is also used to argue for practical limits to the number of parallel processors. We examine this argument in the Fallacies and Pitfalls section of Chapter 6.
Fallacy: Computers at low utilization use little power.
Power efficiency matters at low utilizations because server workloads vary. Utilization of servers in Google’s warehouse scale computer, for example, is between 10% and 50% most of the time and at 100% less than 1% of the time. Even given five years to learn how to run the SPECpower benchmark well, the specially configured computer with the best results in 2012 still uses 33% of the peak power at 10% of the load. Systems in the field that are not configured for the SPECpower benchmark are surely worse.
Since servers’ workloads vary but use a large fraction of peak power, Luiz Barroso and Urs Hölzle [2007] argue that we should redesign hardware to achieve “energy-proportional computing.” If future servers used, say, 10% of peak power at 10% workload, we could reduce the electricity bill of datacenters and become good corporate citizens in an era of increasing concern about CO2 emissions.
Fallacy: Designing for performance and designing for energy efficiency are unrelated goals.
Since energy is power over time, it is often the case that hardware or software optimizations that take less time save energy overall even if the optimization takes a bit more energy when it is used. One reason is that all of the rest of the computer is consuming energy while the program is running, so even if the optimized portion uses a little more energy, the reduced time can save the energy of the whole system.
Pitfall: Using a subset of the performance equation as a performance metric.
We have already shown the fallacy of predicting performance based on simply one of clock rate, instruction count, or CPI. Another common mistake is to use only two of the three factors to compare performance. Although using two of the three factors may be valid in a limited context, the concept is also easily misused. Indeed, nearly all proposed alternatives to the use of time as the performance metric have led eventually to misleading claims, distorted results, or incorrect interpretations.
One alternative to time is MIPS (million instructions per second). For a given program, MIPS is simply
![]()
million instructions per second (MIPS)
A measurement of program execution speed based on the number of millions of instructions. MIPS is computed as the instruction count divided by the product of the execution time and 106.
Since MIPS is an instruction execution rate, MIPS specifies performance inversely to execution time; faster computers have a higher MIPS rating. The good news about MIPS is that it is easy to understand, and faster computers mean bigger MIPS, which matches intuition.
There are three problems with using MIPS as a measure for comparing computers. First, MIPS specifies the instruction execution rate but does not take into account the capabilities of the instructions. We cannot compare computers with different instruction sets using MIPS, since the instruction counts will certainly differ. Second, MIPS varies between programs on the same computer; thus, a computer cannot have a single MIPS rating. For example, by substituting for execution time, we see the relationship between MIPS, clock rate, and CPI:
The CPI varied by a factor of 5 for SPEC CPU2006 on an Intel Core i7 computer in Figure 1.18, so MIPS does as well. Finally, and most importantly, if a new program executes more instructions but each instruction is faster, MIPS can vary independently from performance!
Check Yourself
Consider the following performance measurements for a program:
|
Measurement |
Computer A |
Computer B |
|
Instruction count |
10 billion |
8 billion |
|
Clock rate |
4 GHz |
4 GHz |
|
CPI |
1.0 |
1.1 |
a. Which computer has the higher MIPS rating?
b. Which computer is faster?
1.11 Concluding Remarks
Where … the ENIAC is equipped with 18,000 vacuum tubes and weighs 30 tons, computers in the future may have 1,000 vacuum tubes and perhaps weigh just 1½ tons.
Popular Mechanics, March 1949
Although it is difficult to predict exactly what level of cost/performance computers will have in the future, it’s a safe bet that they will be much better than they are today. To participate in these advances, computer designers and programmers must understand a wider variety of issues.
Both hardware and software designers construct computer systems in hierarchical layers, with each lower layer hiding details from the level above. This great idea of abstraction is fundamental to understanding today’s computer systems, but it does not mean that designers can limit themselves to knowing a single abstraction. Perhaps the most important example of abstraction is the interface between hardware and low-level software, called the instruction set architecture. Maintaining the instruction set architecture as a constant enables many implementations of that architecture—presumably varying in cost and performance—to run identical software. On the downside, the architecture may preclude introducing innovations that require the interface to change.
There is a reliable method of determining and reporting performance by using the execution time of real programs as the metric. This execution time is related to other important measurements we can make by the following equation:
![]()
We will use this equation and its constituent factors many times. Remember, though, that individually the factors do not determine performance: only the product, which equals execution time, is a reliable measure of performance.
The BIG Picture
Execution time is the only valid and unimpeachable measure of performance. Many other metrics have been proposed and found wanting. Sometimes these metrics are flawed from the start by not reflecting execution time; other times a metric that is valid in a limited context is extended and used beyond that context or without the additional clarification needed to make it valid.
The key hardware technology for modern processors is silicon. Equal in importance to an understanding of integrated circuit technology is an understanding of the expected rates of technological change, as predicted by Moore’s Law. While silicon fuels the rapid advance of hardware, new ideas in the organization of computers have improved price/performance. Two of the key ideas are exploiting parallelism in the program, typically today via multiple processors, and exploiting locality of accesses to a memory hierarchy, typically via caches.
Energy efficiency has replaced die area as the most critical resource of microprocessor design. Conserving power while trying to increase performance has forced the hardware industry to switch to multicore microprocessors, thereby forcing the software industry to switch to programming parallel hardware. Parallelism is now required for performance.
Computer designs have always been measured by cost and performance, as well as other important factors such as energy, dependability, cost of ownership, and scalability. Although this chapter has focused on cost, performance, and energy, the best designs will strike the appropriate balance for a given market among all the factors.
Road Map for This Book
At the bottom of these abstractions are the five classic components of a computer: datapath, control, memory, input, and output (refer to Figure 1.5). These five components also serve as the framework for the rest of the chapters in this book:
■ Datapath: Chapter 3, Chapter 4, Chapter 6, and ![]() Appendix C
Appendix C
■ Control: Chapter 4, Chapter 6, and ![]() Appendix C
Appendix C
■ Memory: Chapter 5
■ Input: Chapters 5 and 6
■ Output: Chapters 5 and 6
As mentioned above, Chapter 4 describes how processors exploit implicit parallelism, Chapter 6 describes the explicitly parallel multicore microprocessors that are at the heart of the parallel revolution, and ![]() Appendix C describes the highly parallel graphics processor chip. Chapter 5 describes how a memory hierarchy exploits locality. Chapter 2 describes instruction sets—the interface between compilers and the computer—and emphasizes the role of compilers and programming languages in using the features of the instruction set. Appendix A provides a reference for the instruction set of Chapter 2. Chapter 3describes how computers handle arithmetic data. Appendix B introduces logic design.
Appendix C describes the highly parallel graphics processor chip. Chapter 5 describes how a memory hierarchy exploits locality. Chapter 2 describes instruction sets—the interface between compilers and the computer—and emphasizes the role of compilers and programming languages in using the features of the instruction set. Appendix A provides a reference for the instruction set of Chapter 2. Chapter 3describes how computers handle arithmetic data. Appendix B introduces logic design.
 Historical Perspective and Further Reading
An active field of science is like an immense anthill; the individual almost vanishes into the mass of minds tumbling over each other, carrying information from place to place, passing it around at the speed of light.
Lewis Thomas, “Natural Science,” in The Lives of a Cell, 1974
For each chapter in the text, a section devoted to a historical perspective can be found online on a site that accompanies this book. We may trace the development of an idea through a series of computers or describe some important projects, and we provide references in case you are interested in probing further.
The historical perspective for this chapter provides a background for some of the key ideas presented in this opening chapter. Its purpose is to give you the human story behind the technological advances and to place achievements in their historical context. By understanding the past, you may be better able to understand the forces that will shape computing in the future. Each Historical Perspective section online ends with suggestions for further reading, which are also collected separately online under the section “Further Reading.” The rest of ![]() Section 1.12 is found online.
Section 1.12 is found online.
1.13 Exercises
The relative time ratings of exercises are shown in square brackets after each exercise number. On average, an exercise rated [10] will take you twice as long as one rated [5]. Sections of the text that should be read before attempting an exercise will be given in angled brackets; for example,<§1.4>means you should have read Section 1.4, Under the Covers, to help you solve this exercise.
1.1 [2] <§1.1> Aside from the smart cell phones used by a billion people, list and describe four other types of computers.
1.2 [5] <§1.2> The eight great ideas in computer architecture are similar to ideas from other fields. Match the eight ideas from computer architecture, “Design for Moore’s Law”, “Use Abstraction to Simplify Design”, “Make the Common Case Fast”, “Performance via Parallelism”, “Performance via Pipelining”, “Performance via Prediction”, “Hierarchy of Memories”, and “Dependability via Redundancy” to the following ideas from other fields:
a. Assembly lines in automobile manufacturing
b. Suspension bridge cables
c. Aircraft and marine navigation systems that incorporate wind information
d. Express elevators in buildings
e. Library reserve desk
f. Increasing the gate area on a CMOS transistor to decrease its switching time
g. Adding electromagnetic aircraft catapults (which are electrically-powered as opposed to current steam-powered models), allowed by the increased power generation offered by the new reactor technology
h. Building self-driving cars whose control systems partially rely on existing sensor systems already installed into the base vehicle, such as lane departure systems and smart cruise control systems
1.3 [2] <§1.3> Describe the steps that transform a program written in a high-level language such as C into a representation that is directly executed by a computer processor.
1.4 [2] <§1.4> Assume a color display using 8 bits for each of the primary colors (red, green, blue) per pixel and a frame size of 1280×1024.
a. What is the minimum size in bytes of the frame buffer to store a frame?
b. How long would it take, at a minimum, for the frame to be sent over a 100 Mbit/s network?
1.5 [4] <§1.6> Consider three different processors P1, P2, and P3 executing the same instruction set. P1 has a 3 GHz clock rate and a CPI of 1.5. P2 has a 2.5 GHz clock rate and a CPI of 1.0. P3 has a 4.0 GHz clock rate and has a CPI of 2.2.
a. Which processor has the highest performance expressed in instructions per second?
b. If the processors each execute a program in 10 seconds, find the number of cycles and the number of instructions.
c. We are trying to reduce the time by 30% but this leads to an increase of 20% in the CPI. What clock rate should we have to get this time reduction?
1.6 [20] <§1.6> Consider two different implementations of the same instruction set architecture. The instructions can be divided into four classes according to their CPI (class A, B, C, and D). P1 with a clock rate of 2.5 GHz and CPIs of 1, 2, 3, and 3, and P2 with a clock rate of 3 GHz and CPIs of 2, 2, 2, and 2.
Given a program with a dynamic instruction count of 1.0E6 instructions divided into classes as follows: 10% class A, 20% class B, 50% class C, and 20% class D, which implementation is faster?
a. What is the global CPI for each implementation?
b. Find the clock cycles required in both cases.
1.7 [15] <§1.6> Compilers can have a profound impact on the performance of an application. Assume that for a program, compiler A results in a dynamic instruction count of 1.0E9 and has an execution time of 1.1 s, while compiler B results in a dynamic instruction count of 1.2E9 and an execution time of 1.5 s.
a. Find the average CPI for each program given that the processor has a clock cycle time of 1 ns.
b. Assume the compiled programs run on two different processors. If the execution times on the two processors are the same, how much faster is the clock of the processor running compiler A’s code versus the clock of the processor running compiler B’s code?
c. A new compiler is developed that uses only 6.0E8 instructions and has an average CPI of 1.1. What is the speedup of using this new compiler versus using compiler A or B on the original processor?
1.8 The Pentium 4 Prescott processor, released in 2004, had a clock rate of 3.6 GHz and voltage of 1.25 V. Assume that, on average, it consumed 10 W of static power and 90 W of dynamic power.
The Core i5 Ivy Bridge, released in 2012, has a clock rate of 3.4 GHz and voltage of 0.9 V. Assume that, on average, it consumed 30 W of static power and 40 W of dynamic power.
1.8.1 [5] <§1.7> For each processor find the average capacitive loads.
1.8.2 [5] <§1.7> Find the percentage of the total dissipated power comprised by static power and the ratio of static power to dynamic power for each technology.
1.8.3 [15] <§1.7> If the total dissipated power is to be reduced by 10%, how much should the voltage be reduced to maintain the same leakage current? Note: power is defined as the product of voltage and current.
1.9 Assume for arithmetic, load/store, and branch instructions, a processor has CPIs of 1, 12, and 5, respectively. Also assume that on a single processor a program requires the execution of 2.56E9 arithmetic instructions, 1.28E9 load/store instructions, and 256 million branch instructions. Assume that each processor has a 2 GHz clock frequency.
Assume that, as the program is parallelized to run over multiple cores, the number of arithmetic and load/store instructions per processor is divided by 0.7 x p (where p is the number of processors) but the number of branch instructions per processor remains the same.
1.9.1 [5] <§1.7> Find the total execution time for this program on 1, 2, 4, and 8 processors, and show the relative speedup of the 2, 4, and 8 processor result relative to the single processor result.
1.9.2 [10] <§§1.6, 1.8> If the CPI of the arithmetic instructions was doubled, what would the impact be on the execution time of the program on 1, 2, 4, or 8 processors?
1.9.3 [10] <§§1.6, 1.8> To what should the CPI of load/store instructions be reduced in order for a single processor to match the performance of four processors using the original CPI values?
1.10 Assume a 15 cm diameter wafer has a cost of 12, contains 84 dies, and has 0.020 defects/cm2. Assume a 20 cm diameter wafer has a cost of 15, contains 100 dies, and has 0.031 defects/cm2.
1.10.1 [10] <§1.5> Find the yield for both wafers.
1.10.2 [5] <§1.5> Find the cost per die for both wafers.
1.10.3 [5] <§1.5> If the number of dies per wafer is increased by 10% and the defects per area unit increases by 15%, find the die area and yield.
1.10.4 [5] <§1.5> Assume a fabrication process improves the yield from 0.92 to 0.95. Find the defects per area unit for each version of the technology given a die area of 200 mm2.
1.11 The results of the SPEC CPU2006 bzip2 benchmark running on an AMD Barcelona has an instruction count of 2.389E12, an execution time of 750 s, and a reference time of 9650 s.
1.11.1 [5] <§§1.6, 1.9> Find the CPI if the clock cycle time is 0.333 ns.
1.11.2 [5] <§1.9> Find the SPECratio.
1.11.3 [5] <§§1.6, 1.9> Find the increase in CPU time if the number of instructions of the benchmark is increased by 10% without affecting the CPI.
1.11.4 [5] <§§1.6, 1.9> Find the increase in CPU time if the number of instructions of the benchmark is increased by 10% and the CPI is increased by 5%.
1.11.5 [5] <§§1.6, 1.9> Find the change in the SPECratio for this change.
1.11.6 [10] <§1.6> Suppose that we are developing a new version of the AMD Barcelona processor with a 4 GHz clock rate. We have added some additional instructions to the instruction set in such a way that the number of instructions has been reduced by 15%. The execution time is reduced to 700 s and the new SPECratio is 13.7. Find the new CPI.
1.11.7 [10] <§1.6> This CPI value is larger than obtained in 1.11.1 as the clock rate was increased from 3 GHz to 4 GHz. Determine whether the increase in the CPI is similar to that of the clock rate. If they are dissimilar, why?
1.11.8 [5] <§1.6> By how much has the CPU time been reduced?
1.11.9 [10] <§1.6> For a second benchmark, libquantum, assume an execution time of 960 ns, CPI of 1.61, and clock rate of 3 GHz. If the execution time is reduced by an additional 10% without affecting to the CPI and with a clock rate of 4 GHz, determine the number of instructions.
1.11.10 [10] <§1.6> Determine the clock rate required to give a further 10% reduction in CPU time while maintaining the number of instructions and with the CPI unchanged.
1.11.11 [10] <§1.6> Determine the clock rate if the CPI is reduced by 15% and the CPU time by 20% while the number of instructions is unchanged.
1.12 Section 1.10 cites as a pitfall the utilization of a subset of the performance equation as a performance metric. To illustrate this, consider the following two processors. P1 has a clock rate of 4 GHz, average CPI of 0.9, and requires the execution of 5.0E9 instructions. P2 has a clock rate of 3 GHz, an average CPI of 0.75, and requires the execution of 1.0E9 instructions.
1.12.1 [5] <§§1.6, 1.10> One usual fallacy is to consider the computer with the largest clock rate as having the largest performance. Check if this is true for P1 and P2.
1.12.2 [10] <§§1.6, 1.10> Another fallacy is to consider that the processor executing the largest number of instructions will need a larger CPU time. Considering that processor P1 is executing a sequence of 1.0E9 instructions and that the CPI of processors P1 and P2 do not change, determine the number of instructions that P2 can execute in the same time that P1 needs to execute 1.0E9 instructions.
1.12.3 [10] <§§1.6, 1.10> A common fallacy is to use MIPS (millions of instructions per second) to compare the performance of two different processors, and consider that the processor with the largest MIPS has the largest performance. Check if this is true for P1 and P2.
1.12.4 [10] <§1.10> Another common performance figure is MFLOPS (millions of floating-point operations per second), defined as
![]()
but this figure has the same problems as MIPS. Assume that 40% of the instructions executed on both P1 and P2 are floating-point instructions. Find the MFLOPS figures for the programs.
1.13 Another pitfall cited in Section 1.10 is expecting to improve the overall performance of a computer by improving only one aspect of the computer. Consider a computer running a program that requires 250 s, with 70 s spent executing FP instructions, 85 s executed L/S instructions, and 40 s spent executing branch instructions.
1.13.1 [5] <§1.10> By how much is the total time reduced if the time for FP operations is reduced by 20%?
1.13.2 [5] <§1.10> By how much is the time for INT operations reduced if the total time is reduced by 20%?
1.13.3 [5] <§1.10> Can the total time can be reduced by 20% by reducing only the time for branch instructions?
1.14 Assume a program requires the execution of 50×106 FP instructions, 110×106 INT instructions, 80×106 L/S instructions, and 16×106 branch instructions. The CPI for each type of instruction is 1, 1, 4, and 2, respectively. Assume that the processor has a 2 GHz clock rate.
1.14.1 [10] <§1.10> By how much must we improve the CPI of FP instructions if we want the program to run two times faster?
1.14.2 [10] <§1.10> By how much must we improve the CPI of L/S instructions if we want the program to run two times faster?
1.14.3 [5] <§1.10> By how much is the execution time of the program improved if the CPI of INT and FP instructions is reduced by 40% and the CPI of L/S and Branch is reduced by 30%?
1.15 [5] <§1.8> When a program is adapted to run on multiple processors in a multiprocessor system, the execution time on each processor is comprised of computing time and the overhead time required for locked critical sections and/or to send data from one processor to another.
Assume a program requires t=100 s of execution time on one processor. When run p processors, each processor requires t/p s, as well as an additional 4 s of overhead, irrespective of the number of processors. Compute the per-processor execution time for 2, 4, 8, 16, 32, 64, and 128 processors. For each case, list the corresponding speedup relative to a single processor and the ratio between actual speedup versus ideal speedup (speedup if there was no overhead).
All materials on the site are licensed Creative Commons Attribution-Sharealike 3.0 Unported CC BY-SA 3.0 & GNU Free Documentation License (GFDL)
If you are the copyright holder of any material contained on our site and intend to remove it, please contact our site administrator for approval.
© 2016-2026 All site design rights belong to S.Y.A.