Mobile User Experience: Patterns to Make Sense of it All (2014)
APPENDIX D. Mobile Performance Results from Chapter 9
Testing Methodology
These mobile performance tests were created using the Marlin Mobile Performance Monitoring tool. Here are the characteristics of this test.
■ Created pages coded in HTML5 for each pattern example
■ Used three Android devices (smartphones and tablets)
■ Ran the test 12 times a day
■ Ran the test over a period of 12 days
■ All devices were connected to a mobile carrier
■ Pages hosted on the same server
■ Did not remove outliers
Performance Pattern #1
URLs Tested
1. Example of page with long comments http://mobileuxbook.com/pattern1/longcomments.html
2. Example of page with long comments (with user profile images) http://mobileuxbook.com/pattern1/longcomments2.html
3. Example of page with paginated comments http://mobileuxbook.com/pattern1/shortcomments.html
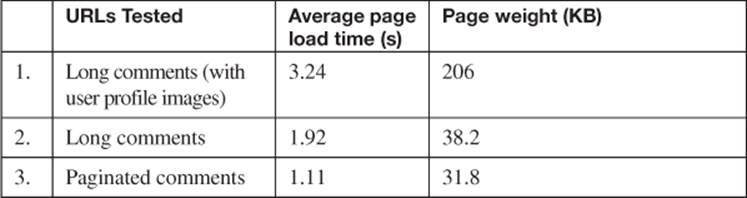
Results
Average Page Load Time (Seconds): (from High to Low)
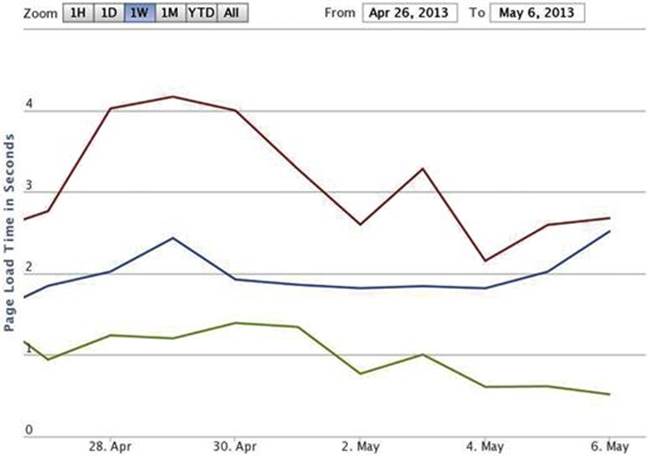
Page Load Time (Seconds), Source Marlin Mobile.
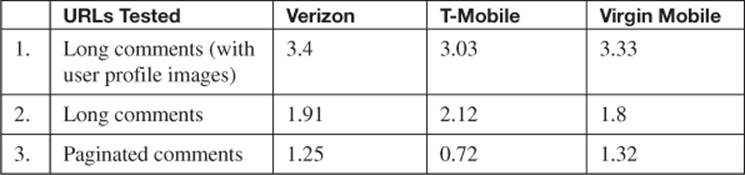
Average Page Load Time by Carrier (Seconds), (from High to Low)
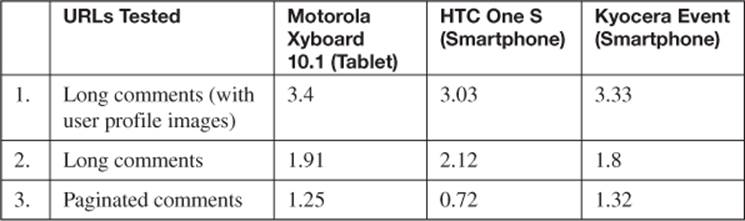
Average Page Load Time by Device (Seconds), (from High to Low)
Performance Pattern #2
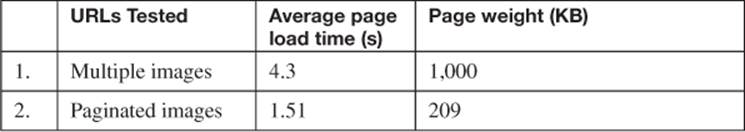
URLs Tested
1. Example of page with multiple images—4.3 s http://mobileuxbook.com/pattern2/longimages.html
2. Example of page with paginated images—1.51 s http://mobileuxbook.com/pattern2/shortimages.html
Results
Average Page Load Time (Seconds), (from High to Low)
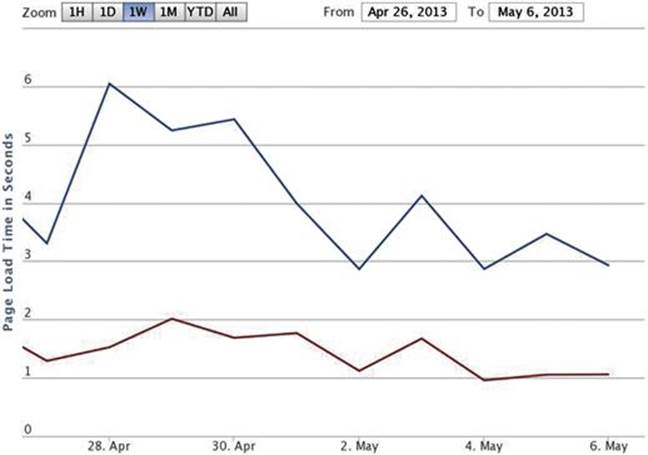
Page Load Time (Seconds), Source Marlin Mobile.
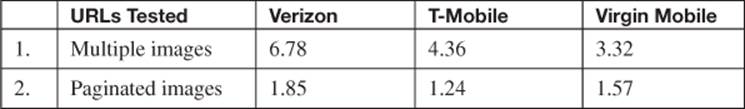
Average Page Load Time by Carrier (Seconds), (from High to Low)
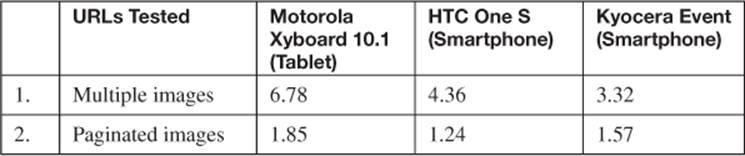
Average Page Load Time by Device (Seconds), (from High to Low)
Want to Learn More about Mobile Performance Monitoring on Real Devices?
Visit www.marlinmobile.com to learn more about how you can test your mobile web pages on real devices.
All materials on the site are licensed Creative Commons Attribution-Sharealike 3.0 Unported CC BY-SA 3.0 & GNU Free Documentation License (GFDL)
If you are the copyright holder of any material contained on our site and intend to remove it, please contact our site administrator for approval.
© 2016-2026 All site design rights belong to S.Y.A.