Swift Development with Cocoa (2015)
Chapter 17. Instruments and the Debugger
As anyone who’s written software knows, designing and implementing the features of an application is only a fraction of the work. Once the app’s done and performs all the tasks it’s meant to do, you need to make sure that it runs well.
Performance is a feature that many developers neglect, but it’s something that influences people’s decisions to use your software or not. Many of our friends and family prefer to use Pages instead of Microsoft Word, because despite the relative lack of features in Pages, it’s a more nimble and zippy application.
Not paying attention to performance also has more tangible implications for your code. For example, an application that is careless with memory will end up being force-quit by the system on iOS, and an app that consumes lots of CPU time will exhaust your user’s battery and make the system run hot. There are other resources as well that your application needs to be careful with, including network bandwidth and disk space.
To help monitor your application’s performance and use of resources, the developer tools include Instruments, an application that’s able to inspect and report on just about every aspect of an application.
Instruments works by inserting diagnostic hooks into a running application. These hooks can do things like analyze the memory usage of an application, monitor how much time the app spends in various methods, and examine other data. This information is then collected, analyzed, and presented to you, allowing you to figure out what’s going on inside your application.
In this chapter, you’ll learn how to get around in Instruments, how to analyze an application, and how to spot and fix memory issues and performance problems using the information that Instruments gives you. You’ll also learn how to use Xcode’s debugger to track down problems and fix them.
Getting Started with Instruments
To get started with Instruments, we’ll load a sample application and examine how it works.
The application that we’ll be examining is TextEdit, which is the built-in text editor that comes with OS X. TextEdit is a great sample app to modify because it’s a rather complex little app—it’s effectively an entire word processor, with support for images, Microsoft Word import and export, and a lot more. You’ve probably used it before; if you haven’t, you can find it by either searching Spotlight for “TextEdit” or by looking in the Applications folder.
The source code to TextEdit is available from the Apple Mac Developer site and you can find it by going to http://bit.ly/textedit_src.
NOTE
TextEdit is written in Objective-C, not Swift. The reason we’re including it in a book about Swift is that this is one of the more complex pieces of sample code available, as well as being a real-world application that millions of people use every day.
The Developer site also contains a great deal of other example code and resources in the Mac Developer Library.
Here are the steps you should follow:
1. Double-click the TextEdit.xcodeproj file to open it in Xcode.
2. Run the application. Click the Run button or press ⌘-R.
The app will launch. Play around with it by writing some text, and saving and opening some documents.
We’ll now use Instruments to examine what TextEdit is doing in memory as it runs.
3. Quit TextEdit. You can do this by pressing ⌘-Q or choosing Quit from the TextEdit menu.
4. Tell Xcode to profile the application. To do this, choose Profile from the Product menu. You can also press ⌘-I.
Xcode will rebuild the application, and then launch Instruments. When Instruments launches, it presents a window that lets you choose which aspects of the app you’d like to inspect (Figure 17-1).
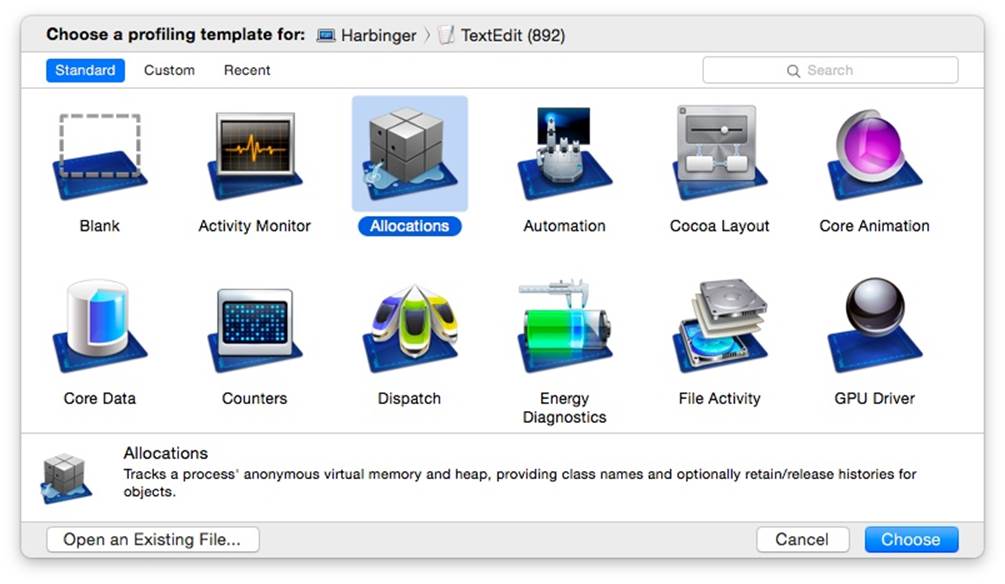
Figure 17-1. The Instruments template chooser
5. Select the Allocations instrument, and click Choose. Instruments will launch TextEdit; you can start recording memory usage information from the application by clicking the Record button. You can also press ⌘-R or choose Record Trace from the File menu.
At this point, you’re in Instruments proper, so it’s worthwhile to stop and take a look around (Figure 17-2).
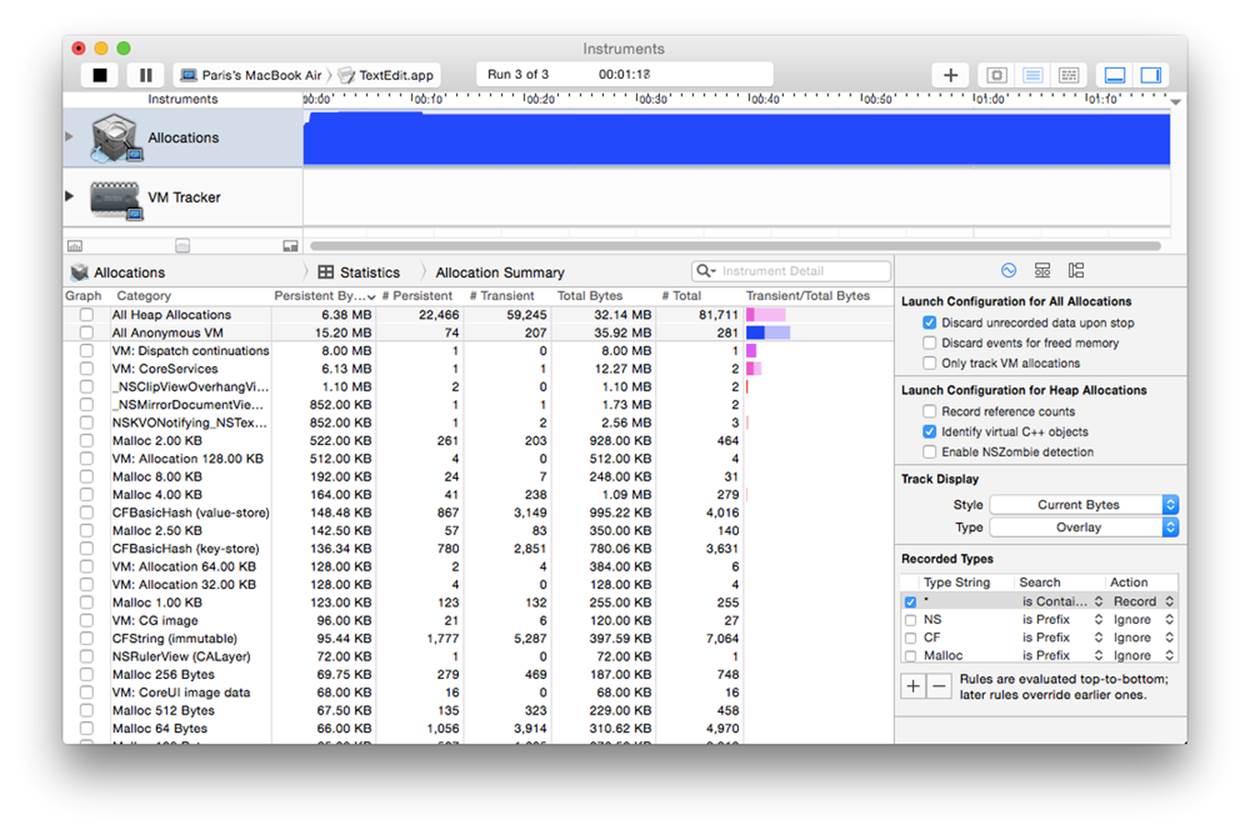
Figure 17-2. The Instruments window
The Instruments Interface
When you work with Instruments, you’re working with one or more individual modules that are responsible for analyzing different parts. Each module is also called an instrument—so, for example, there’s the Allocations instrument (for measuring memory performance), the Time Profiler instrument (for measuring runtime performance), the VM Tracker instrument (for measuring memory consumption), and so on.
Each instrument is listed in the Instruments pane at the top of the window. As an application runs, information from each instrument is shown in the Track pane. If you select an instrument in the Instruments pane, more detailed information is shown in the Detail pane at the bottom of the window. The Track pane is useful for giving you a high-level overview of the information that is being reported, but the majority of useful information is kept in the Detail pane.
The Detail pane shows different kinds of information, depending on the instrument. To choose which information to present, you can use the navigation bar, which separates the window horizontally.
To configure how an instrument collects its data, you can change options in the Inspector at the bottom-right of the window. From there, you can set the various options that affect what information the instrument collects.
In addition to allowing you to control how an instrument works, you can access additional information about any selected information through the Inspector. You do this by clicking the rightmost icon at the top of the Inspector to open the Extended Detail Inspector. This pane, as its name suggests, displays extended detail information on whatever is selected in the Detail pane. For example, if you’re using the Allocations instrument, the Detail pane could be showing the objects currently active in your application. You could then select a specific object, and the Extended Detail Inspector would show exactly where that object was created in your code.
You can also control what Instruments is doing through the Record buttons. The large red button in the center is the main one that we care about—clicking on it will launch the application that’s currently under investigation, and start recording data. Clicking it again will quit the application and stop recording, though the data that was collected remains. If you click Record again, a new set of data will be recorded—if you want to see past runs, you can navigate among them by clicking on the arrows in the display in the middle of the toolbar.
NOTE
To open and close the various panes, click on the view buttons at the righthand side of the toolbar.
Observing Data
We’ll now do some work inside TextEdit and watch how the data is collected:
1. Start recording, if the app isn’t open already. If TextEdit isn’t running, hit the Record button to launch it again.
When the application starts up, it immediately allocates some memory as it gets going. When it needs to store more information, it allocates more. We’ll now cause the app to start allocating more memory by adding text to the document.
2. Enter some text in the document. Go to the TextEdit window and start typing. Because text isn’t very large, we won’t see much of a difference in what’s being displayed unless we enter quite a lot of text.
So, to quickly enter lots of text, type something, select it all, copy, and paste. Then select all again, and copy and paste again. Repeat until you’ve got a huge amount of text in the document.
3. Observe the memory usage of TextEdit climbing. Go back to Instruments, and you’ll notice that the amount of memory used by the application has increased quite a lot (Figure 17-3).
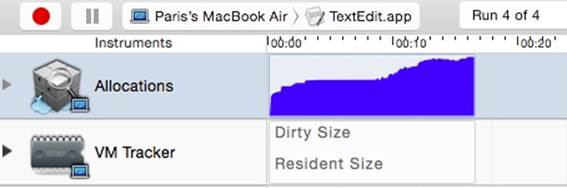
Figure 17-3. Instruments records an increase in memory usage as the application is used
Here, the consumption of memory is OK, because we deliberately stress-tested the application. However, if you see similar spikes in memory usage in your application from regular use, you probably have a problem to solve.
Adding Instruments from the Library
While Instruments provides a selection of templates that you can use to get started (such as the Allocations template we used earlier), you can add more instruments to your trace to help hunt down issues.
To add an instrument to your trace document, select the instrument you want to use from the Library. To open the Library, click the Library button, choose Library from the Window menu, or press ⌘-L (see Figure 17-4).
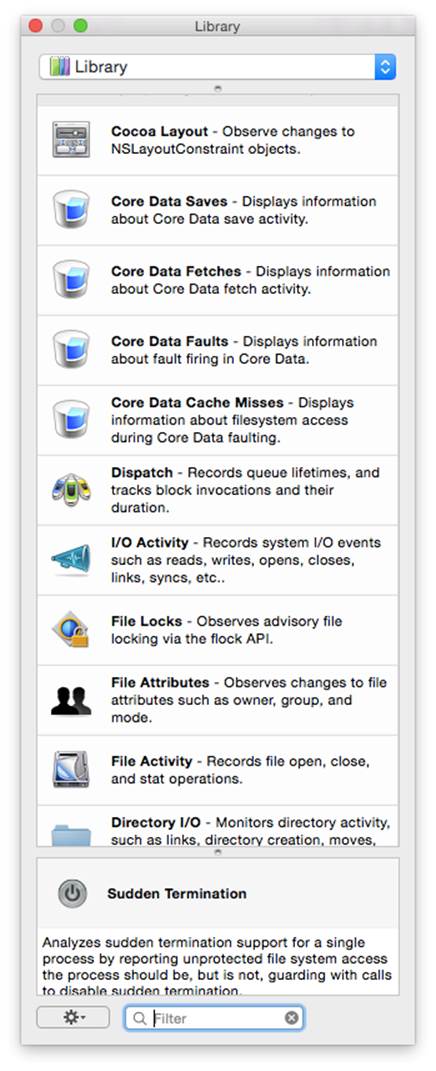
Figure 17-4. The Instruments Library
The Library lists all of the available instruments that you can use, as well as information on what each one does. To add an instrument to your trace, drag and drop an instrument into the Instruments pane, or double-click the instrument.
NOTE
Not all instruments work on all platforms. For example, the OpenGL ES analyzer instrument only works on iOS.
Combining different kinds of instruments allows you to zoom in on specific problems. For example, if your application is being slow and you think it’s because it’s loading and processing lots of information at once, you can use a Reads/Writes instrument alongside a Time Profiler. If the slowdowns occur while both of these instruments indicate heavy activity, then your slowdowns are being caused by your application working the disk too hard while using lots of CPU time.
Fixing Problems Using Instruments
To demonstrate how to detect and solve problems using Instruments, we’ll create an application that has a large memory problem, and then use Instruments to find and fix it.
This iOS application will create and display a large gallery of images and let the user smoothly scroll between them. We’ll develop and run it on the iOS Simulator, and then see how well it does on a real device.
The application will consist of a single scroll view, which will have a number of image views added to it. The user will be able to scroll around inside the view to see the different images. Here are the steps you should follow to create the application:
1. Create a new, single view iOS application and call it MemoryDemo.
2. Open Main.storyboard in the project navigator.
3. Add a scroll view to the window. Make it fill the entire screen. While you have it selected, turn Paging Enabled on. This means that the scroll view will behave much like the home screen on the iPhone, where all scrolling snaps to the width of the scroll view.
4. Connect the scroll view to the view controller class. Open the assistant, and Control-drag from the scroll view into ViewController. Create a new outlet called imagesContainer.
5. Add the code that sets up the application. Add the following code to ViewController.swift:
6. func loadPageWithNumber(number:NSInteger) {
7.
8. // If an image view already exists for this page, don't do anything
9. if self.imagesContainer.viewWithTag(number) != nil {
10. return
11. }
12.
13. // Get the image for this page
14. let image = self.imageWithNumber(number)
15.
16. // Create and prepare the image view for this page
17. let imageView = UIImageView(image: image)
18. var imageViewFrame = self.imagesContainer.bounds
19. imageViewFrame.origin.x = imageViewFrame.size.width * CGFloat(number - 1)
20. imageView.frame = imageViewFrame
21.
22. // Add it to the scroll view
23. self.imagesContainer.addSubview(imageView)
24.
25. // Mark this new image view with a tag so that we can
26. // easily refer to it later
27. imageView.tag = number
}
func imageWithNumber(number: Int) -> UIImage {
// Inset the image by 30px so that we can see the rounded corners
var imageRect = self.imagesContainer.frame
imageRect.inset(dx: 30, dy: 30)
UIGraphicsBeginImageContext(imageRect.size)
// Draw a rounded rectangle
let path = UIBezierPath(roundedRect: imageRect, cornerRadius: 10)
path.lineWidth = 20
UIColor.darkGrayColor().setStroke()
UIColor.lightGrayColor().setFill()
path.fill()
path.stroke()
// Draw the number
let label = "\(number)"
let font = UIFont.systemFontOfSize(50)
let labelPoint = CGPoint(x: 50, y: 50)
UIColor.whiteColor().setFill()
let labelAttributes = [NSFontAttributeName: font]
label.drawAtPoint(labelPoint, withAttributes:labelAttributes)
// Get the finished image and return it
let returnedImage = UIGraphicsGetImageFromCurrentImageContext()
UIGraphicsEndImageContext()
return returnedImage
}
override func viewDidLayoutSubviews () {
// Create 10,000 images
let pageCount = 10000
// Load them into the scroll view
for i in 1...pageCount {
self.loadPageWithNumber(i)
}
// Tell the scroll view about its new content size
var contentSize = CGSize()
contentSize.height = self.imagesContainer.bounds.size.height
contentSize.width = self.imagesContainer.bounds.size.width
* CGFloat(pageCount)
self.imagesContainer.contentSize = contentSize
}
28.Run the application. The application runs fine on the simulator, but if you try to run it on the device, it will appear to hang for a while and finally exit without showing the app.
To find out why this happens, we’ll run this inside Instruments:
1. Set the Scheme to launch on your iOS device. We want Instruments to run on the device, not the simulator. (If you don’t have an iOS device to test on, that’s OK—you can still use the simulator, but the numbers you see in Instruments won’t be representative of how it would work on a real iPhone or iPad.)
2. Launch the application inside Instruments. Do this by choosing Profile from the Product menu, or pressing ⌘-I.
3. Select the Allocations template. We want to keep an eye on how memory is being used. Select the Allocations template, and click Choose.
4. Click the Record button, and watch the results. Instruments will plot the memory usage of the application as it attempts to start up (and then crashes).
As the application launches, you’ll notice that the amount of memory used by the app steadily increase. After a while, the app will start receiving memory warnings (you’ll see a bunch of black flags pop up in the timeline), and will then quit.
Clearly, the problem is that the application consumes too much memory. There’s an additional problem—the number of images being drawn during startup is causing a huge slowdown. The application is creating and inserting a thousand image views onto the screen. Each image displayed by the image views needs to be kept in memory, which means that the app rapidly runs out of space and is forced to exit.
A better way to handle this is to only display the images that the user can see, rather than loading all of them at once. At minimum, there are only three images that need to be present—the one currently being shown, and the two on either side of it. Because of the size of the image views, it’s possible for this app to be showing one or two images at the same time, but never three.
To fix the problem, therefore, we need to make the application update the image views while the user is scrolling. If an image view isn’t visible by the user, the app should remove it from the screen, which frees up memory.
To do this, we’ll add a method that makes sure that the image views for the previous, current, and next pages are present, and then removes all other image views. This method will be called every time the scroll view scrolls, meaning that as far as the user is concerned, every image is on the screen when she needs to see it.
First, we’ll set up the view controller to be notified when the scroll view scrolls, and then add the code that checks the image views. Finally, we’ll update the viewDidLoad method to make it only display the first set of image views:
1. Open the storyboard and make the scroll view use the view controller as its delegate.
Control-drag from the scroll view onto the view controller’s icon. Choose “delegate” from the list that pops up.
2. Open ViewController.swift. We now need to make the class conform to the UIScrollViewDelegate protocol. Replace the class’s definition with the following line of code:
class ViewController: UIViewController, UIScrollViewDelegate {
3. Next, we’ll update the code to update the collection of image views when the scroll view scrolls.
Add the following methods to ViewController.swift:
func updatePages() {
var pageNumber = Int(imagesContainer.contentOffset.x /
imagesContainer.bounds.size.width + 1)
// Load the image previous to this one
self.loadPageWithNumber(pageNumber - 1)
// Load the current page
self.loadPageWithNumber(pageNumber)
// Load the next page
self.loadPageWithNumber(pageNumber+1)
// Remove all image views that aren't on
// this page or the pages adjacent to it
for imageView in imagesContainer.subviews {
if imageView.tag < pageNumber - 1 ||
imageView.tag > pageNumber + 1 {
imageView.removeFromSuperview()
}
}
}
func scrollViewDidScroll(scrollView: UIScrollView!) {
self.updatePages()
}
4. Replace the viewDidLayoutSubviews method with the following code:
5. override func viewDidLayoutSubviews () {
6.
7. // Create 10,000 images
8. let pageCount = 10000
9.
10. self.updatePages();
11.
12. // Tell the scroll view about its new content size
13. var contentSize = CGSize()
14. contentSize.height = self.imagesContainer.bounds.size.height
15. contentSize.width = self.imagesContainer.bounds.size.width
16. * CGFloat(pageCount)
17.
18. self.imagesContainer.contentSize = contentSize
}
Once you’ve made these changes, try running the app on the device again. You’ll find that its behavior is identical to how it used to run, with the added bonus that the application doesn’t run out of memory and crash on launch.
Retain Cycles and Leaks
The Automatic Reference Counting feature built into the compiler is also great at reducing problems caused by memory leaks, but it’s not foolproof.
Automatic Reference Counting releases an object from memory when the last strong reference to that object goes away. However, if two or more objects have strong references to each other, the number of strong references to each object will never be zero, and the objects will stay in memory—even if nothing else in the application has a reference to those objects. This is called a retain cycle, so named because if you were to draw a graph showing how each object refers to each other, you’d end up drawing a circle.
You can figure out if you have a retain cycle by using Instruments. When you have a retain cycle, objects will remain in memory, which means that if you repeat the process that creates the retain cycle, your app will increase in memory and never go down.
To find out if this is happening, follow these steps:
1. Launch your app in Instruments, and use the Allocations template.
2. Use your app for a bit. Go in and out of screens, tap buttons, and generally use the app as it’s meant to be used.
3. Click the Mark Generation button (see Figure 17-5) in the Display Inspector, which you can access by pressing Command-2. Instruments will record how much memory is currently being used.
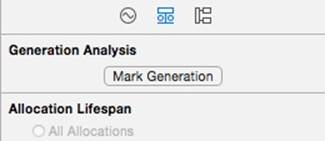
Figure 17-5. The Mark Generation button
4. Perform a task in the app, and then return to the point that you were at when you marked the generation. The idea here is that you’ve performed some task, and everything should have cleaned up after itself, so there shouldn’t be any growth in the amount of memory that the app is using.
5. Click Mark Generation again. Instruments will again record how much memory is being used, and compare it to the previous generation. In the Growth column, Instruments shows the difference between this generation and the previous generation (see Figure 17-6).
If this number is not zero, then the act of performing that task and returning to the starting point meant that the app was left with more memory.
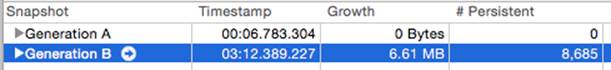
Figure 17-6. The Growth column, showing a rise in memory since the last generation
6. Expand the generation by clicking on the arrow at the left, and you’ll see the list of objects that are left behind (see Figure 17-7). You can double-click on these to see the point in your code at which they were created.
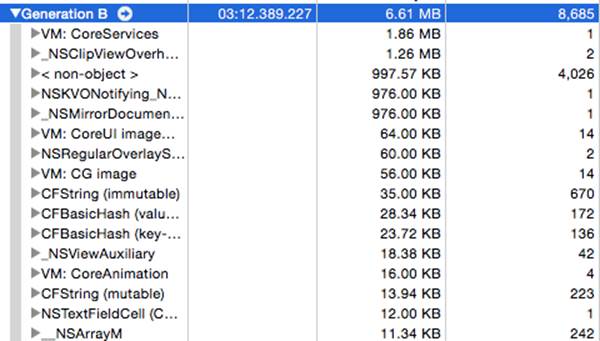
Figure 17-7. The list of objects created in this generation that are still in memory
Using the Debugger
Xcode includes a source debugger called LLDB. Like all debuggers, LLDB allows you to observe your code as it runs, set breakpoints and watchpoints, and inspect the contents of memory.
The debugger is deeply integrated into Xcode, and Xcode lets you create very specific actions to run when your code does certain things. You can, for example, ask Xcode to speak some text the third time that a specific line of code gets run.
Setting Breakpoints
There are a few ways to set a breakpoint in Xcode. The most common method is to set a breakpoint on a line of code—when execution reaches that point, the debugger stops the program.
To set a breakpoint at a line, click the gray gutter at the left of the code editor. A blue breakpoint arrow will appear (Figure 17-8).
NOTE
It’s easier to add breakpoints, and navigate your code in general, if you turn on line numbers in Xcode. To do this, open Preferences by pressing ⌘-, and open the Text Editing tab. Turn on the Line Numbers checkbox.
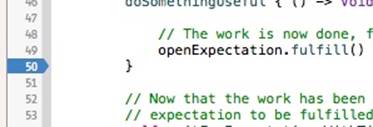
Figure 17-8. A breakpoint
After a breakpoint has been added to your code, you can drag the arrow to move the breakpoint. To remove the breakpoint, drag it out of the gutter.
When the program hits a breakpoint, Xcode shows the backtrace of all threads in the debug navigator. From there, you can see how a breakpoint was hit, and what functions were called that led to the program hitting that breakpoint.
Controlling program flow
When the program execution hits a breakpoint, you can choose to simply resume execution, or step through the code line by line.
To control program flow, you use the buttons in the debugger bar. The debugger bar is at the top of the debug area, which you can open and close by clicking the middle segment of the View control, at the top right of the toolbar (Figure 17-9).
![]()
Figure 17-9. The debugger bar
From left to right, the buttons in the debugger bar perform the following actions:
§ Close the debug area
§ Pause or resume execution
§ Step Over (continue to the next line of code)
§ Step Into (if the current line of code is a method call, continue into it)
§ Step Out (continue until execution leaves the current method)
When you add a breakpoint, it appears in the breakpoints navigator. From there, you can see all of the currently set breakpoints—you can also jump directly to a breakpoint, disable it, or delete it.
Custom breakpoints
Normally, a breakpoint just pauses execution when hit. However, you can customize your breakpoints to perform specific actions.
To customize a breakpoint, right-click the arrow or the breakpoint’s entry in the breakpoints navigator, and choose Edit Breakpoint. The Edit Breakpoint window will appear (Figure 17-10).
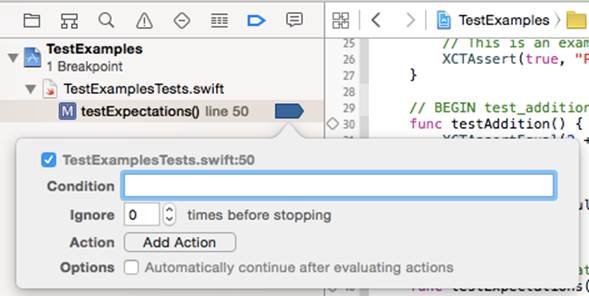
Figure 17-10. Editing a breakpoint
The Edit Breakpoint window allows you to customize when the breakpoint should trigger and what happens when it does. You can also indicate how many times the breakpoint should be ignored, what actions the breakpoint should run, and whether the breakpoint should pause the execution of the program.
Adding actions to a breakpoint allows you to run some AppleScript, speak a line of text, play a sound, or other actions. To add an action, click the “Click to add an action” button and choose the action that should be run.
This is a tremendously flexible feature, as it allows you to get additional information about how your program is running without the program stopping and starting.
Special breakpoints
The breakpoints navigator also allows you to add special breakpoints for exceptions, symbols, OpenGL ES Errors, and Test Failures.
An exception breakpoint stops the program when an exception is thrown. For example, if you have an NSArray with two items and you try to access the third one, an exception is thrown and your program exits. Normally, Xcode stops the program at the point where the exception is caught, which isn’t often the place where it is thrown. This makes it difficult to work out where the problem is. To solve this problem, you can add an exception breakpoint that stops the program at the instant the exception is thrown.
A symbolic breakpoint stops the program when a specific, named function or method is entered. This is mostly useful when you want to stop execution at a function that you might not have the source code for, and then view the backtrace.
An OpenGL ES Error breakpoint stops the program whenever an OpenGL ES error is encountered. This is mostly useful when debugging graphics-heavy iOS applications such as games.
A Test Failure breakpoint stops the program when a test assertion fails. This breakpoint is designed to be used in conjunction with unit tests, letting you see exactly when, where, and hopefully why your tests are failing.
To add one of the special breakpoints, click the + button at the lower left of the breakpoints navigator. Then choose which type of breakpoint you want to add, and Xcode asks you to configure the new breakpoint (Figure 17-11).
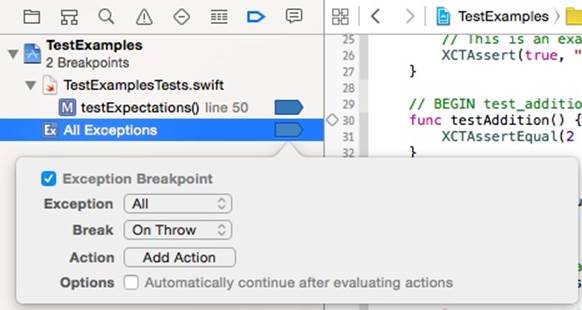
Figure 17-11. Configuring an exception breakpoint
If you’re creating an exception breakpoint, you can choose whether you want to stop on exceptions thrown by Objective-C code (remember, lots of iOS and OS X is still written in Objective-C), C++ exceptions (likewise!), or both. You can also choose whether the breakpoint should stop when the exception is thrown or caught.
Inspecting Memory Contents
When the program is stopped in the debugger, you can see the current state of objects and variables in memory.
The variables view is the lefthand section of the debug area. When the program is stopped, the variables view shows the variables that exist at that point.
The variables view shows the value of the variables. If the variables are simple types like Int or Bool, their values are shown; if the variables are things like arrays, then summary information about them is shown, like the content of the string or the number of items in the array.
If you use the flow control buttons while the program is stopped, the variables view updates to show any changes. If a variable changes, it gets highlighted in blue.
The variables view also allows you to quickly send the description message to any object and see the results. To do this, right-click on a variable and choose Print Description.
Working with the Debugger Console
At the righthand side of the debug area is the console. The console is the command-line interface to the debugger, and allows you to directly access some of the debugger’s powerful, lower-level features.
Working with LLDB via the console is a subject large enough to fill its own book, but in this section we’ll talk about how to use the console for its arguably most powerful purpose: running custom code to work with your program’s variables.
Let’s assume that the debugger has stopped at a breakpoint in a method. In this method, myArray is an array, and you want to check its contents.
To see how many items are in myArray, you’d type this into the console:
print myArray.count
Note the lack of a semicolon. In the console, you don’t put a semicolon at the end of lines.
NOTE
When you call a method in the debugger, you must specify what type of data the method will return. In the preceding example, count returns an int.
You can send arbitrary messages to objects. For example, if you wanted to get the second object in the myArray array, you’d do this:
print-object myArray.objectAtIndex(1)
The print-object command takes an object and sends it a description message. It then returns the string that comes back.
View Debugging
Xcode lets you debug not only your code, but also your views. Using the view debugging feature, you can peel back the contents of your screens to get a better understanding of how the screen is laid out.
Using the view debugging feature, you can look behind views and find out what they’ve covering up, find out if any views aren’t visible because they’re off-screen, and get information about the constraints that are defining the view’s position and size. This makes them great for spotting and solving problems where you’ve added a view, but it isn’t showing up on the screen.
To use the view debugging feature, simply run any application from Xcode.
NOTE
View debugging works on both iOS and OS X.
Once the app is running, click the View Debugging button, in the debugger controls bar (see Figure 17-12)
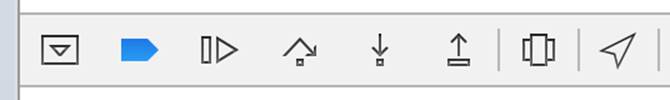
Figure 17-12. The debugging controls (the View Debugging button is the second from the right)
Once you click that button, the application will be paused, and you’ll be presented with the view debugging screen. This screen takes a snapshot of the app’s current state, but exploded out into each of its different views, as shown in Figure 17-13.
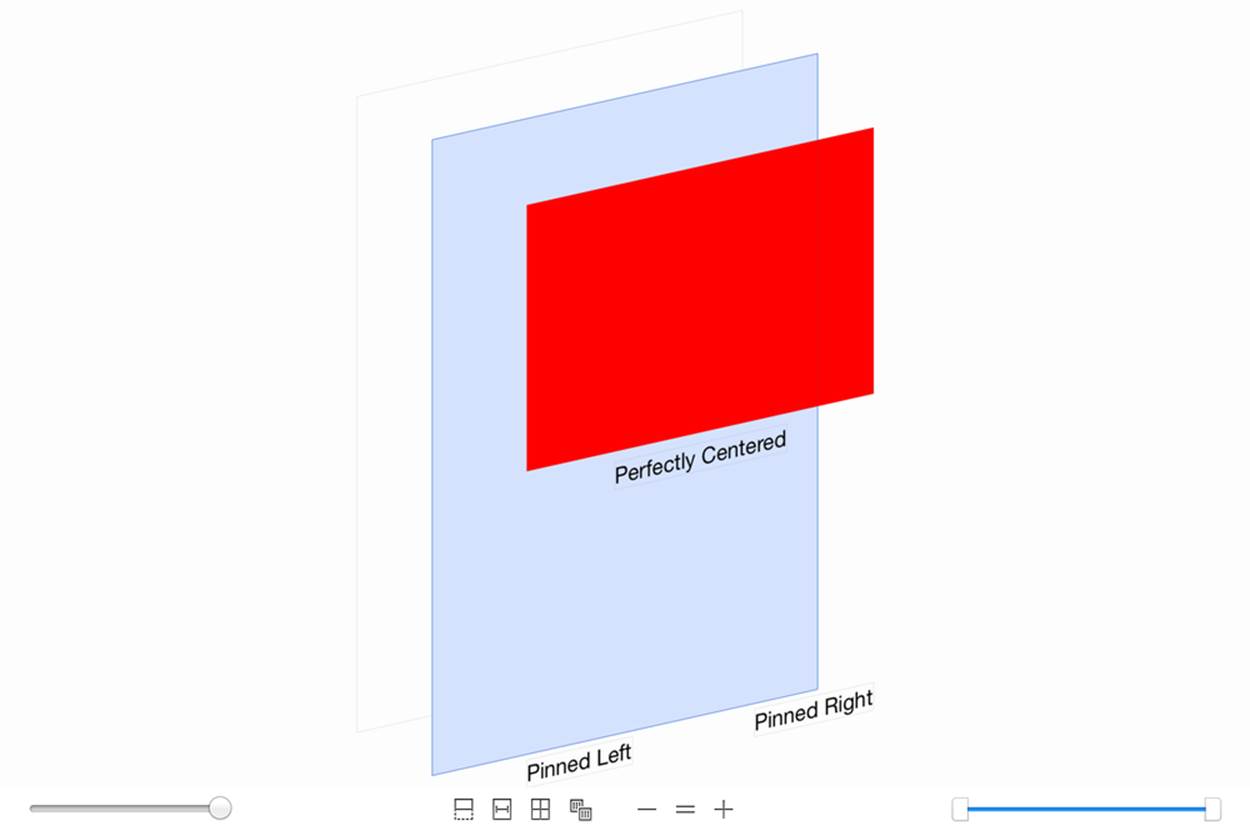
Figure 17-13. The exploded view
When you’re in the view debugging screen, you can click and drag to rotate the entire scene, and get different views on how the screen is laid out.
You can also click individual views to get additional information about them, including their position and size, as well as any object-specific information (e.g., clicking a label will reveal its text). You can also use the slider at the lower left of the screen to increase and decrease separation of views.
At the bottom center of the screen, you’ll find controls that determine what the view debugging screen will show you (seen in Figure 17-14.)

Figure 17-14. The view debugging options
Each of these buttons let you configure the view debugging view. From left to right:
1. Toggles whether content that’s clipped by something (like another view) is shown
2. Toggles whether constraints are shown
3. Resets the view to normal
4. Lets you select whether you see view contents, wireframes, or both
The Testing Framework
Xcode comes bundled with XCTest, a full-featured testing system for iOS and OS X applications. XCTest allows you to define unit tests for your code—small, independent blocks of testing code that are designed to be run all at the same time, to verify that your code is behaving the way you want it to.
Testing is an incredibly important part of application development. When developing, you’ll often find yourself ensuring that the current part of the app that you’re working on is functioning correctly, and has no bugs; however, this can make you focus too closely on a single piece, without taking other areas in your app into consideration.
When you write tests for your code, they’re kept around after you’re done working on the feature you’re focusing on at the moment. This means that when your tests are run, all of your old tests run as well—which means that you can ensure that your new changes didn’t break anything.
Tests give you peace of mind. By automating the process of ensuring that your app works, you don’t have to worry as much when releasing a view version.
On top of this, creating tests is incredibly simple. When you create a new project in Xcode, a test suite is also created. Test suites contain all of your application’s code.
You can see this in action by following these steps:
1. Create an app. It doesn’t matter whether it’s an iOS app or an OS X app. Name it TestExamples.
2. Find the test suite. In the project navigator, find the TestExamplesTests folder, which contains the project’s test files.
3. Open the test case file. Find and open the TestExamplesTests.swift file. Inside this file, you’ll add your test methods.
Writing Tests
Writing tests using XCTest is very simple. To create tests, you create a subclass of the XCTestCase class, and then add individual test methods to that subclass. In the preceding example, Xcode has created the TestExamplesTests file for you, but it’s straightforward to add your own.
The XCTestCase class has three special methods that you add—the setUp method, the test methods, and the tearDown method:
§ The setUp method is run immediately before each test, and serves as the location to set up the environment needed for each test.
§ Any method whose name begins with test, and takes no parameters and returns no value, is considered a test method. Inside this method, you write code that checks to see if your application’s working the way you want it to.
§ The tearDown method is run immediately after each test, and is your opportunity to tidy up after the test is run.
Inside test methods, you write code that exercises some part of your app—creating objects, running methods, and so on—and then verify that the results of that code matches what you expect. You verify these results using special methods called assertion functions.
Assertion functions are functions that check to see if a certain condition is true. If it’s not, the test fails. For example, to test whether addition works as you expect, you can add a test method that looks like this:
func testAddition() {
XCTAssertEqual(2 + 2, 4, "2 + 2 should equal 4")
}
You can also assert many other conditions, such as a Boolean value being true or false, two objects being equal, and many other states. In each case, you provide the condition as well as a short text string explaining what the test represents; if the test fails, Xcode uses this string to explain to you what went wrong. You can have multiple assertions in a single test method.
To run your tests, hit Command-U, or open the Product menu and choose Test. The app will build and start up, and all tests will run. The app will then automatically quit.
If you want to run a specific test, click the diamond shape in the sidebar that’s next to the test. When you do this, the app builds and starts, and then runs that single test.
NOTE
The most effective way to use tests is to write tests before you write the code itself. If you have a feature you want to implement, write a test that checks the result of your code, as well as empty methods that return fake data. When you run the tests, you’re expecting the tests to fail. (If they don’t fail, you have something to investigate!)
Once you have a set of failing tests, you can then begin implementing your code proper. You’re done once your tests are all passing.
Writing code in this way forces you to think about how the code you’re writing will be used. When you write a method, you’ll spend more time writing code that uses the method than writing the method itself. If you begin your designs with usage in mind, you’ll write better code.
Writing Asynchronous Tests
Some code takes time to run. For example, your app might include an animation that runs some code when complete, or it might download a file in the background and then process it. The XCTest system can handle this kind of test using expectations.
An expectation is an object that represents the fact that the system expects a certain condition to be fulfilled later. In the case of the background download example, your test might be that you want to ensure that the file downloaded correctly. In this case, you’d create an expectation just before starting the download, and then when the download is done, you’d mark the expectation is fulfilled. If the expectation as never fulfilled, then the test fails.
Here’s an example of how to use expectations in your tests:
func testExpectations() {
let openExpectation =
self.expectationWithDescription("Something useful happened");
// Perform some work that might take a bit of time
// (This example method takes a block that runs when the work is done)
doSomethingUseful { () -> Void in
// The work is now done, fulfill the expectation
openExpectation.fulfill()
}
// Now that the work has been kicked off, wait 1 second for the
// expectation to be fulfilled
self.waitForExpectationsWithTimeout(1.0) { (error) in
println("The expectation wasn't fulfilled in time! \(error)")
}
}
Performance-Testing Blocks with Tests
The measureBlock method allows you to test the performance of a piece of your code. When you call measureBlock, you provide a block of code that exercises the code you want to measure. The testing system will repeatedly run that code, and measure the amount of time taken each time. When this completes, you’re given a report that indicates how much time was taken, on average:
func testPerformanceExample() {
// This is an example of a performance test case.
self.measureBlock() {
// Do some useful work; this block will be run multiple times, and
// the time taken to run it will be measured.
}
}
Debug Gauges
The debug gauges allow you to quickly get information about how your app is using system resources. Specifically, you can get information about the app’s CPU load, memory usage, and how heavily it’s using the disk and network. In all four of these cases, the less the app is using, the better.
To see the debug gauges in action, run any application, and then open the debug navigator, which is the third button from the right in the Navigator panel (see Figure 17-15).
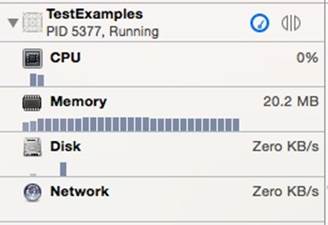
Figure 17-15. The debugging gauges
Debug gauges supplement the heavier functionality provided by Instruments. The gauges aren’t as good at letting you view different kinds of usage side by side, but they save time in launching and dealing with Instruments.
Performance Optimization
When writing any application, it’s vital that you consider performance. When an application performs well, it runs faster, consumes less system resources, and creates a better overall user experience. For example, if your application is CPU-heavy, you’ll end up draining the user’s battery, and generally ruining her day.
The specific techniques involved in ensuring that your app performs well depend on the details of what your app does; however, the following are some general tips to make your application perform well:
§ Run code on background queues as much as possible, to give the system opportunites to put it on other cores. Use NSOperationQueue to let the system decide how to run the code—it’s a lot more efficient to run two cores than it is to run a single core for twice that time.
§ Use less memory. Reduce the number of images that your application keeps in memory, and remove items from memory when they’re not needed. This is especially important on iOS, where running out of memory means that your application will be terminated by the system.
§ Delay reading and writing data until it’s actually needed. While pre-caching is fine in principle, there’s often no reason to spend time loading data from disk into memory “just in case.” Load the data that your app needs only when there’s a very good chance that the user will actually need to use it.
§ Performance-test your code. While performance is often a matter of feeling fast, using performance tests in your code allows you to be objective about whether the changes to your code are improving or worsening your performance.