iOS Components and Frameworks: Understanding the Advanced Features of the iOS SDK (2014)
Chapter 25. Debugging and Instruments
Unlike most other chapters in this book, this chapter has no associated sample code and there is no project. Throughout this book the target has been implementing advanced features and functionality of the iOS SDKs. This chapter focuses on what to do when everything goes wrong. Debugging and increasing performance of any piece of software is a vital and sometimes overlooked step of development. Users expect an app to perform quickly, smoothly, consistently, and without errors or crashes. Regardless of the skill level of a developer, bugs will happen, crashes will be introduced, and performance won’t be everything it can be. The material covered here will assist in developing software that gets the most out of the system and performs to the highest possible standards.
Introduction to Debugging
“If debugging is the process of removing bugs, then programming must be the process of putting them in.” –Edsger W. Dijkstra
Computers are complex—so complex that very few, if any, people understand how they work on all levels. Very few developers understand programming in binary or assembly, even though that is what the machine itself understands. This complexity means that things will go wrong even if everything is seemingly done correctly. Bugs relating to issues such as race conditions and thread safety are hard to plan for and can be even harder to troubleshoot.
When we leverage the technology provided by the debugger, the difficulty of debugging software becomes drastically easier. From using custom breakpoints to parameters such as NSZombies, most of the hard work of debugging can be turned into a quick task.
The First Computer Bug
In 1947, the first computers were making their rounds through large corporations, universities, and government institutes. Grace Murray Hopper was working on one of these early systems at Harvard University, a Mark II Aiken Relay Calculator. On the 9th of September of 1947, the machine began to exhibit problems and the engineers investigated. What they found was surprising but not entirely unexpected when computers were large machines taking up entire rooms. A simple household moth had become trapped between the points of Relay #70 in Panel F of the Mark II Aiken Relay Calculator. The moth was preventing the relay from functioning as expected, and the machine was quite literally debugged. The engineers knew they had a piece of history and they preserved the moth with a piece of tape and the handwritten note, “First actual case of bug being found” (see Figure 25.1). Today, the first computer bug can be found at the Naval Surface Warfare Center Computer Museum at Dahlgren, Virginia.
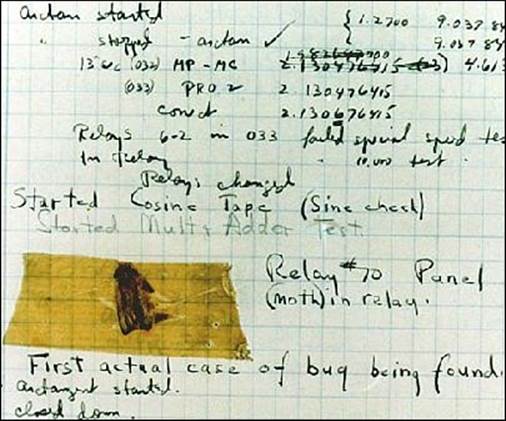
Figure 25.1 The first ever computer bug removed from a Mark II Aiken Relay Calculator in 1947.
Debugging Basics with Xcode
Like most modern IDEs, Xcode has a debugger built into it—in fact, two debuggers, lldb and gdb. Computers execute code very quickly, so quickly that it is nearly impossible to see all the steps as they are happening. This is where a debugger comes in handy; it enables the developer to slow down the execution of code and inspect elements as they change. The debug view might initially be hidden, but it can be accessed with the center view button, as shown in Figure 25.2. The debugger is available only when an app is being executed from within Xcode.

Figure 25.2 Accessing the debugging area in Xcode is done through the lower view area.
The debug view (see Figure 25.3) consists of three primary parts. On the left-hand side is the variable view, which is used to inspect detail information about the objects currently within the scope of memory. The right-hand side is composed of the console, which also contains the debugger prompt. On the top of the view lays the debugging command bar for interacting with the debugger.
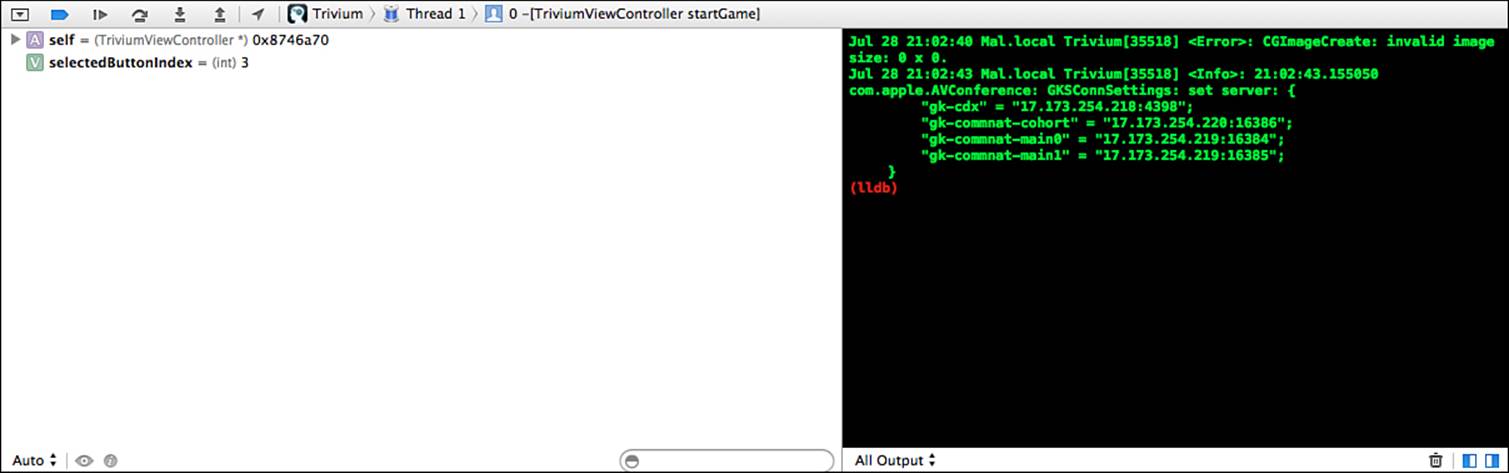
Figure 25.3 The debug view.
The debugger will automatically show whenever an exception is encountered, and at any time the developer can also pause the current execution and bring up the debugger, as well using the Pause button in the debugging toolbar.
It is often possible, if the debugger has stopped at an exception, to be able to continue the execution. This can be achieved by using the Resume button in the toolbar. On the toolbar, from left to right, the Step Over command will move to the next line of execution while remaining paused. The Step Into command will move into a new method or function that the debugger is currently stopped on. Likewise, the Step Out Of button will move back outside of the current method or function.
Additionally, from the debugger toolbar each thread in execution can be inspected, showing the stack trace. The stack trace will provide the sequence of events leading up to the current point in execution. This same information can be accessed with the Debug Navigator, which can be accessed from the left-most pane of the Xcode window, shown in Figure 25.4.
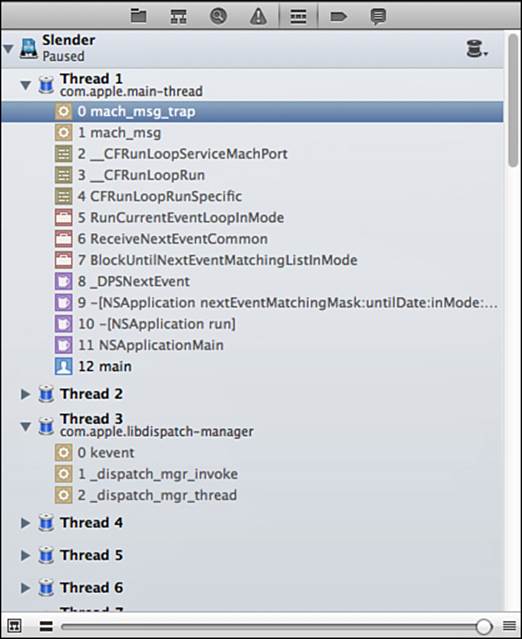
Figure 25.4 The Debug Navigator showing a backtrace across several threads.
Breakpoints
Most developers begin debugging by printing log statements to the console to get an insight into how the code is executing or behaving. Log statements are very useful but they are very limited in their functionality. Breakpoints inform the debugger that the code being executed should be paused to allow for more thorough debugging. To create a new breakpoint, click on the line number where the code should pause. A blue indicator will appear, representing a new breakpoint; to remove the breakpoint, drag the blue indicator off the line number bar. To temporarily disable a breakpoint, toggle it off by clicking on it, and the breakpoint will become a transparent blue.
After a breakpoint has been hit, the code execution will pause. The variable view will populate with all the in-scope variables and the stack trace will show the path of methods and calls that lead to the breakpoint. Calls that are in code written by the developer will appear in black, and system calls appear in a lighter gray. The developer can click through the stack trace to show the line of code that was responsible for calling the following item (see Figure 25.5).
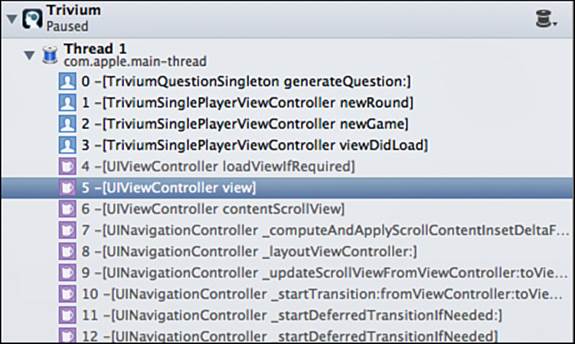
Figure 25.5 A common stack trace. The code is frozen at item 0 in the method generateQuestion:. The events that lead to this method can also be seen, from viewDidLoad to newGame to newRound. The lighter gray methods are system calls that were not directly invoked by the developer’s code.
Customizing Breakpoints
Breakpoints are highly customizable. Right-clicking on a breakpoint will reveal the edit view shown in Figure 25.6. The first property that can be customized is adding a condition for the breakpoint, such as x == 0. This can be useful when the breakpoint should be fired only under certain circumstances, such as x being equal to 0.
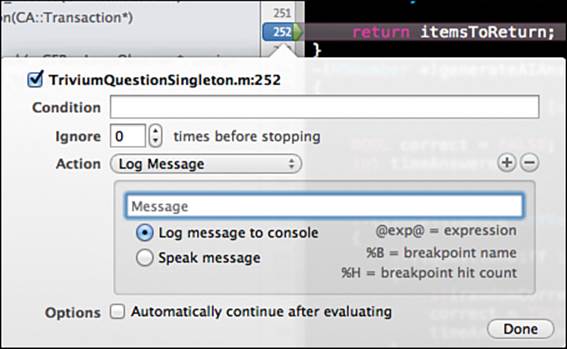
Figure 25.6 Customizing a breakpoint.
The developer might also have cause to ignore the breakpoint the first several times it is hit. A bug might present itself only after a line of code is executed a certain number of times, and this can remove the need for continuously hitting the Continue button.
Breakpoints can also have actions attached to them, such as running an AppleScript, executing a debugger command, performing a shell command, logging a message, or even playing a sound. Playing a sound can be particularly useful as an audio indicator of an event happening, such as a network call or a Core Data merge. Under certain conditions, such as playing audio, the developer might not want to pause the code execution during the breakpoint. If the preferred action is to log a message or play a sound without pausing, the Automatically Continue after Evaluating option can be enabled.
Symbolic and Exception Breakpoints
In addition to user-set breakpoints, there are two types of breakpoints that can be enabled. These are done through the Breakpoint Navigator found in the left pane of the Xcode window.
Symbolic breakpoints can be used to catch all instances of a method or a function being run. For example, to log every instance of imageNamed: being called, a new symbolic breakpoint can be created for the symbol +[UIImage imageNamed:]. Figure 25.7 shows a symbolic breakpoint that will log each use of imageNamed: by playing a sound.
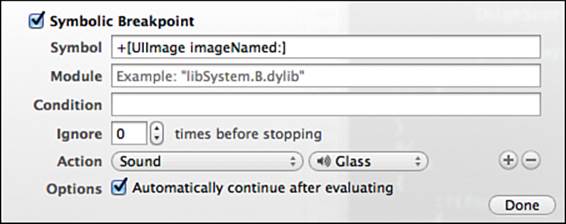
Figure 25.7 A symbolic breakpoint that will play a sound and continue every time a new image is created using the method imageNamed:.
Exception breakpoints work very much like symbolic breakpoints except that they are thrown whenever any exception occurs. Often, setting a global exception breakpoint will provide a better stack trace than is typically provided by a crash. This is because the stack trace is provided based on the breakpoint, whereas a crash can be a result of an exception but does not necessarily point back to the root cause. It is considered by many developers to be best practice to always keep a global exception breakpoint on while debugging.
Breakpoint Scope
You can also set the scope of a breakpoint (see Figure 25.8) by right-clicking on a breakpoint in the Breakpoint Navigator. The available scope options are project, workspace, and user. In addition to specifying a scope, the user also has the option of creating a shared breakpoint. A shared breakpoint is helpful when working on a project with multiple developers across a version control system in which it is important that breakpoints are turned on for all users. Additionally, users can enable breakpoints as a user breakpoint that will be active on all new projects they create.
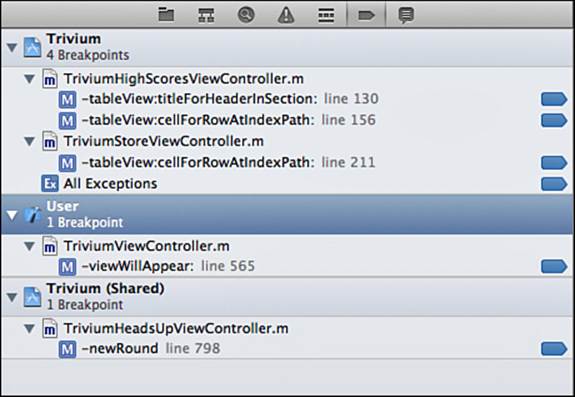
Figure 25.8 Setting up various breakpoints’ scope including user and shared breakpoints in Xcode.
Working with the Debugger
Xcode features two debuggers, gdb debugger (GNU Debugger) and LLDB. The debugger can be accessed anytime code execution is currently paused. A gdb or an lldb prompt will appear at the bottom of the console window. Although both debuggers are very large and complex systems, there are several commands that are important for the iOS developer to be familiar with. Apple has begun recommending that LLDB be used for all new projects.
Note
As of Xcode 5, gdb is no longer available and projects will automatically be converted to LLDB if they were set to use gdb from earlier versions of Xcode.
Note
To change the debugger that is being used, edit the scheme for the target that is being executed. This menu can be accessed from the Xcode toolbar next to the run and stop controls.
The first command to turn to when in doubt is the help or h command. The help command will print a root-level help menu, and help followed by any command will print information specific to that command.
The most common debugger commands that will be required by an iOS developer are p or print and po or print object. The print command will print the value of a scalar expression such as x + y or structs such as CGRect. Using the print command, it is also possible to change the value of variables while in the debugger.
(gdb) p scaleStage2
$2 = 0.600000024
(gdb) p scaleStage2 = 0
$3 = 0
(gdb) p scaleStage2
$4 = 0
The print object (po) command will ask an objective-C object to print its description. For example, to see the contents of a memory address, you can type the following command into the gdb or lldb prompt:
(gdb) po 0x8360580 <UIImageView: 0x8360580; frame = (0 0; 320 480); opaque = NO;
autoresize = RM+BM; userInteractionEnabled = NO; layer = <CALayer: 0x83605e0>>
Alternatively, an object name can be used, such as this:
(gdb) po backgroundView <UIImageView: 0x8360580; frame = (0 0; 320 480); opaque = NO;
autoresize = RM+BM; userInteractionEnabled = NO; layer = <CALayer: 0x83605e0>>
The list command can be helpful as well. list will print the code surrounding the breakpoint line. In addition, list takes the parameter of +/- X to specify lines before or after the breakpoint in which to display.
There are times when it is required for a developer in the process of debugging a method or function to override the return value or provide an early return. This can be done using the return x command. For example, typing return 0 followed by continuing will simulate the code returning successfully at the breakpoint.
The backtrace command, or bt, can be used to print the current backtrace to the console. Although this can be helpful for debugging, this information is typically available in a more user-friendly format in the Debug Navigator.
In addition to these commands, the basic toolbar commands can be executed from the debugger prompt, which is often easier than navigating to the very small button in the toolbar. step or S will move to the next line of code in execution. continue or C will continue past the breakpoint and resume executing code. fin will continue until the end of the method, a useful command that does not have a toolbar equivalent. Finally, kill will terminate the program.
gdb is a very powerful tool that can provide a tremendous amount of power and flexibility to debugging. To read more about what can be done in gdb, see the official GNU documentation (www.gnu.org/software/gdb/documentation/). Additional information can be found on the lldb debugger at (http://llvm.org/docs/).
Tip
The gdb debugger does not support using dot notation as part of its input; however, the lldb debugger handles dot notation as expected.
Instruments
“Instruments” refers collectively to the 15 profiling and analyzing tools that come bundled with Xcode. See Table 25.1 for a complete list. Although the exact details and behaviors of these instruments warrant a book in and of itself, the basics of how to read and interact with instruments is enough to cover the vast majority of what will be needed by the ordinary iOS developer.
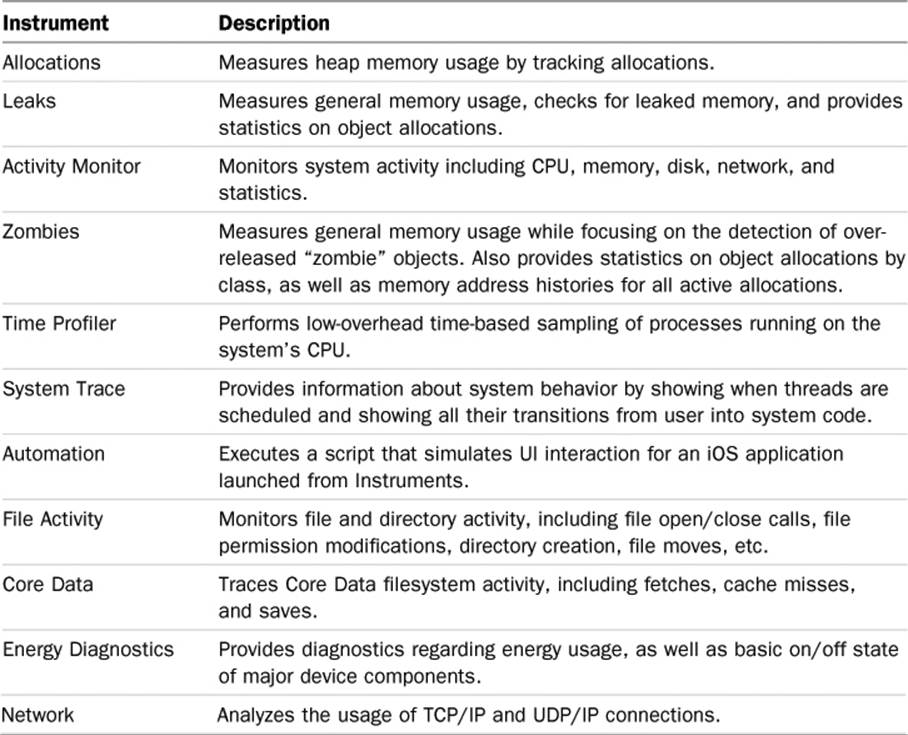
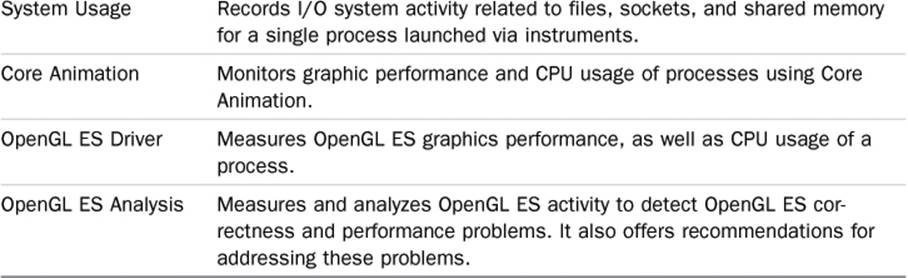
Table 25.1 Instruments Provided in Xcode and Their Functionality
Note
It is important to realize that not all instruments are available under certain circumstances. For example, the Core Data instrument is available only when running on the simulator, and the Network instrument is available only while running on a physical device.
The Instruments Interface
To access the instruments interface in Xcode, select the build target, either a simulator or a device, and select the Profile option from the Product menu. A new window (see Figure 25.9) will appear, enabling the user to select the type of instrument he would like to run. After an option is selected, additional items can be added to it from the library (see Figure 25.10).
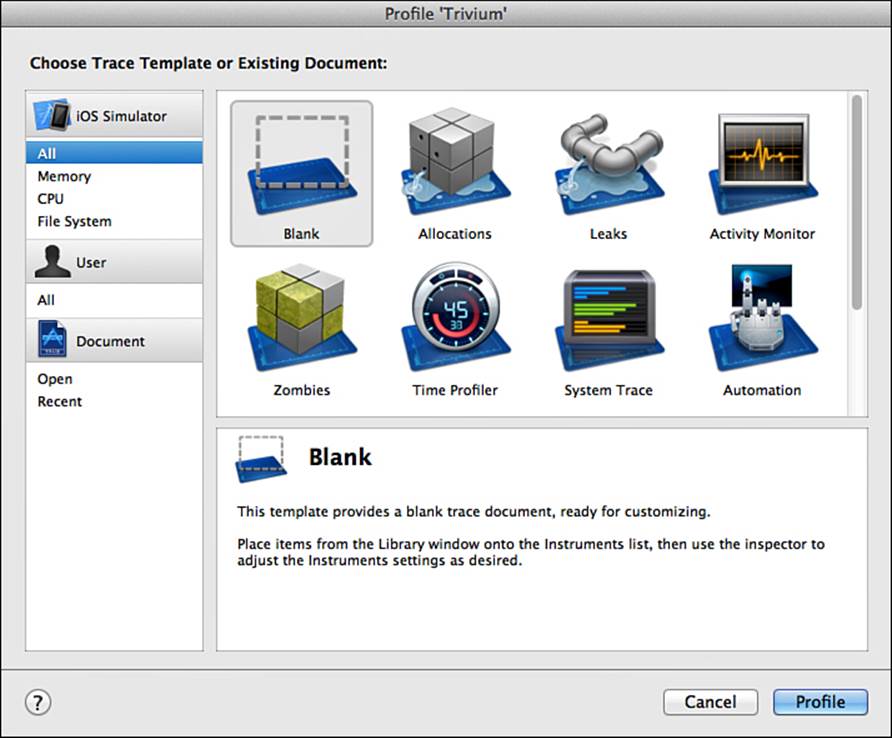
Figure 25.9 Selecting instruments to run after running an app in profile mode.
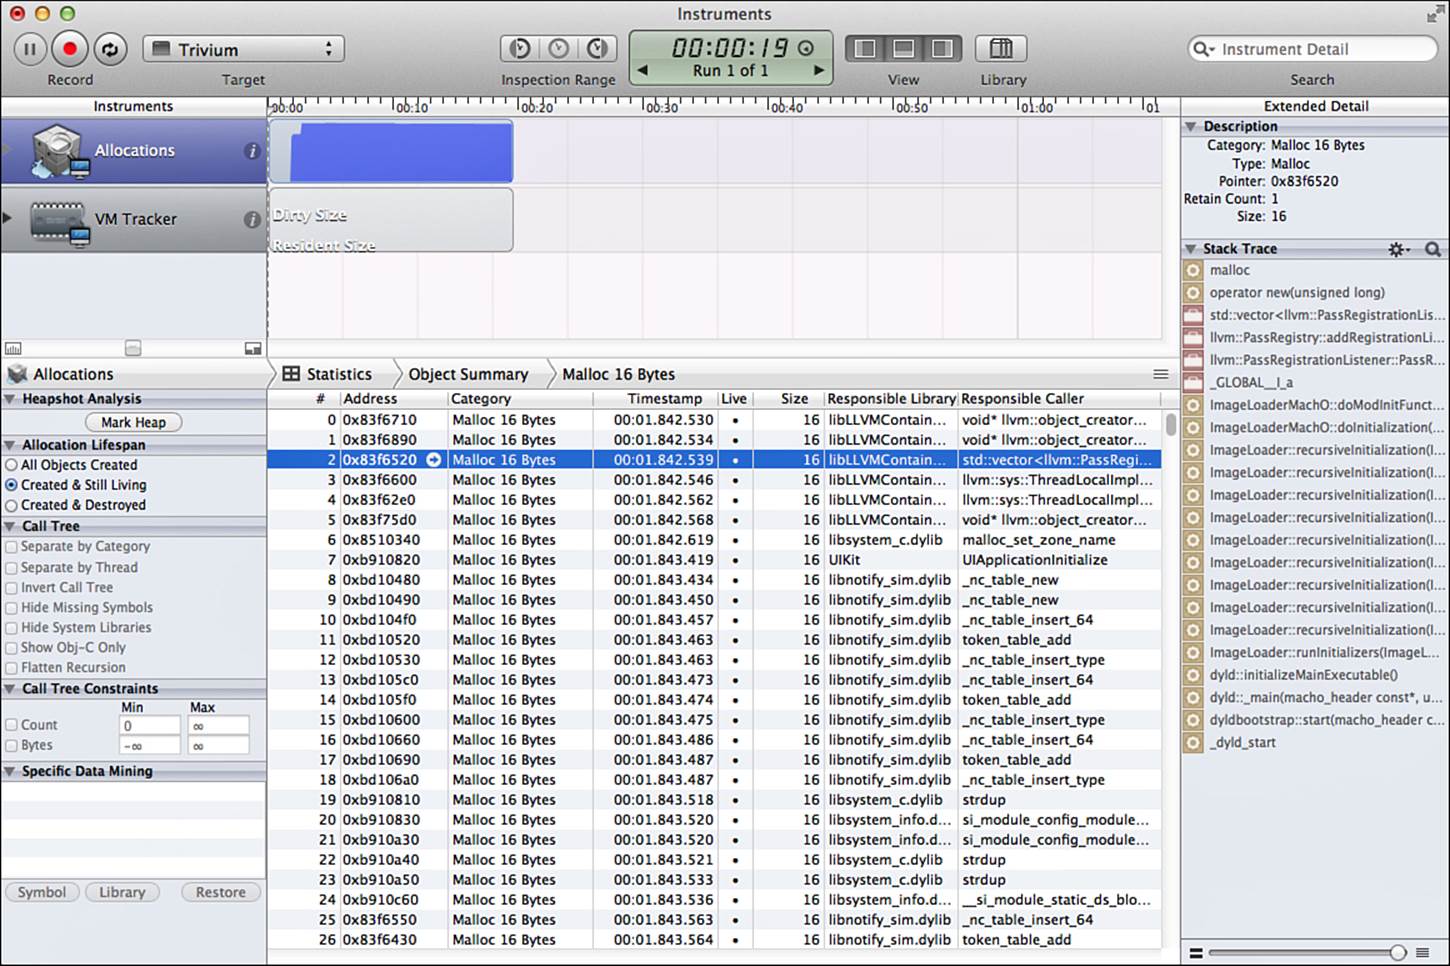
Figure 25.10 The basic instruments interface, shown running the Allocations tool.
The instruments interface itself consists of several sections that will vary depending on the exact instrument you are running.
On the top toolbar of the Instruments window, various controls are present, such as those to pause, record, and restart the execution of the current target. Additionally, new targets can be selected from all running processes. The user also has control of setting an inspection range of any instrument that will filter items which do not occur between the left and right markers.
The instruments app will also save each run of the app so that changes to performance can quickly be compared to each other. The user can also add new instruments from the library in order to combine multiple tests. The left view, which can be toggled from the view menu, contains settings specific to the selected instrument. The bottom view will contain detailed information about the test being run, such as the Call Tree or Statistics; these also vary depending on the instrument selected. The last view is the right extended information view; this view will often contain the backtrace for the selected item in the center view.
Most base-level objects found in the center or right view can be double-clicked to provide additional information, such as the referencing section of code. Additional information about the instruments can be found if you click the “i” button next to the instrument name.
In the following sections, two of the most common instruments are examined. The first, Time Profiler, is used by developers to determine which code within an app is taking the most time to execute. By analyzing the time each line of code takes to run, the developer is able to provide optimizations and enhancements to that code to increase the overall speed and performance of the app. The second instrument set that is examined consists of the Leaks and Allocation toolsets. These enable the developer to analyze how memory is being used in her app, as well as easily find memory leaks and over-releases.
Exploring Instruments: The Time Profiler
The Time Profiler provides line-level information about the speed at which code is being executed. There are many bottlenecks that can cause an app to perform slowly, from waiting for a network call to finish to reading and writing from storage too often. However, a very common cause of performance issues and one of the easiest to address is the overuse of the CPU. Time Profile provides the developer with information about the CPU time resulting from various calls, which in turn enables the developer to focus on problem areas of the app and provide performance improvements.
Time Profiler can be selected from the list of instrument templates and can be run on either the simulator or the device. When you are profiling CPU usage, it is important to remember that the device is typically much slower than the simulator, and users will not be running software on the simulator.
Time Profiler being run on an app with high CPU usage is shown in Figure 25.11. The top section in purple represents percentage of CPU used; dragging the cursor over the time bar will reveal the exact CPU usage percentage. The call tree reports that 99.6% of the process time is spent in Main Thread, and if that information is expanded/dropped, 99.1% of the time is spent in main() itself. This information is not entirely helpful on the surface, because an Objective-C app should be spending a considerable amount of its time in main(), but it does let the developer know that there is very high CPU usage, at some points at 100%.
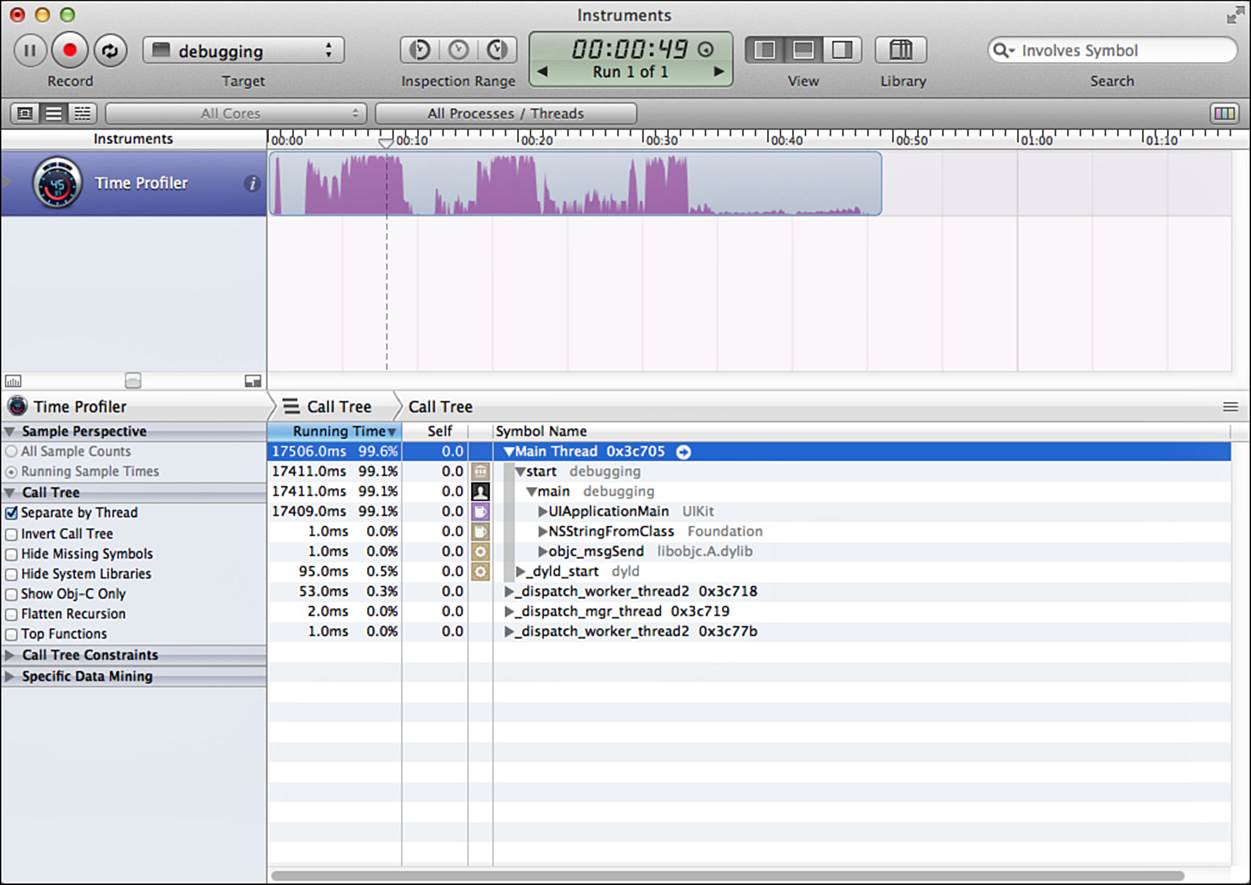
Figure 25.11 Running the Time Profiler instrument on an app with high CPU usage.
To retrieve more useful information from the Time Profiler, the first thing that should be done is inverting the call tree, which is a check box in the Time Profiler settings. Instead of grouping time spent from the top down, it will group from the base functions up. In addition to inverting the call tree, it can be helpful to check off the box for Hide System Libraries. Although system library calls might be taking up a considerable amount of processing time, they can often be traced back to the developers code itself. Viewing system calls can also be helpful for troubleshooting more difficult issues. Depending on whether the code base is using Objective-C only, it might also be helpful to use the Show Obj-C Only option.
After the proper configurations have been made, what is left is a list of calls that the developer has specifically made and the amount of CPU time they are taking up. The best-practice approach is to optimize from the largest usage to the least, because often fixing a larger issue will cascade and fix a number of the smaller issues as well. To get more information on the code in question, double-click on the item that will be investigated in the call tree. This will reveal a code inspector that is broken down by line with annotations indicating the amount of processor time used relative to the method, as shown in Figure 25.12.
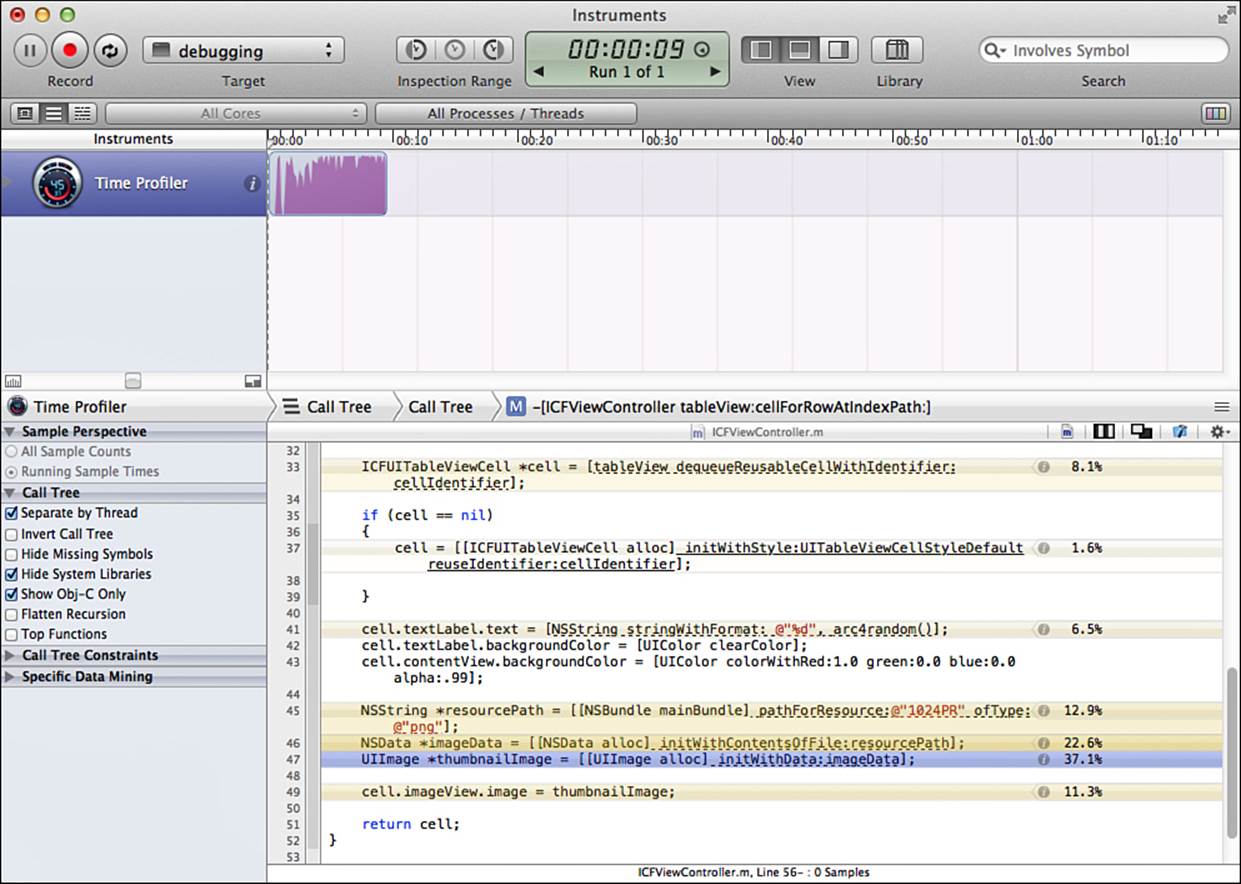
Figure 25.12 Inspecting Time Profiler information at a line-by-line level.
Note
The code cannot be edited using the instruments code inspector; however, clicking on the Xcode icon (shown in Figure 25.12) will open the code in Xcode.
Although Time Profiler is not smart enough to make recommendations on how to optimize the code that is running slowly, it will point the developer in the right direction. Not every piece of code can be optimized, but equipped with the line numbers and the exact overhead required to run them, the challenge is greatly reduced.
Tip
Using the inspection range settings in instruments is useful for pinpointing exact spikes or sections of time to be investigated. The controls are used to mark the beginning and end of the inspect range on a timeline.
Exploring Instruments: Leaks
The Leaks instrument, and by association the Allocations instrument, gives the developer a tremendous amount of insight into finding and resolving memory-related issues. It can assist in finding overuse of memory, leaks, retain cycles, and other memory-related issues. With the popularization of Automatic Reference Counting (ARC), the Leaks and Allocation tools are slowly falling from their previous grace; however, they can still offer tremendous benefits to the developer.
The Leaks instrument can be launched from the Instrument Selector window in the same fashion as the Time Profiler. When Leaks is launched, it will automatically also include the Allocations instrument, both of which can be run on the device and the simulator. In Figure 25.13 a poorly performing app is profiled, resulting in an increasing memory footprint, as indicated by the growing graph under the Allocations section. Additionally, several leaks have been detected, as indicated by the red bars in the Leaks section. Given enough time, these issues will likely result in the app running out of memory and crashing.
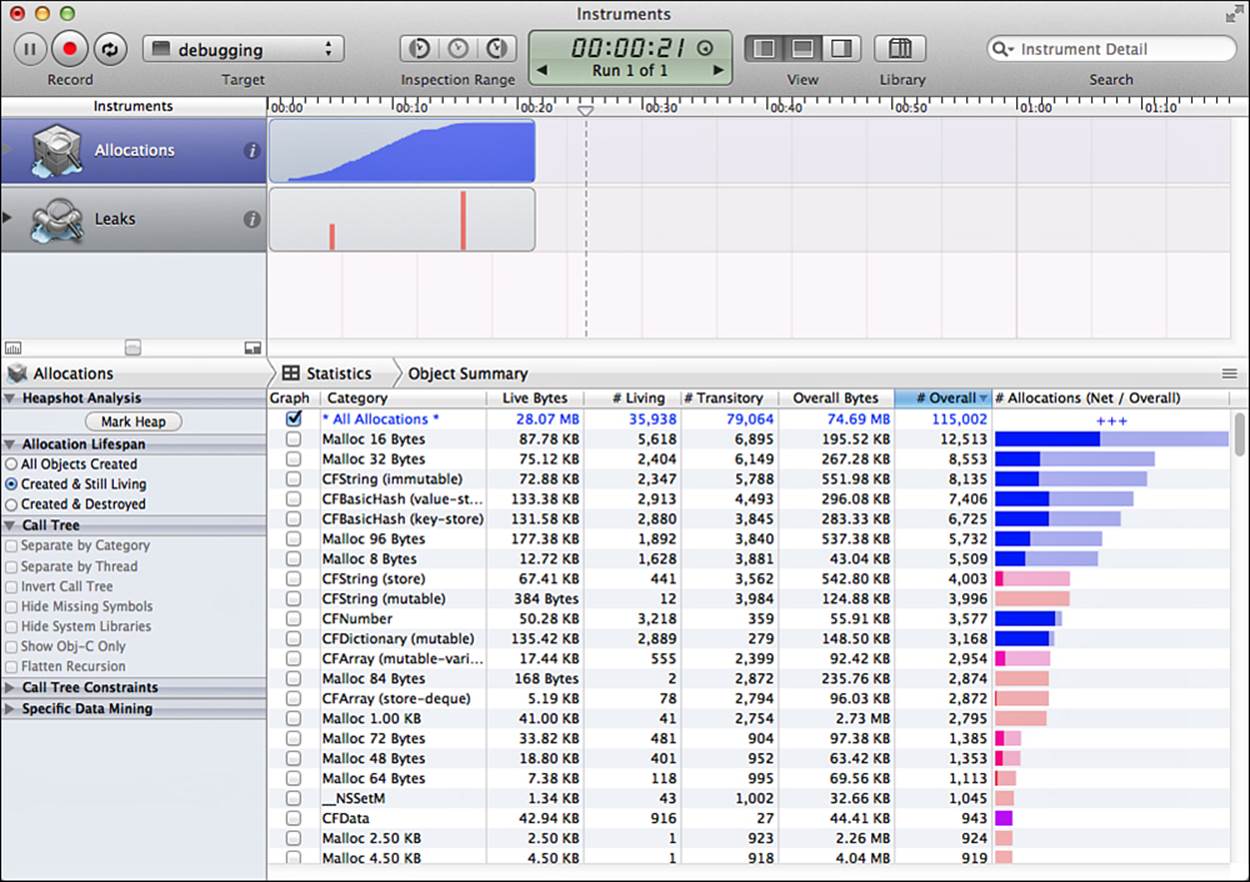
Figure 25.13 Running the Leaks and Allocation instruments against a project with memory leaks.
Although memory issues can also be debugged using the call tree grouping as shown in the Time Profiler section, it is sometimes more useful to look at the Statistics or Leaks presentation of information. To see the leaks, which are often the cause of increasing memory usage, select the Leaks instruments from the upper left. In this sample project shown in Figure 25.14, there are numerous leaks of a UIImage object.
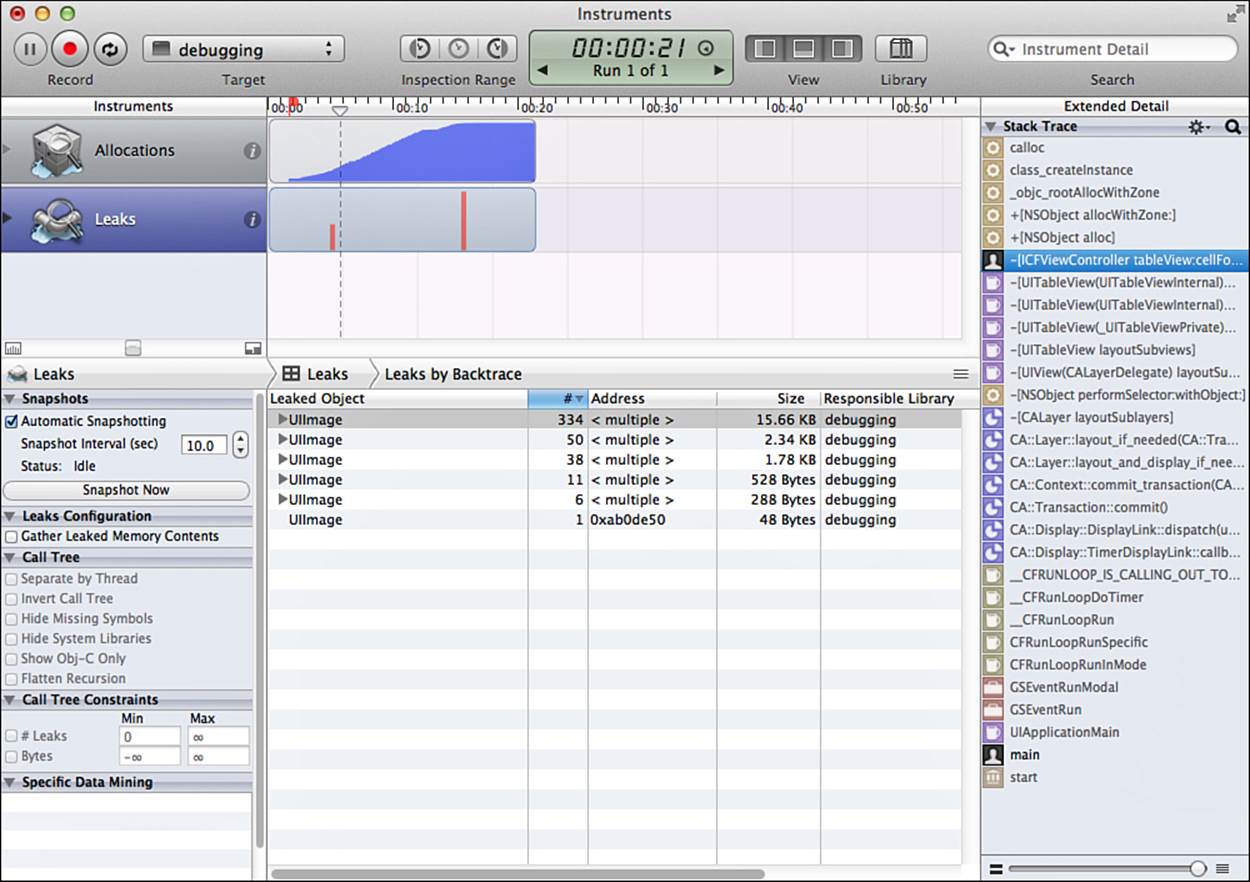
Figure 25.14 Investigating a large number of UIImage leaks from a sample project with a growing memory footprint.
Instruments will attempt to group leaks into identical backtraces; however, the system is not perfect and leaks being caused by the same problem might appear more than once in the list. Best practice calls for resolving the highest number of leaks first and then running the profiler again. To trace the leak back to a section of code, the left view needs to be exposed. This is done with the view controller in the title bar of the Instruments window. Selecting a leak will reveal the backtrace to that event. Double-clicking on the nonsystem-responsible call (typically shown in black text) will reveal the code in which the leak has occurred.
Tip
Clicking the “i” button to the right of the Allocations instrument allows for additional configuration such as turning on Zombies. The use of Zombies enables the developer to troubleshoot and fix memory that is being over-released. Over-released memory is caused by trying to access memory that has been fully released and now has a retain count of zero. This will usually result in a crash of EXC_BAD_ACCESS.
There might be times when the memory footprint of an app grows to unacceptable levels but there are no leaks present. This is caused by the app using more memory than is available. To troubleshoot this information, select the Allocations instrument and view the call tree. The same approach to inverting the call tree, hiding system libraries, and showing only Obj-C from the Time Profiler section might be helpful here. In Figure 25.15, 27.12MB of memory is being allocated in cellForRowAtIndexPath:, which is causing the app to run poorly. Double-clicking on this object will reveal a code inspector that will pinpoint which lines are using the most memory, which will provide guidance in the areas to troubleshoot.
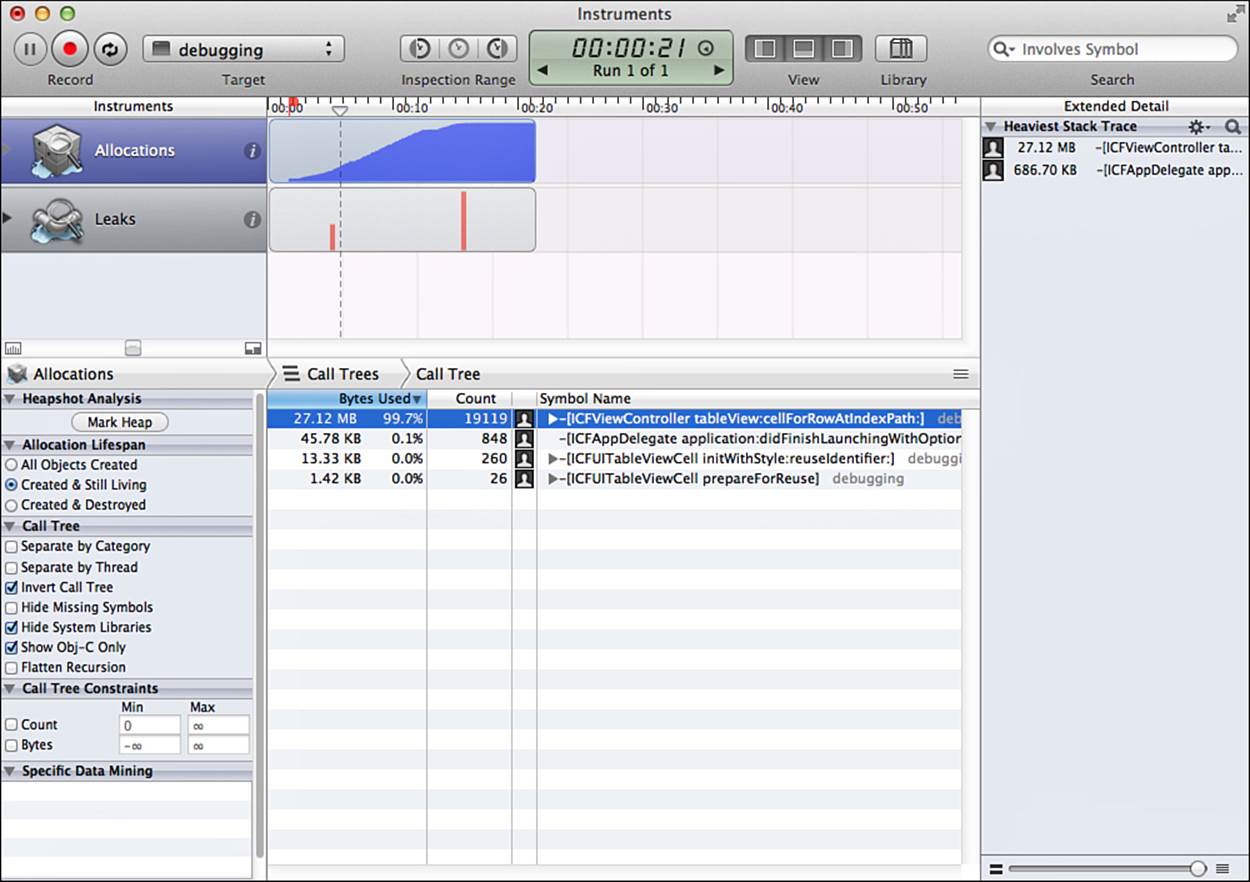
Figure 25.15 Investigating an Allocations call tree that shows a very large amount of memory being used in cellForRowAtIndexPath:.
Going Further with Instruments
Instruments is a highly explorable tool. After a developer has an understanding of the basic functionality and controls, the majority of instruments become very easy to deduce. Apple continues to aggressively improve on and push for developers to leverage instruments. At this point there are tools to troubleshoot just about everything an app does from Core Data to battery statistics, and there are even tools to help optimize animations in both Core Animation and OpenGL ES. To learn more about a particular instrument, visit Apple’s online documentation athttp://developer.apple.com/library/mac/#documentation/DeveloperTools/Conceptual/InstrumentsUserGuide/Introduction/Introduction.html.
Summary
This chapter, unlike most of the other chapters in this book, did not cover a sample project or demonstrate the proper usage of a new framework. Instead, it provided something more valuable, an introduction to debugging and code optimization. Debugging, in and of itself, is a huge topic that is worthy of not just one book but several books. We hope that this chapter has provided a jumping-off point for a lifelong passion of squeezing the most out of code and hunting down those tricky bugs. A developer who can troubleshoot, optimize, and debug quickly and effectually is a developer who never has to worry about finding work or being of value to a team.
Instruments and the Xcode IDE are Apple’s gift to developers. Not too long ago, IDEs cost thousands of dollars and were hard to work with, and tools like Instruments were nonexistent. When Apple provided Xcode to everyone free, it was groundbreaking. Over the years they have continued to improve the tools that developers use to create software on their platforms. They do this because they care about the quality of software that third-party developers are writing. It has become the obligation of all iOS developers to ensure that they are using the tools and providing the best possible software they can.
Exercises
1. Spend some time exploring various instruments either with a personal project or with any of the sample code contained in this book. It cannot be stressed enough how important it is to understand what each instrument can analyze; otherwise, it is impossible to know when to use one.
2. Create an exception such as an out-of-bounds array error and see how it behaves when a global exception breakpoint is set compared to having global exceptions turned off.
All materials on the site are licensed Creative Commons Attribution-Sharealike 3.0 Unported CC BY-SA 3.0 & GNU Free Documentation License (GFDL)
If you are the copyright holder of any material contained on our site and intend to remove it, please contact our site administrator for approval.
© 2016-2026 All site design rights belong to S.Y.A.