Learning iOS Development: A Hands-on Guide to the Fundamentals of iOS Programming (2014)
Chapter 14. Instruments and Debugging
Apps are complex, with at least tens of classes, sometimes more. There are also storyboards, XIB files, resources, and more. The chances of getting so much code and work right the first time is very small. Issues can range from slowness in the interface to crashes. Luckily, Xcode provides powerful tools for checking your running application and for finding bugs.
Instruments provides a view into a running app, helping you find performance issues, memory use, leaks, and other useful information. The debugger lets you step through code, inspect variables, and even play sounds when lines of code are hit.
This chapter introduces you to these powerful tools. First, you explore Instruments and learn what kinds of information you can gather with it. Then, you dive into a time profile and optimize a slowly loading view controller.
Next, you learn about the debugger, looking at some ways it can help you find problems. You start with a tour. Then you learn about breakpoints, which, along with actions, form the heart of debugging. Finally, you use both Instruments and the debugger to track down an EXC_BAD_ACCESSerror, one of the hardest types to find.
Instruments
App performance is important. Users have little patience for apps that take too long to launch, are too slow to respond, or drain their batteries. Good design and coding practices can help, but they can only get you so far. And even when the app appears to work, how do you know?
Instruments is a tool for profiling parts of an app. You can use it to look at everything from execution time to memory use, network calls to battery usage—all the things that can affect the performance of an app.
Gathering data using Instruments is as simple as running your app for profiling and choosing your instrument(s). The available instruments check everything from execution time to memory use to network calls. You can use them to ensure the following about an app:
![]() It is fast and responsive.
It is fast and responsive.
![]() It uses memory efficiently.
It uses memory efficiently.
![]() It has no memory leaks.
It has no memory leaks.
![]() It uses limited resources, such as the battery, wisely.
It uses limited resources, such as the battery, wisely.
You can launch an app in Instruments in several ways:
![]() Choose Product > Profile.
Choose Product > Profile.
![]() Press Cmd-I.
Press Cmd-I.
![]() Option-click the Run button and choose Profile.
Option-click the Run button and choose Profile.
Doing any one of these compiles your app and opens the Instruments application with your app as the target. When Instruments launches, you are presented with the Instruments template chooser, shown in Figure 14-1.
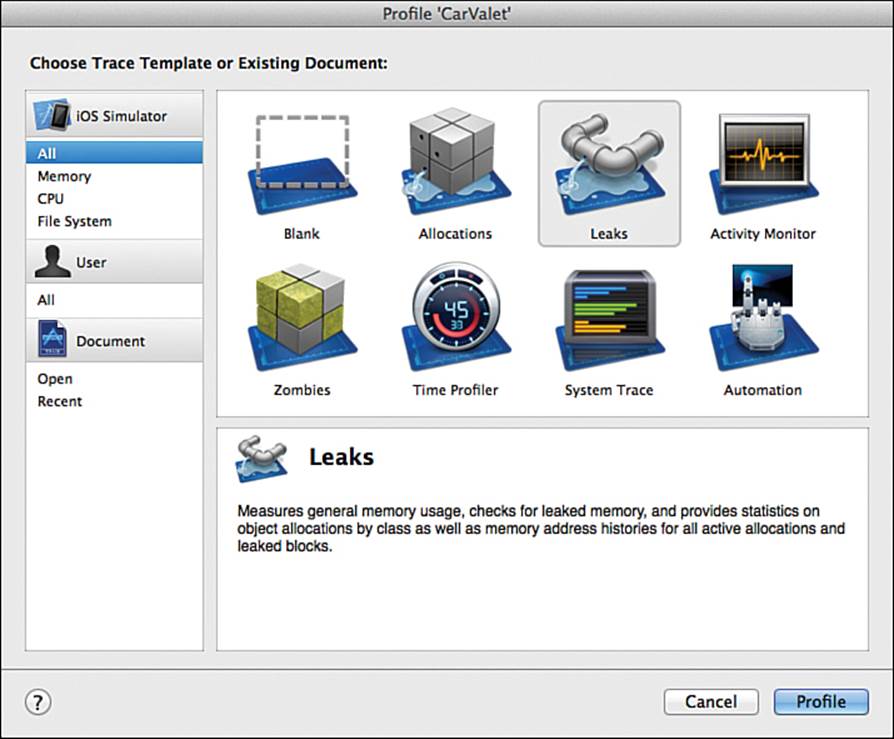
Figure 14-1 Choosing a profiling template
Notice that the section name is “iOS Simulator.” If you launched instruments when building for a device, it would say “iOS.” Where you run the app depends on two things: the current stage of optimization and the instruments you want to use. In general, you run on the simulator early in the cycle, to find general issues, or if you are using simulator-specific instruments.
The device tools are for fine-tuning as well as to run some of the most important checks, such as for timing and energy use. It’s important to always check on a real device before finalizing your code. Preferably, you should check an app on different kinds of devices, especially the types you expect your customers to use.
Clicking Choose in the Instruments template chooser initializes a new document with the set of instruments included in the template. It also starts recording data from the simulator or device. Instruments is document-based. You can have multiple recording sessions in one document, as well as multiple documents, each with its own set of instruments. Saving a document saves all the recording session data. For now, though, click Cancel.
Templates and Instruments
When Instruments launches, you see a set of templates, not instruments. Templates are the tool’s way of presenting task-based sets of instruments. For example, you can use Leaks to measure memory allocation and leaks, Time Profiler to see where the app is spending time, and so on.
Choosing a template creates a profiling document with the recommended set of instruments. For example, the Leaks template includes both memory allocation and memory leak instruments. The Allocations instrument shows the amount of memory you are using at any point. Leaks tries to find allocated memory with no references. Both instruments are important in finding leaks.
Table 14-1 lists the major templates, what they are useful for, and whether each is a tool that runs on a device, in the simulator, or both. The table does not include some special purpose templates such as Animation. Note that not all of the templates in the table are shown in Figure 14-1.
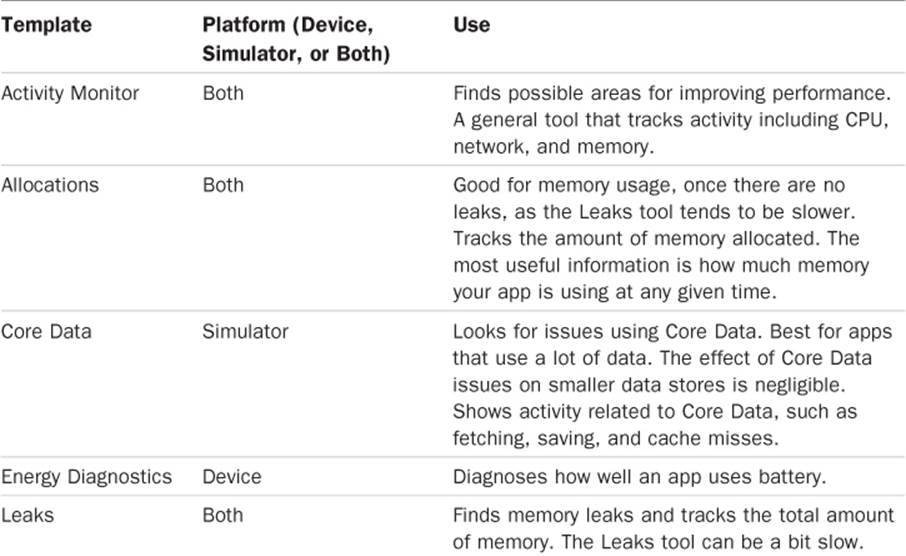
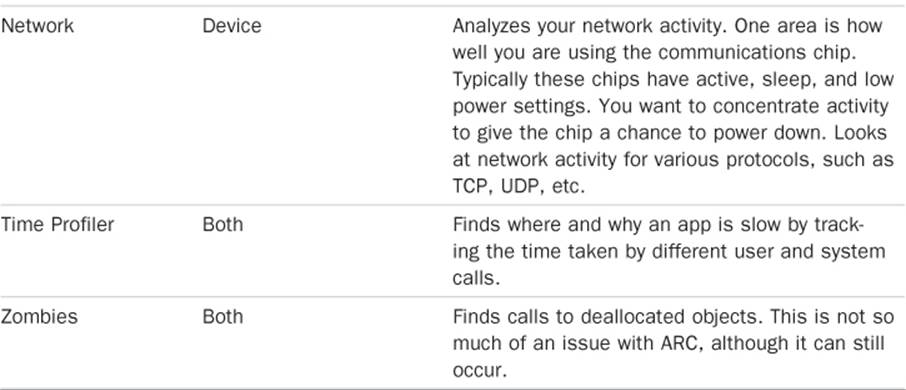
Table 14-1 iOS Profiling Templates
The most commonly used templates are Leaks, Time Profiler, and Zombies. For apps that use communications, the GPS, or other battery-intensive features, Energy Diagnostics is also important.
You learn more about Zombies later in the chapter.
An Example Using the Time Profiler
The best way to learn how to use Instruments is through example. In this section, you use the Time Profiler instrument to improve the performance of the CarValet app. To do so, you need to use a real device. Although Time Profiler works on the simulator, the desktop is so fast that possible issues appear as small blips.
The slower the device, the easier it is to spot issues. The examples shown in this section were done using an iPhone 4, though they show up on any iOS device: iPod touch, iPhone, or iPad. After opening the CarValet project, either yours or the one provided with the chapter sample code, run the Time Profiler by following these steps:
1. Use a USB cable to attach an iOS device that is set up for development to your machine. If you do not have a development device, the first part of Chapter 15, “Deploying Applications,” takes you through the process of setting one up.
2. Choose the device from the schema popup, as shown in Figure 14-2.

Figure 14-2 Choosing a target device
3. Profile the app by selecting Product > Profile, pressing Cmd-I, or Option-clicking the Run button and choosing Profile. When the profile window comes up, choose Time Profiler.
4. When the app starts running, go through the major functional areas of the app, paying attention to the profiling trace: viewing car details, swiping back and forth, making a change and going back, viewing car images, looking at the About screen, dragging the taxi, and so on. Stop the app when you see any high and long spikes after the initial app launch or if you see a noticeable delay in the interface.
The focus of this example is the time it takes to load the car images the first time the images screen is opened. The amount of time seems long, and the interface feels sluggish. Take a second recording, focusing on viewing the car images. You can do this either by profiling the app from Xcode or clicking the Record button in Instruments. Go straight to the car images scene and stop recording after the profile line settles down. You end up with a profile window that looks like Figure 14-3.
Figure 14-3 Car image slowness profile
The window has a few areas. The Toolbar on top provides quick access to common functions such as Record and showing the Extended Detail view. This is the unselected button in the View section.
Instruments lets you select the active instrument—that is, the one whose results are displayed in the lower area of the window. To the right of the selected instrument is a timeline that shows some sort of graphical representation of recorded data. When an instrument is expanded to show multiple runs using the triangle, the selected timeline is a darker color. In this case, it is the top, or second run.
The Call Tree view shows all the calls that are part of the selected timeline. The columns provide different data. In this case, Running Time is the most important column, grouping the call trees into the total percentage of time taken. The icons indicate what kind of call such as ones from UIKit, lower level system calls, or your own methods.
The lower-left window provides options for viewing the data. In this case, the call tree is showing only Objective-C calls.
You can insert a blue flag in the timeline by Option-clicking. This flag identifies an area of interest—in this case, opening the car images for the first time.
Finding the Problem
To find the problem, you need to focus on the time bump that happened when you were viewing car images. The best way to do this is in two stages: First, Shift-drag the cursor over the big bump in time in the second run. This zooms the data to fill the timeline, as shown in Figure 14-4.
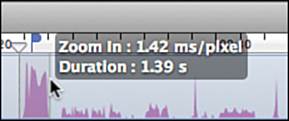
Figure 14-4 Zooming the timeline
After zooming in, Option-drag over the larger time bump. You should see the contents of the call tree change. Now open the Extended Detail view, using the View selector in the toolbar. After you do that, your window should look something like Figure 14-5.
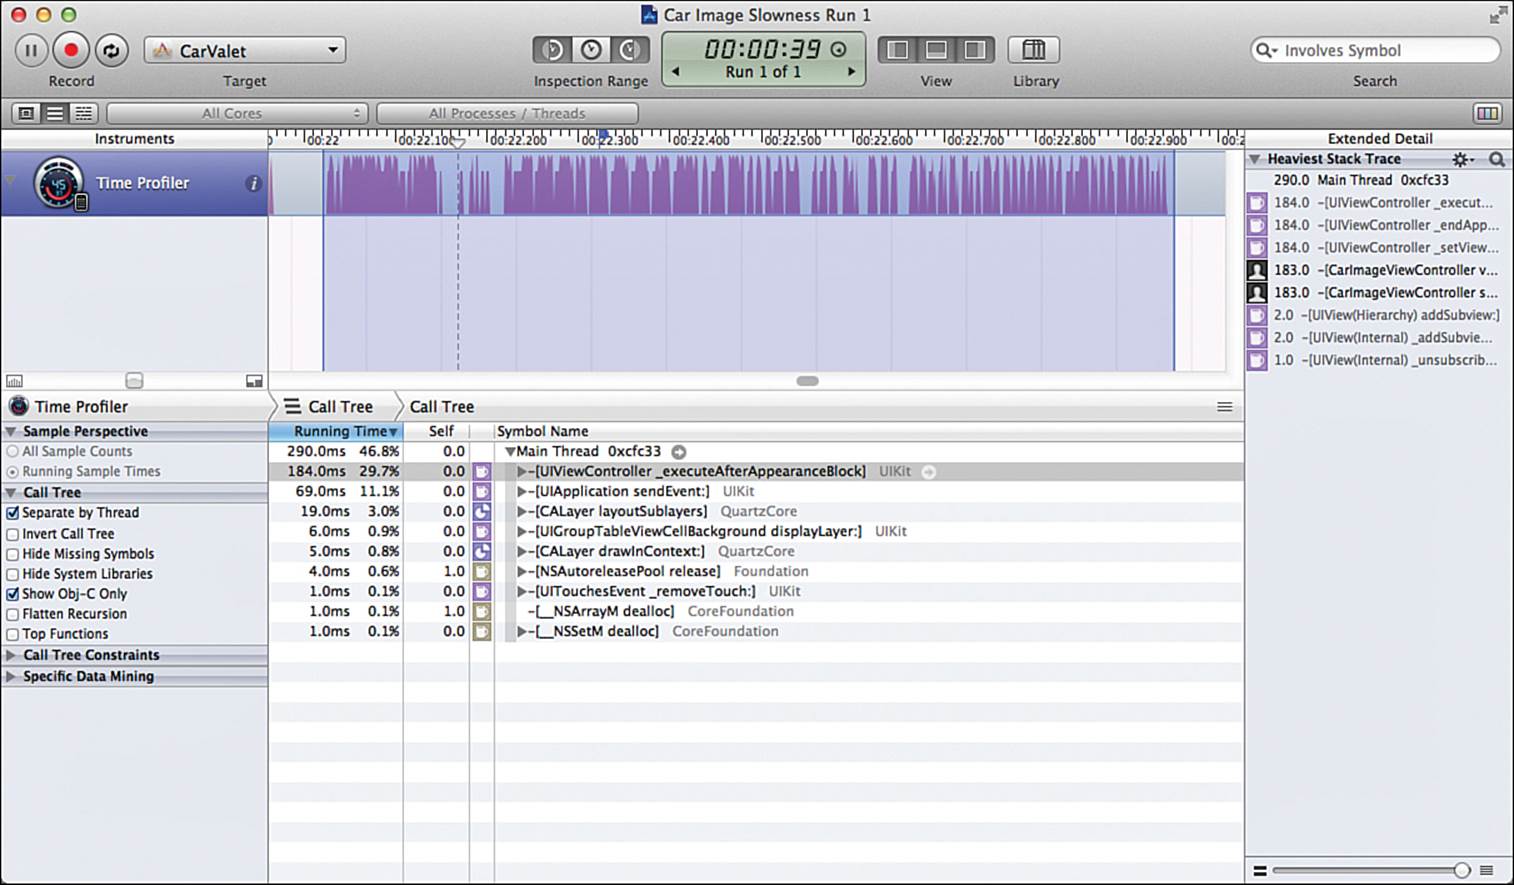
Figure 14-5 Focusing on the problem
The next phase is called call tree mining, and it is all about finding calls in your app that are taking too much time. Here’s how you do it:
1. In the left-hand option area, uncheck Separate by Thread. The sample document in Figure 14-5 shows 184.0ms, or 29.7%, of the time taken by the first line, and 69.0ms, or 11.1%, taken by the second.
2. Next, you need to mine data, using one of two methods. One method is to look for app calls on the Extended Detail panel. In the right-hand column in Figure 14-5 are two calls with a black silhouette; they are app calls. The second method is to check the Hide System Libraries option, although doing this can sometimes cause you to miss issues.
3. Select the app call in Extended Detail, and the Call Tree expands and selects that line. It still shows 183.0ms, so this is likely the source of the performance problem.
4. Select the second line, and it shows the next level down in the call tree, with similar timing. There is another app call below the selected line, but it is less than 1% of the time. setupScrollContent looks like the culprit.
Now you could go into Xcode and see if you can figure out what is taking the time. But there is a better way. Double-click the line in the Call Tree, and it is replaced with the window shown in Figure 14-6. Not only do you see the code, you also see highlights with instrument-appropriate annotations. Since this is the Time Profiler, you see the percentage of time taken by that line.
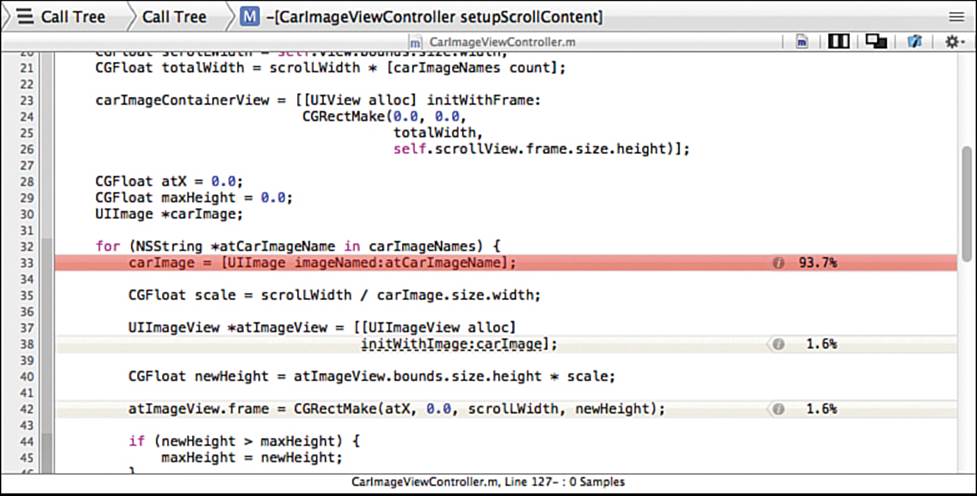
Figure 14-6 Problem code with percent of time taken
Now you can develop a hypothesis about what is taking the time. The routine uses the imageNamed: class call of UIImage to load each picture. That routine fetches the image from the app resources if it is not already in memory. The first time the user looks at car images, none of the images are loaded. The classic solution to this problem is to prefetch the images.
In a final app, there would be other ways to determine the size of the scroll view and number of images. Perhaps there would even be a more appropriate controller, such as a collection view, but that is beyond the scope of this book. For more information, see Chapter 10 of The Core iOS Developer’s Cookbook (5th edition) by Erica Sadun and Rich Wardwell.
Fixing the Problem: Attempt 1
Prefetching means preloading the images. For now, all you need to do is call imageNamed: for each of the images before calling setupScrollContent. The first place to try this is in viewDidLoad for CarImageViewController. Follow these steps:
1. Click the small Xcode icon at the top right of the already open Instruments code view to open CarImageViewController.m. Add the following method to the top of the class:
- (void)prefetchImages {
UIImage *carImage;
for (NSString *atCarImageName in carImageNames) {
carImage = [UIImage imageNamed:atCarImageName];
}
}
The body of the method calls imageNamed: for each of the images.
2. Add a call to run prefetchImages in a background thread to the end of viewDidLoad:
[self performSelectorInBackground:@selector(prefetchImages)
withObject:nil];
3. Profile the app and view the car images. Stop when you are done. You can do either by pressing the Stop button on the left of the Instruments toolbar, or by quitting the app.
Use the previous techniques to zoom in on the part of the timeline for viewing car images and then focus the Call Tree by using Option-drag. As shown in Figure 14-7, at first glance, things appear a bit better. The prefetch is taking only 107ms, but viewDidAppear is still taking another 165ms, for a total of 272ms—worse than the original.
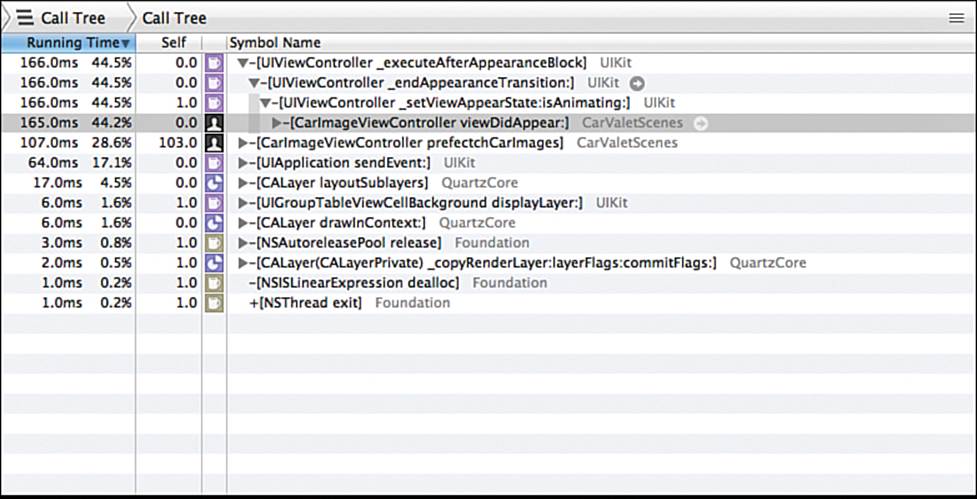
Figure 14-7 Updating time attempt 1
The higher time makes sense when you realize what is happening. viewDidLoad starts a prefetch in the background. Prefetch starts loading images. Then viewDidAppear: is called and sends setupScrollContent, which in turn starts loading images. At best, each image is preloaded before it is needed, but you are still creating two UIImages for each car picture, even if one is never used. If prefetching is the solution, it needs to happen somewhere else.
Fixing the Problem: Attempt 2
In a shipping app, the slowness you have found would either not be an issue, or there would be a different source of slowness. For this app, prefetching should work. It just needs to happen somewhere else. Since there is such a small amount of data, it can happen early on, when the app is launching. It is still a good idea to prefetch in the background. Otherwise, launching the app takes a lot longer. Here are the steps:
1. Open CarImageViewController.m, select prefetchImages, and cut prefetchImages from the file.
2. Open AppDelegate.m and paste the prefetchImages method at the top of the class inside the @implementation area.
3. Go back to CarImageViewController.m and copy the definition of carImageNames in viewDidLoad.
4. Open AppDelegate.m and paste the definition at the top of prefetchImages. Then modify it to look like this:
NSArray *carImageNames = @[ @"Acura-16.jpg", @"BMW-11.jpg", @"BMW-13.jpg",
@"Cadillac-13.jpg", @"Car-39.jpg",
@"Lexus-15.jpg", @"Mercedes Benz-106.jpg",
@"Mini-11.jpg", @"Nissan Leaf-4.jpg",
@"Nissan Maxima-2.jpg" ];
5. Cut the call to perform the selector in the background from the car image view controller and paste it into the app delegate before the last line of applicationDidFinishLaunching:withOptions:.
Profile the app, zoom in, and focus on the first view of car images. This time, it looks something like Figure 14-8. setupScrollContent has gone from 183ms to 5ms—a significant savings.
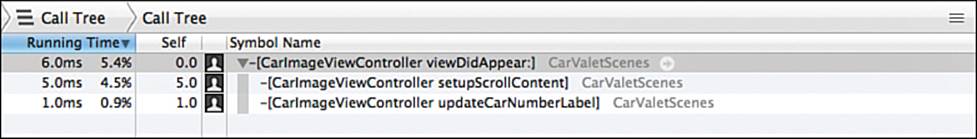
Figure 14-8 Prefetching in the app delegate
A Last Word on Instruments
The method for tuning the loading speed of the car images controller is basically the same method you use for any instrument:
1. Choose the performance area you want to investigate.
2. Profile your project using the appropriate template.
3. Search for places that indicate issues.
4. Zoom in and focus the call tree.
5. Use call tree mining to find possible issues.
6. Generate a hypothesis and update the code.
7. Profile and see if you fixed the issue.
8. Repeat these steps until you are satisfied.
One last word on Instruments: Exploring CarValet with other instruments is a good way to get an idea of how things should look. You should examine allocations to see what opening a new view controller looks like. You should also get a sense of the change in the amount of memory as you move through the app. You can do the same with the Activity Monitor template and other instruments to form a baseline for when you are troubleshooting.
Tip: Testing Your App
Testing your app is very important. You can use Apple’s provided unit tests for automated testing of the logic and some basic things, but not for the user experience. There is an Automation template in Instruments, but that requires a combination of JavaScript and the Accessibility mechanism in your app.
Using the Automation template is not a great solution for two reasons. First, it makes it next to impossible to add accessibility to your app. Second, it requires writing tests in a different language, JavaScript, and is executed in an atypical running application state.
A better solution is to run automated tests, preferably from the same unit test framework provided by Apple. Telerik provides such a tool. You see more about Telerik and testing in Chapter 15.
The Debugger
Bugs are a fact of life. No matter what precautions you take, you will encounter bugs. The important thing is how long it takes to track down and fix bugs. That is where the debugger comes in.
The underlying debugger is LLDB, and although the console command line is important for some things, Xcode provides a user interface to three important features: viewing variables, breakpoints, and stepping through code.
When you hit a breakpoint or when a crash occurs, Xcode gives you access to a lot of information and tools. Figure 14-9 shows the CarValet app stopped at a breakpoint.
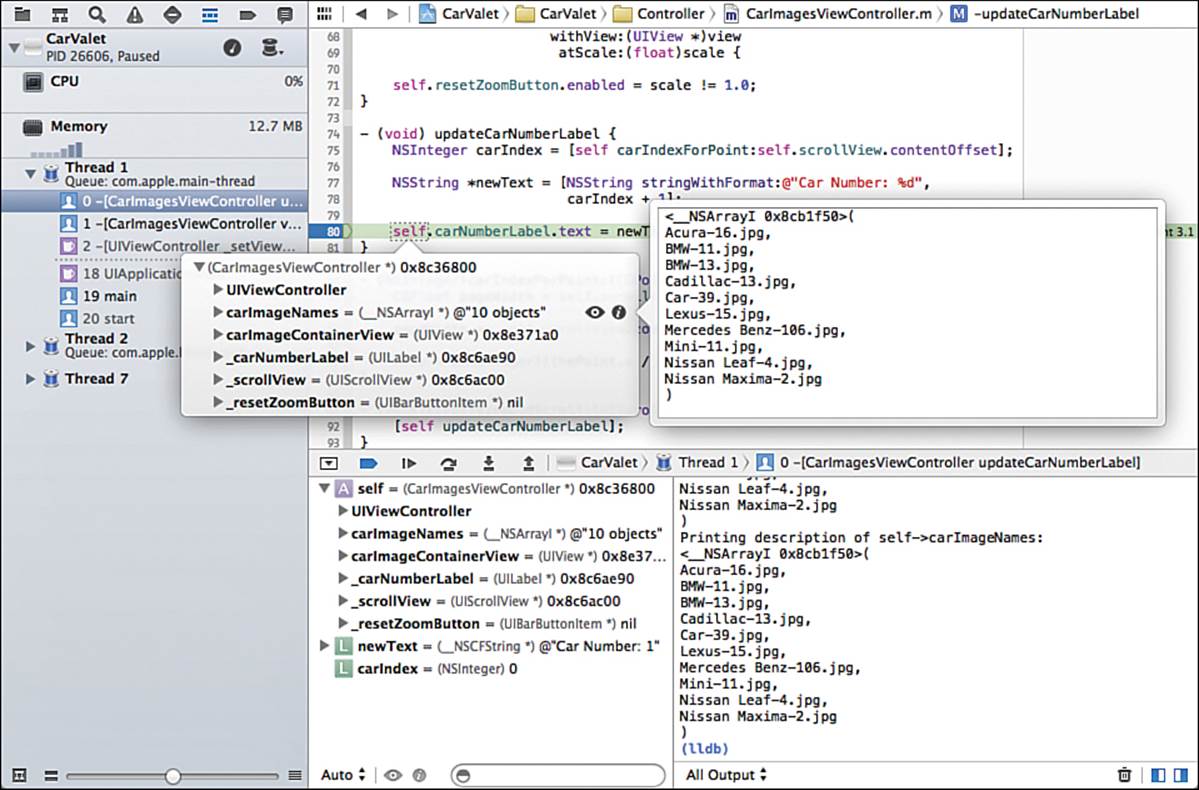
Figure 14-9 Xcode debugging information
On the left is the process view. Here you can see a list of active threads, with the one containing the breakpoint or crash showing the current call stacktrace. To the right is the code view, with the executing line highlighted in green. In this case, there is a breakpoint as well as a highlight.
You can show the code for any call in the stacktrace—including assembly, where available for system calls—by clicking. The icons next to the call tell you where it originated. Again, the human head and shoulder profile indicates the current method is one of yours.
When you hover over a variable in the editor, such as self halfway down the edit view in Figure 14-9, you see a dropdown. When you expand that dropdown, you see current values. Tap the info icon to get more detail for an object—in this case, the array of car images. You can use the eye icon to see a preview of the object, including images, as shown in Figure 14-10.
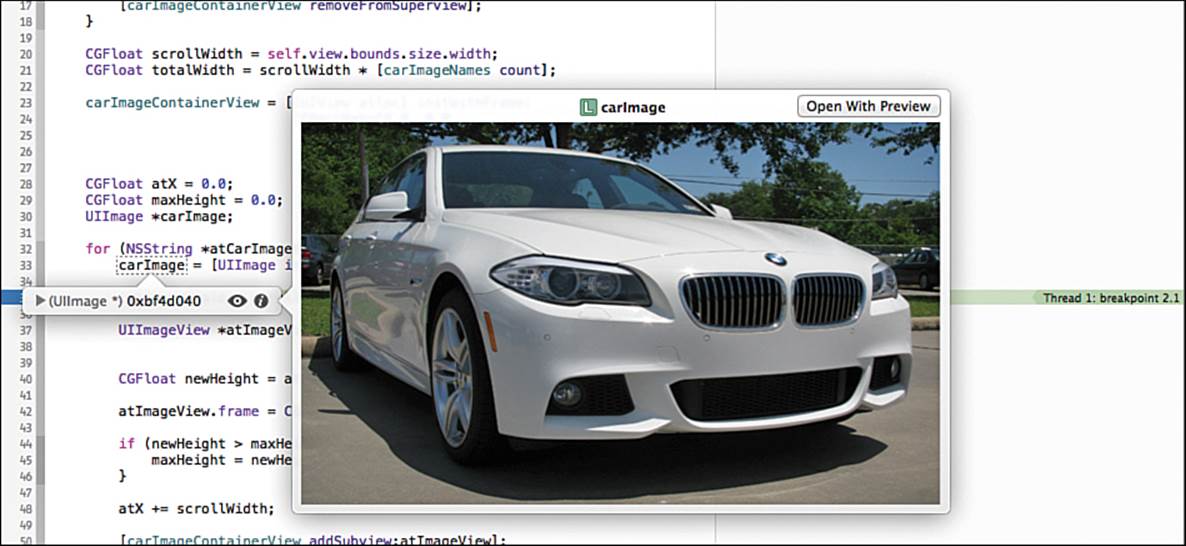
Figure 14-10 Previewing variable contents
The variables view is on the bottom left next to the navigation panel. The bar above the variables panel enables you to control pausing, continuing, and stepping over/into/out of code. The framed dropdown arrow on the left of the panel controls what variables are shown. The default Auto setting shows you any variables that are relevant for the current line of code. You can also show just locals, or everything including globals and registers. Clicking the triangle next to a variable shows more information.
Ctrl-clicking a variable opens a context-sensitive menu that lets you do anything from printing the value of the variable in the console, watching it, or looking at the raw memory. Context-sensitive menus are available all over Xcode and are well worth exploring. They can be significant time savers.
Also on the bottom is the console. Here you can type in LLDB commands to print objects or, as you have seen in previous chapters, access iOS debugging calls such as tracing auto layout.
Debug Gauges: Mini “Instruments”
In Figure-14-9, two items are at the top level of the navigation pane, CPU and Memory. These debug gauges are like mini instruments that are updated with statistics for your app. They introduce very little overhead and are a great way to spot when it is time to profile for more detail. Other gauges are available depending on the type of app and the target.
The CPU gauge, shown in Figure 14-11, is good for catching performance problems before they become problems. If you find performance a bit sluggish, take a quick look with the CPU gauge. Spikes indicate that you might need to do something more efficiently. Launching Instruments to hone in on the issue is as easy as clicking the Profile in Instruments button in the upper-right area of the gauge.
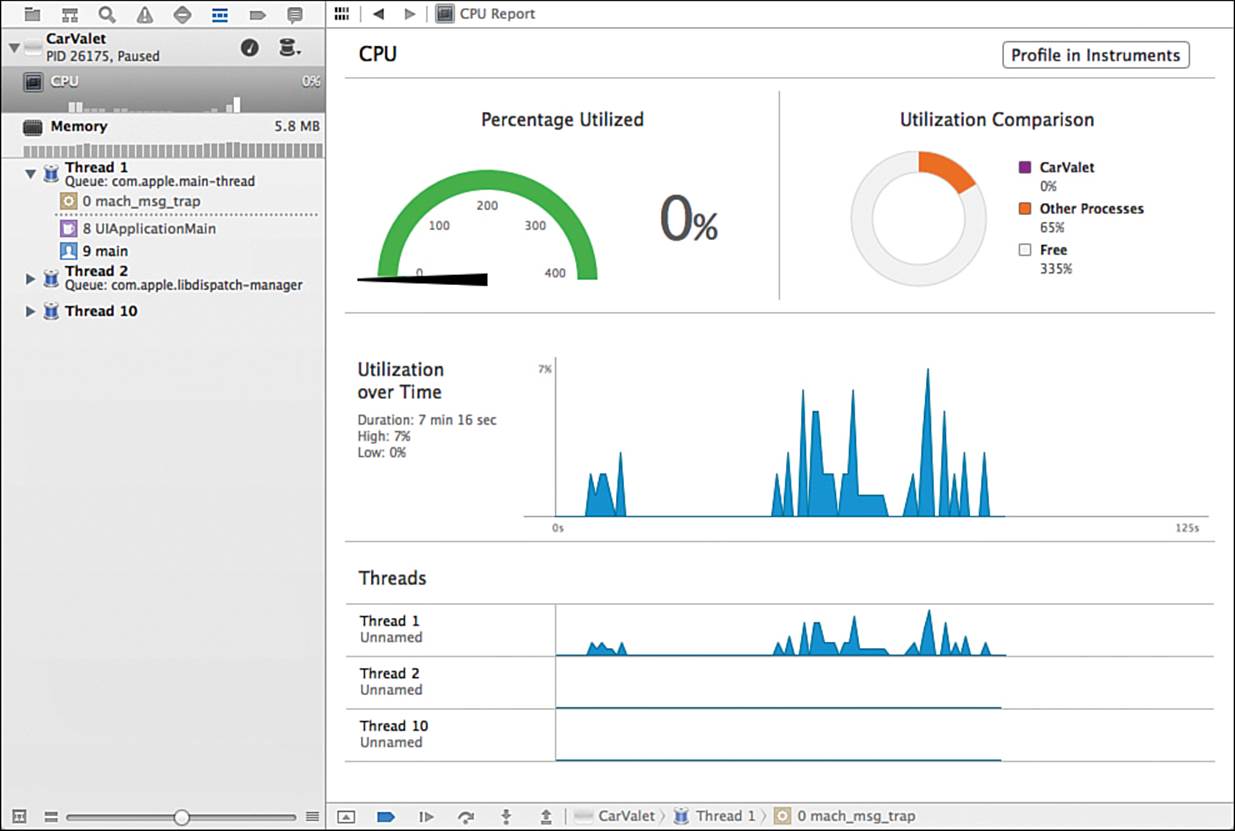
Figure 14-11 The CPU gauge
Figure 14-12 shows the Memory gauge. The ongoing memory graph is great for seeing both unexpected spikes and times when memory should free up but does not. Allocating a new scene should increase usage; closing that scene usually reclaims memory. Other events, such as allocating the array of car images, can increase usage. Look for bumps where not much is supposed to happen.
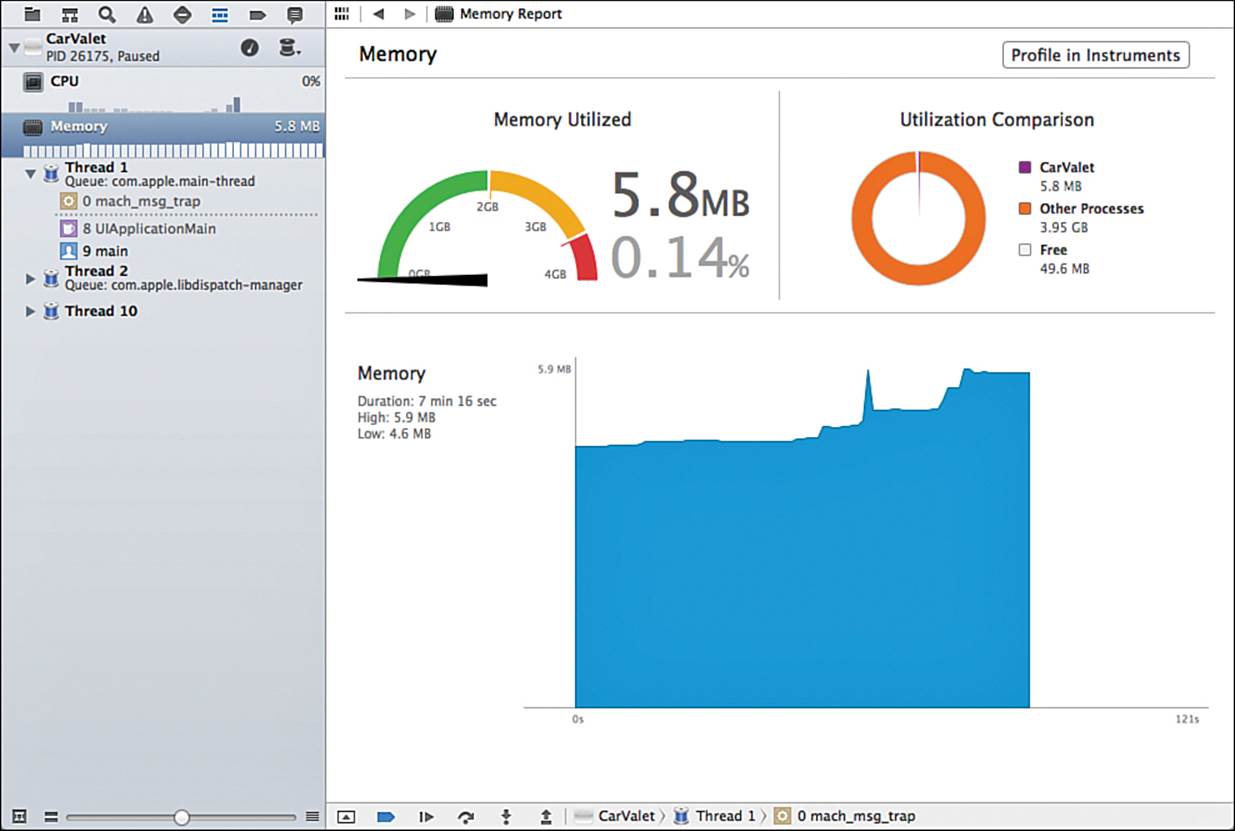
Figure 14-12 The Memory gauge
In addition to showing the ongoing memory usage, the meter in the upper left lets you know when memory use is becoming an issue. And once again, you can profile at the press of a button.
One last comment on the gauges: The navigation column shows a miniature form of the graphs for each gauge. If you need something else in the main window, you can keep your eye on these graphs. If things look like they need your attention, just click the relevant gauge.
Breakpoints, and Actions, and Code...Oh My!
Using a breakpoint is a way to stop code execution at a place you choose, or when any problems occur. All you do is click in the line number next to a piece of code, and Xcode inserts a breakpoint. Figure 14-9 showed one in blue on line 80.
When running code (on both the simulator and real devices) hits a breakpoint, Xcode stops execution and enters the debugger. You can examine the call stack, look at variables, step over code, or even step into other methods. The variable window shows you values and even lets you change aBOOL from YES to NO.
Most people try to find issues by inserting an NSLog statement where they think the issue is, running the code, getting closer, putting in different NSLogs, and rerunning. They repeat this cycle until they can find a good place for a breakpoint.
But using this method is very inefficient and misses the real power of breakpoints. To see how powerful breakpoints can be, set one in your code by clicking on any line number to the left of the editor. Now Ctrl-click on that breakpoint and choose Edit Breakpoint from the contextual menu. You get a popup like the one shown in Figure 14-13.
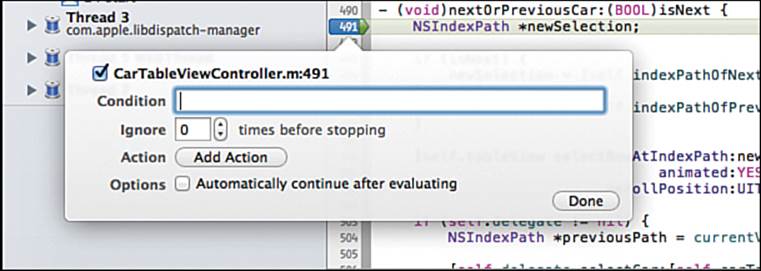
Figure 14-13 Edit breakpoint popup
Condition tells the debugger to trigger the breakpoint only when a condition is met. If you enter for !isNext as the condition, only the breakpoint for going to a previous car is triggered.
Ignore causes the debugger to ignore the breakpoint for a specified number of times.
Actions are the most powerful piece here. After clicking the Add Action button, you can choose from a few different actions. The most useful are logging a message, running a debugger command, and playing a sound. In combination with the option to automatically continue, you can replaceNSLog statements with something much more powerful. More importantly, you do not have to compile and run your app. You simply add a new breakpoint and set the action.
A Practical Action Example
Let’s look at an example that involves replacing NSLog. There are two ways to do this, and the one you choose depends on how much information you need. If you just need a simple string with basic information, the log message action might be enough. If you need detailed variable contents, the debugger command is better.
Say that you want to get an idea of how many times dragging the About screen taxi updates the frame. Follow these steps:
1. Open your latest version of the CarValet project or the provided CH14 CarValet Starter project in Xcode.
2. Open DragViewGesture.m and put a breakpoint on line 47.
3. Edit the breakpoint, add a log message action, and set its contents to Update Rect: %H. The last part prints a count of how many times the breakpoint has been hit.
4. Set the option for the breakpoint to automatically continue.
Now run the app in a simulator. Go to the About screen and start dragging the taxi. The console starts filling with Update Rect messages, with an increasing count.
Now say that you want to see the new rectangle. Leave the app running and follow these steps:
1. Edit the breakpoint.
2. Change the breakpoint to a debugger command and set the contents of the command to p (CGRect)newRect. In the debugger, this says print newRect as a CGRect.
Continue dragging the taxi, and the output in the console changes. You get the value. But there is more. On the same line as the action type popup are circles with a + and –. These let you add (or remove) more actions. Add a log action identical to the one you added earlier. Run the app, and now you see both the log message and the rectangle.
You made all these changes with the app still running. There was no need to rebuild and rerun. This time saving alone can be a huge benefit. And this is a very effective way of debugging strokes. If you need to confirm that the method is happening, you can set a sound and let the breakpoint automatically continue.
Another Useful Breakpoint
So far you have set breakpoints in your code. But there are two other types of breakpoints that help isolate problems. Figure 14-14 shows the breakpoint navigator and the dropdown from the Add button, showing each type of breakpoint.
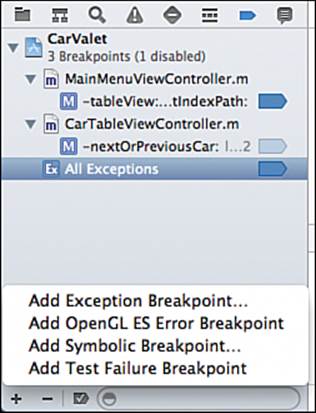
Figure 14-14 The breakpoint navigator
You use symbolic breakpoints when you do not have the source code. They enable you to stop on any symbol in a particular library. Although using them is beyond the scope of this book, a quick example will get you started. Say you know that a crash was caused byUINavigationController calling viewDidLoad:. Normally, you could not set a breakpoint because that is not your code. However, you can set symbolic breakpoints in that code. When you edit the breakpoint, look for the Symbol item and set it to the following:
–[UINavigationController viewDidLoad:]
The debugger stops every time that routine is entered. Of course, you will see assembly code, but it may get you closer to a solution.
Exception breakpoints are the other type. During active development, you should always have an All Exceptions breakpoint, though it may not always be enabled. This is a good way to catch errors as soon as they are introduced. The code stops as soon as the exception is encountered, giving you the best chance of finding the error.
Bug Hunt: Instruments and the Debugger
Every programmer dreads the crash...EXC_BAD_ACCESS. When this error occurs, you know that something has tried to access an object that is no longer allocated. These are the hardest problems to find because the code causing the problem usually happens at a very different place from the exception. And although ARC cuts down on these errors, it does not prevent them.
Tracking down this kind of problem is best done with both Instruments and the debugger. Instruments helps you find what object is causing the problem, and then you can use breakpoints to test your hypotheses about how the dead object is being accessed.
To get some practice tracking down this kind of problem, open the project in CH14 CarValet Bug and run it on an iPhone Simulator, following these steps:
1. View the detail of a car and go back and forth a few times.
2. Return to the top-level cars table menu.
3. Open the About tab.
4. Return to the Cars tab.
5. The app should crash. If it does not, repeat steps 1 through 4 until it does.
The current information in Xcode is not very useful. The code area is filled with assembly, and the stack trace has no app methods; in fact, it has very few items. The top one (item 0) is an Objective-C message send. This does not give you much help isolating the issue. But you can use both the Zombies instrument and the debugger to find what you need. The following sections show you how.
Starting with Zombies
Memory errors are difficult to find. Usually the source of the problem occurs long before the unexpected behavior or crash. When the system deallocates an object, that memory gets reused for some other object or primitive variable. The worst cases are when the memory does the following:
![]() Is not reused until after a few calls to the object and then is changed to something else. Everything appears to be working even though there is a lurking problem.
Is not reused until after a few calls to the object and then is changed to something else. Everything appears to be working even though there is a lurking problem.
![]() Is reused for the same kind of object that likely has different values.
Is reused for the same kind of object that likely has different values.
![]() Is reused for a primitive variable or a different class of object. A primitive value used as a pointer either points to some random place or might be an illegal value. A new object of a different class does not respond to messages or have the same instance variables.
Is reused for a primitive variable or a different class of object. A primitive value used as a pointer either points to some random place or might be an illegal value. A new object of a different class does not respond to messages or have the same instance variables.
When you suspect a memory error, or even if you do not, you can enable the memory management diagnostic tools provided by Xcode for your debug build. These tools work for both C and Objective-C memory allocations. For Objective-C, they turn any deallocated objects into Zombies. When your code references a Zombie, you get an immediate crash instead of getting a crash sometime later.
The Zombies Instrument template does all the necessary work to turn Zombies on. It is actually the Allocations instrument with the right checkbox checked. Figure 14-15 highlights the options panel and darkens the Zombie flag. Any time you see the Allocations instrument, you can turn Zombies on or off. The performance penalty is minimal.
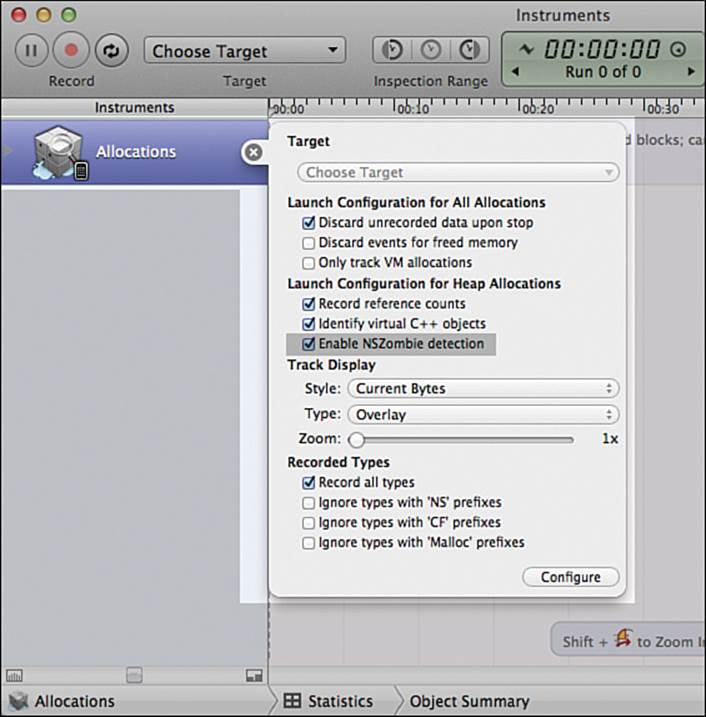
Figure 14-15 Enabling Zombies: Allocations Instrument options
Finding a Starting Point with Zombies
You need to profile the project from Xcode in Instruments and choose the Zombies template. Then you repeat the steps above until Instruments stops for Zombie access. You will see an automatically generated flag and popup much like the ones in Figure 14-16. When you click the circled arrow after the memory address, the bottom window changes to the history for the problem object.
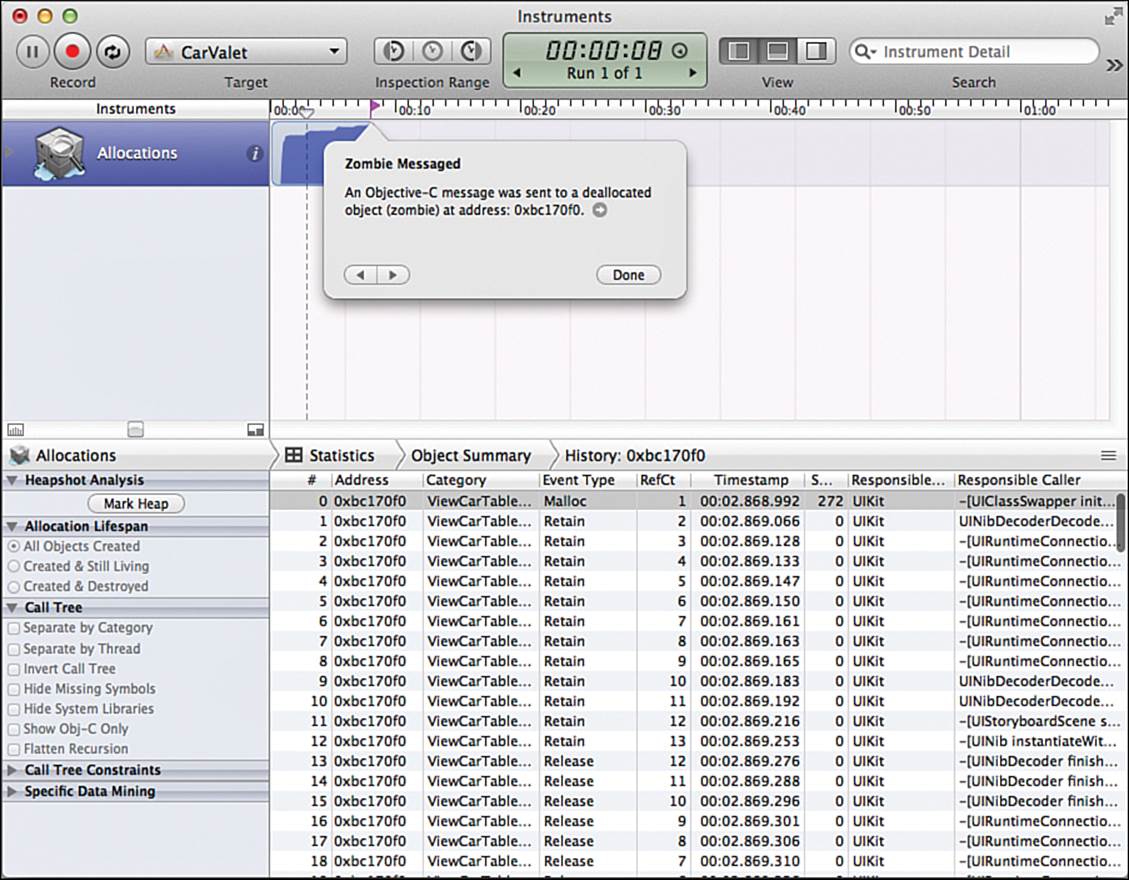
Figure 14-16 Instruments Zombie flag
The history can help you find the problem. First, the category tells you that the problem object is a kind of ViewCarTableViewController. This kind of makes sense because the car detail table should be released after you leave the car detail view. But this says something not only has a reference but also makes a call to the now-deallocated object.
The left-most column lists the originator and message at each step in the car detail table’s history. Scroll down to the bottom and expand the Responsible Caller column. Figure 14-17 shows that UINavigationController called viewWillAppear: on the overreleased car detail table view.
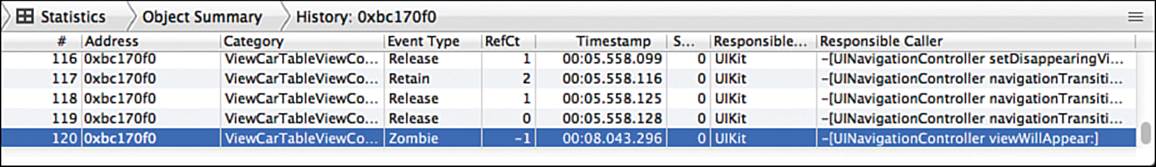
Figure 14-17 The Zombie call
Why is the navigation controller trying to send a message to car detail? The last user action for the cars tab was returning the cars table menu view. That should have popped the detail view off the navigation controller stack, but Instruments does not show what happened. It’s time to move on to the debugger.
Moving On to the Debugger
Instruments showed a call to viewWillAppear:, a part of the view-opening cycle, and that gives you a place to start with the debugger. To be safe, put a breakpoint in both viewDidLoad and viewWillAppear: in ViewCarTableViewController.m. Optionally, you can practice editing breakpoints and set the ignore count to 1 since you know the first call works.
Run the app and reproduce the crash. If you did not set an ignore count, or if you have to try multiple times to reproduce the condition, continue using the keyboard shortcut Ctrl-Cmd-Y instead of the Product > Debug submenu.
The app crashes, but it does not hit one of the breakpoints. That gives you a possible clue. You need to look at what you know:
![]() UINavigationController is sending a message to a Zombie, which means it has a weak reference. If it had a strong reference, there could be no Zombie since strong means retain.
UINavigationController is sending a message to a Zombie, which means it has a weak reference. If it had a strong reference, there could be no Zombie since strong means retain.
![]() None of the normal navigation flow, such as pops and pushes, use weak references; if there were weak references, there would be lots of crashes.
None of the normal navigation flow, such as pops and pushes, use weak references; if there were weak references, there would be lots of crashes.
![]() Similarly, changing the navigation view stack only results in strong references as you are either setting a new array or adding objects to an array.
Similarly, changing the navigation view stack only results in strong references as you are either setting a new array or adding objects to an array.
![]() Therefore, an object must be setting a weak reference in the navigation controller, and a good place to begin looking is in the Zombie class: ViewCarTableViewController.
Therefore, an object must be setting a weak reference in the navigation controller, and a good place to begin looking is in the Zombie class: ViewCarTableViewController.
For the next part of your investigation, follow these steps:
1. Open ViewCarTableViewController.m and search for UINavigationController. The only result is an argument type to a method, and that does not help.
2. Search for navigationController, the UIViewController property for the current navigation controller. There are only two real results. One clears the delegate in navigationController:didShowViewController:animated:. The other sets the delegate inviewWillAppear:.
3. Set breakpoints at the top of both methods you found in step 2 that modify the delegate.
Run the app and go through the steps that cause a crash. You know the issue is with the navigation controller, so focus your investigation there. At the debug prompt, type the following (and let autocompletion help you out with this):
po self.navigationController
This prints a valid navigation controller, the one managing the current view controller. Also look at the delegate property:
po [self.navigationController delegate]
This shows a nil value because you have not set the delegate. Step over lines with either the button in the debug control area between the editor and variables area or the F6 key until you pass the line that sets the delegate. Print out the delegate again, using the up-arrow key to repeat the previous command. Now you see the current view controller. You can confirm this by typing po self and checking that the object addresses match. Note that self is the current instance of ViewCarTableViewController, the currently active view controller.
Because you are at the end of the method, continue execution. At the next breakpoint, check the navigation controller’s delegate and make sure it is the same object as the previous method. The body of the if condition does not execute because viewController is not the cars menu.
Continue once again, swipe through a few cars, and then return to the cars menu. At the breakpoint, check the navigation controller’s delegate by using the up-arrow key to execute the previous command:
po [self.navigationController delegate]
You have not entered the if condition so have not cleared the delegate. Something is not right. The variables area shows that both method arguments have values and, more importantly, the viewController is a CarTableViewController. Check the delegate for the navigation controller sent in the method argument:
po [navigationController delegate]
This time, the delegate is correct. This says that the navigationController property for self has a problem. Print that out using the command:
po self.navigationController
You get nil! Step through the lines until just after the if condition sets the navigation controller’s delegate to nil. Once again, check the delegate by using this method argument:
po [navigationController delegate]
The delegate is unchanged. Now you have the source of the bug. The detail view is dismissed, and the cars menu shows. At some point in the future, the detail view controller is freed up, but the navigation controller still has a weak reference. It has one because the method calledself.navigationController instead of using the navigation controller sent as a method argument. (See the “Note: Why Did nil.delegate = nil Work?”) The fix is to change the one line of code to the following:
navigationController.delegate = nil;
After you make this change, run the code and check the behavior using the breakpoint. You should see that the delegate is correctly set to nil. There is no more weak reference, and the app runs correctly.
Note: Why Did nil.delegate = nil Work?
You might wonder why the buggy line was not flagged. First, the compiler and linker have no way of knowing the right side will evaluate to nil. And in the runtime, sending any message to nil is valid, as is reading any property of nil. The result is always nil.
Summary
In this chapter, you learned how to check performance and find bugs. You started with Instruments, learning the types of information you can gather. Then you used Instruments to find and fix an app performance problem.
Next, you took a tour of the debugger and learned the power of breakpoints. Then you applied that knowledge in a practical example of editing breakpoints. Finally, you used the power of Instruments and the debugger together to solve one of the hardest types of bugs.
Along the way, you learned about call tree mining, a method for finding and fixing problems with Instruments, and the value of background tasks.
Your application toolkit is complete. You can design and implement apps for iPhone/iPod touch and iPad, and you can also create universal apps that run on both form factors. You know how to choose the most appropriate controllers, what view elements make sense and how to use them, how to save data, and how to tune and debug.
The last part of this process is making your app available and making sure you know how it is doing after it launches. Chapter 15 takes you through the process of moving your app from Xcode to the App Store. You also explore the other kinds of things you might want in your app—things like metrics and bug reporting. And, of course, learning is an ongoing journey, so Chapter 15 ends with suggestions on where to find more information.
Challenges
1. This is a timesaving challenge. Open the project CH14 CarValet Challenge 1. Profile the app using the Time Profiler and run through the app. Find and fix the performance issue. The performance issue is bad enough to show up on the simulator, though a device makes it much more obvious. All the fixes are in the new timesaving class, not AppDelegate.
2. This challenge is a debugger issue, another problem you are likely to encounter. Open CH14 CarValet Challenge 2, choose the iPad Simulator, and run the app. Look at the details on a car, and wait for the crash. Now use the resources at your disposal to find and fix the bug.
3. It’s time to hunt your own EXC_BAD_ACCESS bug. Open the project in the CH14 CarValet Challenge 3 folder. Run the project in the iPad simulator and try rotating the screen. Find the bug using a combination of Instruments and the debugger.