Programming: Principles and Practice Using C++ (2014)
Part II: Input and Output
12. A Display Model
“The world was black and white then.
[It] didn’t turn color
until sometime in the 1930s.”
—Calvin’s dad
This chapter presents a display model (the output part of GUI), giving examples of use and fundamental notions such as screen coordinates, lines, and color. Line, Lines, Polygons, Axis, and Text are examples of Shapes. A Shape is an object in memory that we can display and manipulate on a screen. The next two chapters will explore these classes further, with Chapter 13 focusing on their implementation and Chapter 14 on design issues.
12.1 Why graphics?
12.2 A display model
12.3 A first example
12.4 Using a GUI library
12.5 Coordinates
12.6 Shapes
12.7 Using Shape primitives
12.7.1 Graphics headers and main
12.7.2 An almost blank window
12.7.3 Axis
12.7.4 Graphing a function
12.7.5 Polygons
12.7.6 Rectangles
12.7.7 Fill
12.7.8 Text
12.7.9 Images
12.7.10 And much more
12.8 Getting this to run
12.8.1 Source files
12.1 Why graphics?
Why do we spend four chapters on graphics and one on GUIs (graphical user interfaces)? After all, this is a book about programming, not a graphics book. There is a huge number of interesting software topics that we don’t discuss, and we can at best scratch the surface on the topic of graphics. So, “Why graphics?” Basically, graphics is a subject that allows us to explore several important areas of software design, programming, and programming language facilities:
• Graphics are useful. There is much more to programming than graphics and much more to software than code manipulated through a GUI. However, in many areas good graphics are either essential or very important. For example, we wouldn’t dream of studying scientific computing, data analysis, or just about any quantitative subject without the ability to graph data. Chapter 15 gives simple (but general) facilities for graphing data.
• Graphics are fun. There are few areas of computing where the effect of a piece of code is as immediately obvious and — when finally free of bugs — as pleasing. We’d be tempted to play with graphics even if it wasn’t useful!
• Graphics provide lots of interesting code to read. Part of learning to program is to read lots of code to get a feel for what good code is like. Similarly, the way to become a good writer of English involves reading a lot of books, articles, and quality newspapers. Because of the direct correspondence between what we see on the screen and what we write in our programs, simple graphics code is more readable than most kinds of code of similar complexity. This chapter will prove that you can read graphics code after a few minutes of introduction; Chapter 13 will demonstrate how you can write it after another couple of hours.
• Graphics are a fertile source of design examples. It is actually hard to design and implement a good graphics and GUI library. Graphics are a very rich source of concrete and practical examples of design decisions and design techniques. Some of the most useful techniques for designing classes, designing functions, separating software into layers (of abstraction), and constructing libraries can be illustrated with a relatively small amount of graphics and GUI code.
• Graphics provide a good introduction to what is commonly called object-oriented programming and the language features that support it. Despite rumors to the contrary, object-oriented programming wasn’t invented to be able to do graphics (see Chapter 22), but it was soon applied to that, and graphics provide some of the most accessible examples of object-oriented designs.
• Some of the key graphics concepts are nontrivial. So they are worth teaching, rather than leaving it to your own initiative (and patience) to seek out information. If we did not show how graphics and GUI were done, you might consider them “magic,” thus violating one of the fundamental aims of this book.
12.2 A display model
The iostream library is oriented toward reading and writing streams of characters as they might appear in a list of numeric values or a book. The only direct supports for the notion of graphical position are the newline and tab characters. You can embed notions of color and two-dimensional positions, etc. in a one-dimensional stream of characters. That’s what layout (typesetting, “markup”) languages such as Troff, TeX, Word, HTML, and XML (and their associated graphical packages) do. For example:
<hr>
<h2>
Organization
</h2>
This list is organized in three parts:
<ul>
<li><b>Proposals</b>, numbered EPddd, . . .</li>
<li><b>Issues</b>, numbered EIddd, . . .</li>
<li><b>Suggestions</b>, numbered ESddd, . . .</li>
</ul>
<p>We try to . . .
<p>
This is a piece of HTML specifying a header (<h2> . . . </h2>), a list (<ul> . . . </ul>) with list items (<li> . . . </li>), and a paragraph (<p>). We left out most of the actual text because it is irrelevant here. The point is that you can express layout notions in plain text, but the connection between the characters written and what appears on the screen is indirect, governed by a program that interprets those “markup” commands. Such techniques are fundamentally simple and immensely useful (just about everything you read has been produced using them), but they also have their limitations.
In this chapter and the next four, we present an alternative: a notion of graphics and of graphical user interfaces that is directly aimed at a computer screen. The fundamental concepts are inherently graphical (and two-dimensional, adapted to the rectangular area of a computer screen), such as coordinates, lines, rectangles, and circles. The aim from a programming point of view is a direct correspondence between the objects in memory and the images on the screen.
![]()
The basic model is as follows: We compose objects with basic objects provided by a graphics system, such as lines. We “attach” these graphics objects to a window object, representing our physical screen. A program that we can think of as the display itself, as “a display engine,” as “our graphics library,” as “the GUI library,” or even (humorously) as “the small gnome writing on the back of the screen,” then takes the objects we have attached to our window and draws them on the screen:
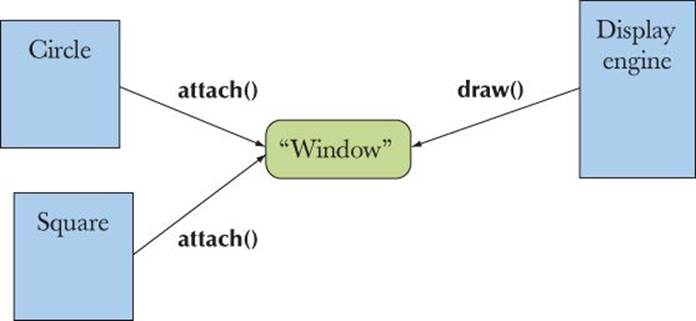
The “display engine” draws lines on the screen, places strings of text on the screen, colors areas of the screen, etc. For simplicity, we’ll use the phrase “our GUI library” or even “the system” for the display engine even though our GUI library does much more than just drawing the objects. In the same way that our code lets the GUI library do most of the work for us, the GUI library delegates much of its work to the operating system.
12.3 A first example
Our job is to define classes from which we can make objects that we want to see on the screen. For example, we might want to draw a graph as a series of connected lines. Here is a small program presenting a very simple version of that:
#include "Simple_window.h" // get access to our window library
#include "Graph.h" // get access to our graphics library facilities
int main()
{
using namespace Graph_lib; // our graphics facilities are in Graph_lib
Point tl {100,100}; // to become top left corner of window
Simple_window win {tl,600,400,"Canvas"}; // make a simple window
Polygon poly; // make a shape (a polygon)
poly.add(Point{300,200}); // add a point
poly.add(Point{350,100}); // add another point
poly.add(Point{400,200}); // add a third point
poly.set_color(Color::red); // adjust properties of poly
win.attach (poly); // connect poly to the window
win.wait_for_button(); // give control to the display engine
}
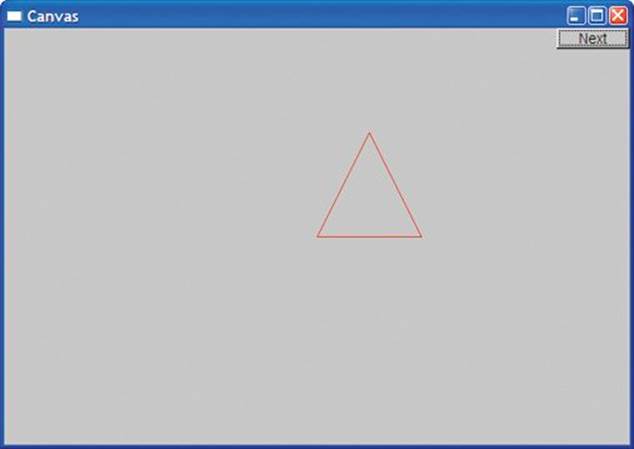
When we run this program, the screen looks something like this:

Let’s go through the program line by line to see what was done. First we include the headers for our graphics interface libraries:
#include "Simple_window.h" // get access to our window library
#include "Graph.h" // get access to our graphics library facilities
Then, in main(), we start by telling the compiler that our graphics facilities are to be found in Graph_lib:
using namespace Graph_lib; // our graphics facilities are in Graph_lib
Then, we define a point that we will use as the top left corner of our window:
Point tl {100,100}; // to become top left corner of window
Next, we create a window on the screen:
Simple_window win {tl,600,400,"Canvas"}; // make a simple window
We use a class representing a window in our Graph_lib interface library called Simple_window. The name of this particular Simple_window is win; that is, win is a variable of class Simple_window. The initializer list for win starts with the point to be used as the top left corner, tl, followed by600 and 400. Those are the width and height, respectively, of the window, as displayed on the screen, measured in pixels. We’ll explain in more detail later, but the main point here is that we specify a rectangle by giving its width and height. The string Canvas is used to label the window. If you look, you can see the word Canvas in the top left corner of the window’s frame.
Next, we put an object in the window:
Polygon poly; // make a shape (a polygon)
poly.add(Point{300,200}); // add a point
poly.add(Point{350,100}); // add another point
poly.add(Point{400,200}); // add a third point
We define a polygon, poly, and then add points to it. In our graphics library, a Polygon starts empty and we can add as many points to it as we like. Since we added three points, we get a triangle. A point is simply a pair of values giving the x and y (horizontal and vertical) coordinates within a window.
Just to show off, we then color the lines of our polygon red:
poly.set_color(Color::red); // adjust properties of poly
Finally, we attach poly to our window, win:
win.attach(poly); // connect poly to the window
If the program wasn’t so fast, you would notice that so far nothing had happened to the screen: nothing at all. We created a window (an object of class Simple_window, to be precise), created a polygon (called poly), painted that polygon red (Color::red), and attached it to the window (calledwin), but we have not yet asked for that window to be displayed on the screen. That’s done by the final line of the program:
win.wait_for_button(); // give control to the display engine
To get a GUI system to display objects on the screen, you have to give control to “the system.” Our wait_for_button() does that, and it also waits for you to “press” (“click”) the “Next” button of our Simple_window before proceeding. This gives you a chance to look at the window before the program finishes and the window disappears. When you press the button, the program terminates, closing the window.
In isolation, our window looks like this:
You’ll notice that we “cheated” a bit. Where did that button labeled “Next” come from? We built it into our Simple_window class. In Chapter 16, we’ll move from Simple_window to “plain” Window, which has no potentially spurious facilities built in, and show how we can write our own code to control interaction with a window.
For the next three chapters, we’ll simply use that “Next” button to move from one “display” to the next when we want to display information in stages (“frame by frame”).
You are so used to the operating system putting a frame around each window that you might not have noticed it specifically. However, the pictures in this and the following chapters were produced on a Microsoft Windows system, so you get the usual three buttons on the top right “for free.” This can be useful: if your program gets in a real mess (as it surely will sometimes during debugging), you can kill it by hitting the X button. When you run your program on another system, a different frame will be added to fit that system’s conventions. Our only contribution to the frame is the label (here, Canvas).
12.4 Using a GUI library
![]()
In this book, we will not use the operating system’s graphical and GUI (graphical user interface) facilities directly. Doing so would limit our programs to run on a single operating system and would also force us to deal directly with a lot of messy details. As with text I/O, we’ll use a library to smooth over operating system differences, I/O device variations, etc. and to simplify our code. Unfortunately, C++ does not provide a standard GUI library the way it provides the standard stream I/O library, so we use one of the many available C++ GUI libraries. So as not to tie you directly into one of those GUI libraries, and to save you from hitting the full complexity of a GUI library all at once, we use a set of simple interface classes that can be implemented in a couple of hundred lines of code for just about any GUI library.
The GUI toolkit that we are using (indirectly for now) is called FLTK (Fast Light Tool Kit, pronounced “full tick”) from www.fltk.org. Our code is portable wherever FLTK is used (Windows, Unix, Mac, Linux, etc.). Our interface classes can also be re-implemented using other toolkits, so code using them is potentially even more portable.
The programming model presented by our interface classes is far simpler than what common toolkits offer. For example, our complete graphics and GUI interface library is about 600 lines of C++ code, whereas the extremely terse FLTK documentation is 370 pages. You can download that from www.fltk.org, but we don’t recommend you do that just yet. You can do without that level of detail for a while. The general ideas presented in Chapters 12-16 can be used with any popular GUI toolkit. We will of course explain how our interface classes map to FLTK so that you will (eventually) see how you can use that (and similar toolkits) directly, if necessary.
We can illustrate the parts of our “graphics world” like this:
![]()
Our interface classes provide a simple and user-extensible basic notion of two-dimensional shapes with limited support for the use of color. To drive that, we present a simple notion of GUI based on “callback” functions triggered by the use of user-defined buttons, etc. on the screen (Chapter 16).
12.5 Coordinates
![]()
A computer screen is a rectangular area composed of pixels. A pixel is a tiny spot that can be given some color. The most common way of modeling a screen in a program is as a rectangle of pixels. Each pixel is identified by an x (horizontal) coordinate and a y (vertical) coordinate. The xcoordinates start with 0, indicating the leftmost pixel, and increase (toward the right) to the rightmost pixel. The y coordinates start with 0, indicating the topmost pixel, and increase (toward the bottom) to the lowest pixel:

![]()
Please note that y coordinates “grow downward.” Mathematicians, in particular, find this odd, but screens (and windows) come in many sizes, and the top left point is about all that they have in common.
The number of pixels available depends on the screen: 1024-by-768, 1280-by-1024, 1400-by-1050, and 1600-by-1200 are common screen sizes.
In the context of interacting with a computer using a screen, a window is a rectangular region of the screen devoted to some specific purpose and controlled by a program. A window is addressed exactly like a screen. Basically, we see a window as a small screen. For example, when we said
Simple_window win {tl,600,400,"Canvas"};
we requested a rectangular area 600 pixels wide and 400 pixels high that we can address as 0-599 (left to right) and 0-399 (top to bottom). The area of a window that you can draw on is commonly referred to as a canvas. The 600-by-400 area refers to “the inside” of the window, that is, the area inside the system-provided frame; it does not include the space the system uses for the title bar, quit button, etc.
12.6 Shapes
Our basic toolbox for drawing on the screen consists of about a dozen classes:
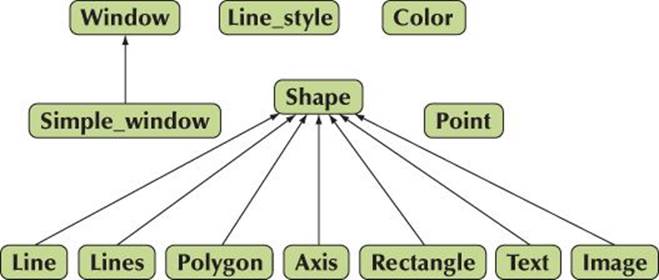
An arrow indicates that the class pointing can be used where the class pointed to is required. For example, a Polygon can be used where a Shape is required; that is, a Polygon is a kind of Shape.
We will start out presenting and using
• Simple_window, Window
• Shape, Text, Polygon, Line, Lines, Rectangle, Function, etc.
• Color, Line_style, Point
• Axis
Later (Chapter 16), we’ll add GUI (user interaction) classes:
• Button, In_box, Menu, etc.
We could easily add many more classes (for some definition of “easy”), such as
• Spline, Grid, Block_chart, Pie_chart, etc.
However, defining or describing a complete GUI framework with all its facilities is beyond the scope of this book.
12.7 Using Shape primitives
In this section, we will walk you through some of the primitive facilities of our graphics library: Simple_window, Window, Shape, Text, Polygon, Line, Lines, Rectangle, Color, Line_style, Point, Axis. The aim is to give you a broad view of what you can do with those facilities, but not yet a detailed understanding of any of those classes. In the next chapters, we explore the design of each.
We will now walk through a simple program, explaining the code line by line and showing the effect of each on the screen. When you run the program you’ll see how the image changes as we add shapes to the window and modify existing shapes. Basically, we are “animating” the progress through the code by looking at the program as it is executed.
12.7.1 Graphics headers and main
First, we include the header files defining our interface to the graphics and GUI facilities:
#include "Window.h" // a plain window
#include "Graph.h"
or
#include "Simple_window.h" // if we want that “Next” button
#include "Graph.h"
As you probably guessed, Window.h contains the facilities related to windows and Graph.h the facilities related to drawing shapes (including text) into windows. These facilities are defined in the Graph_lib namespace. To simplify notation we use a namespace directive to make the names from Graph_lib directly available in our program:
using namespace Graph_lib;
As usual, main() contains the code we want to execute (directly or indirectly) and deals with exceptions:
int main ()
try
{
// . . . here is our code . . .
}
catch(exception& e) {
// some error reporting
return 1;
}
catch(...) {
// some more error reporting
return 2;
}
For this main() to compile, we need to have exception defined. We get that if we include std_lib_facilities.h as usual, or we could start to deal directly with standard headers and include <stdexcept>.
12.7.2 An almost blank window
We will not discuss error handling here (see Chapter 5, in particular, §5.6.3) but go straight to the graphics within main():
Point tl {100,100}; // top left corner of our window
Simple_window win {tl,600,400,"Canvas"};
// screen coordinate tl for top left corner
// window size(600*400)
// title: Canvas
win.wait_for_button(); // display!
This creates a Simple_window, that is, a window with a “Next” button, and displays it on the screen. Obviously, we need to have #included the header Simple_window.h rather than Window.h to get Simple_window. Here we are specific about where on the screen the window should go: its top left corner goes at Point{100,100}. That’s near, but not too near, the top left corner of the screen. Obviously, Point is a class with a constructor that takes a pair of integers and interprets them as an (x,y) coordinate pair. We could have written
Simple_window win {Point{100,100},600,400,"Canvas"};
However, we want to use the point (100,100) several times so it is more convenient to give it a symbolic name. The 600 is the width and 400 is the height of the window, and Canvas is the label we want put on the frame of the window.
To actually get the window drawn on the screen, we have to give control to the GUI system. We do this by calling win.wait_for_button() and the result is:
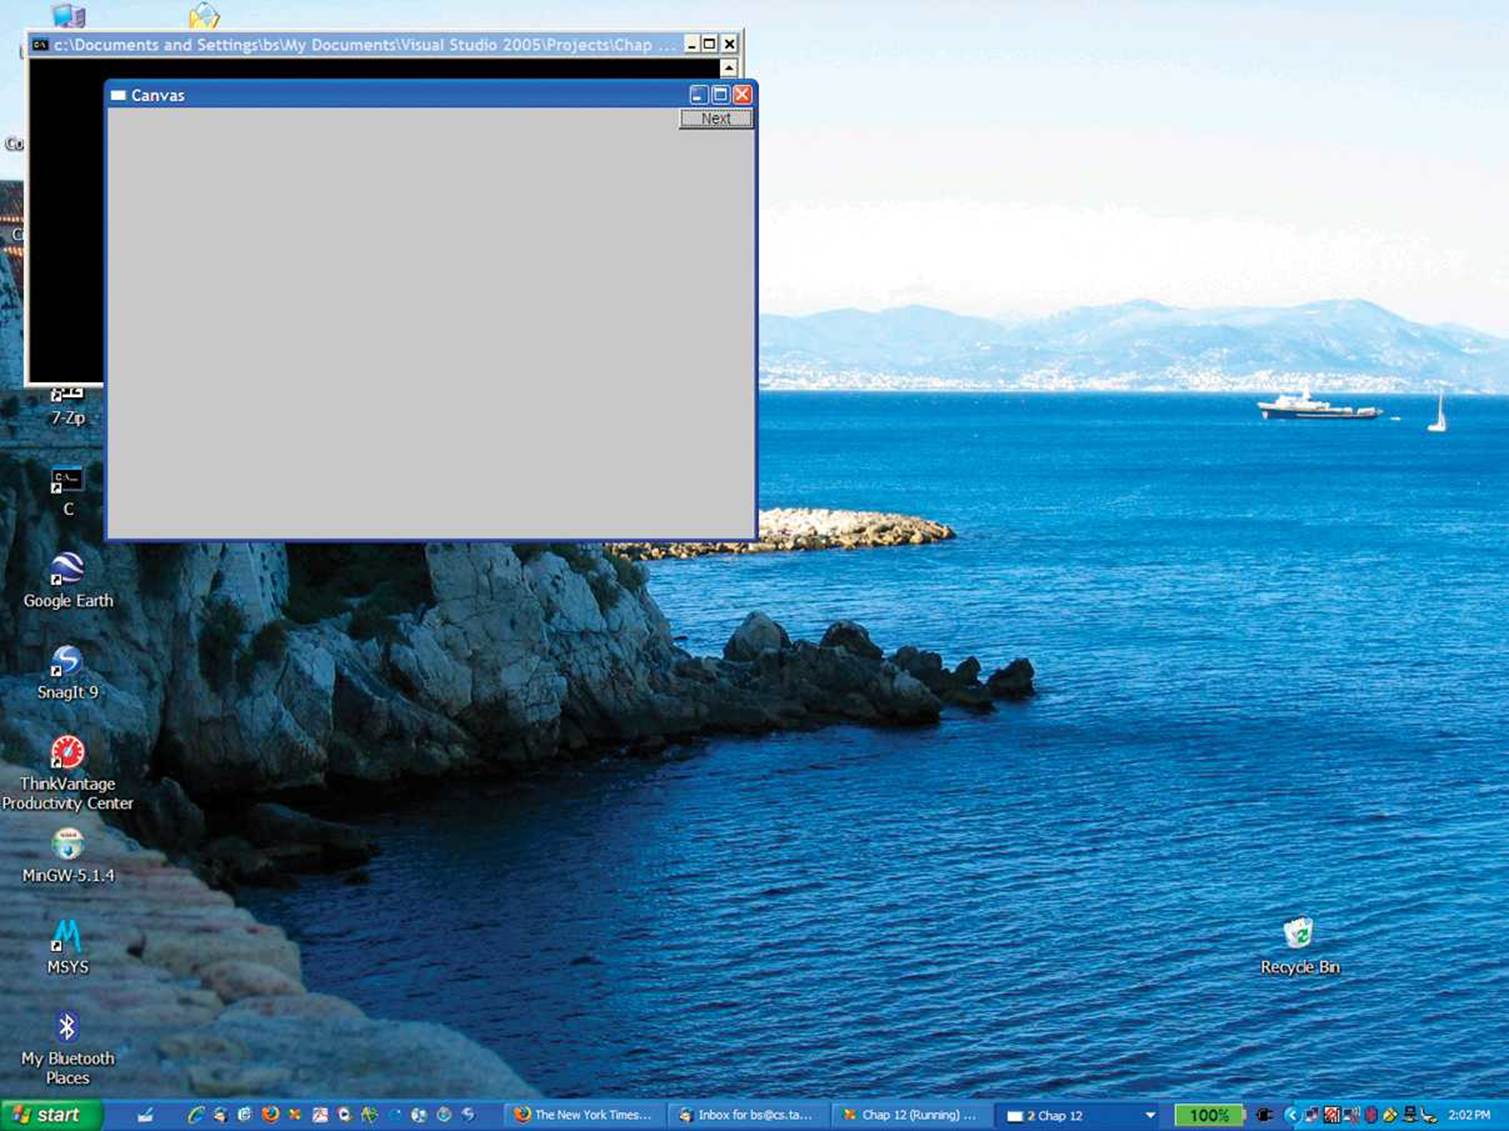
![]()
In the background of our window, we see a laptop screen (somewhat cleaned up for the occasion). For people who are curious about irrelevant details, we can tell you that I took the photo standing near the Picasso library in Antibes looking across the bay to Nice. The black console window partially hidden behind is the one running our program. Having a console window is somewhat ugly and unnecessary, but it has the advantage of giving us an effective way of killing our window if a partially debugged program gets into an infinite loop and refuses to go away. If you look carefully, you’ll notice that we have the Microsoft C++ compiler running, but you could just as well have used some other compiler (such as Borland or GNU).
For the rest of the presentation we will eliminate the distractions around our window and just show that window by itself:
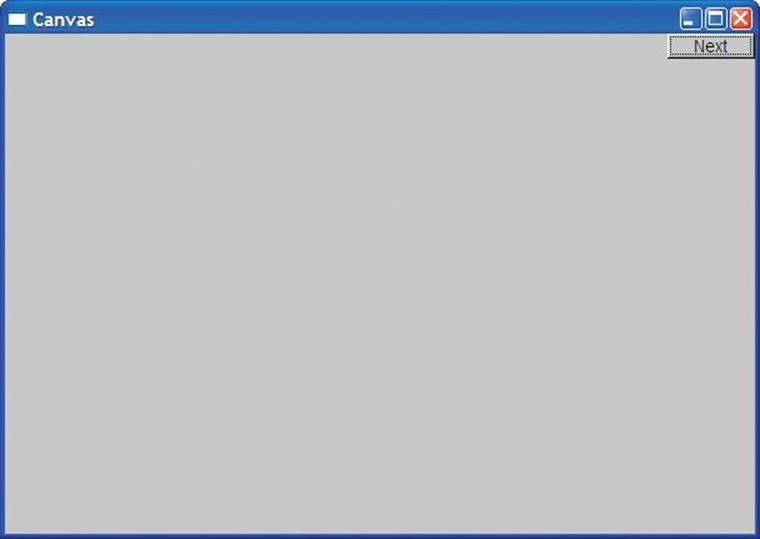
The actual size of the window (in inches) depends on the resolution of your screen. Some screens have bigger pixels than other screens.
12.7.3 Axis
An almost blank window isn’t very interesting, so we’d better add some information. What would we like to display? Just to remind you that graphics is not all fun and games, we will start with something serious and somewhat complicated: an axis. A graph without axes is usually a disgrace. You just don’t know what the data represents without axes. Maybe you explained it all in some accompanying text, but it is far safer to add axes; people often don’t read the explanation and often a nice graphical representation gets separated from its original context. So, a graph needs axes:
Axis xa {Axis::x, Point{20,300}, 280, 10, "x axis"}; // make an Axis
// an Axis is a kind of Shape
// Axis::x means horizontal
// starting at (20,300)
// 280 pixels long
// 10 “notches”
// label the axis "x axis"
win.attach(xa); // attach xa to the window, win
win.set_label("Canvas #2"); // relabel the window
win.wait_for_button(); // display!
The sequence of actions is: make the axis object, add it to the window, and finally display it:
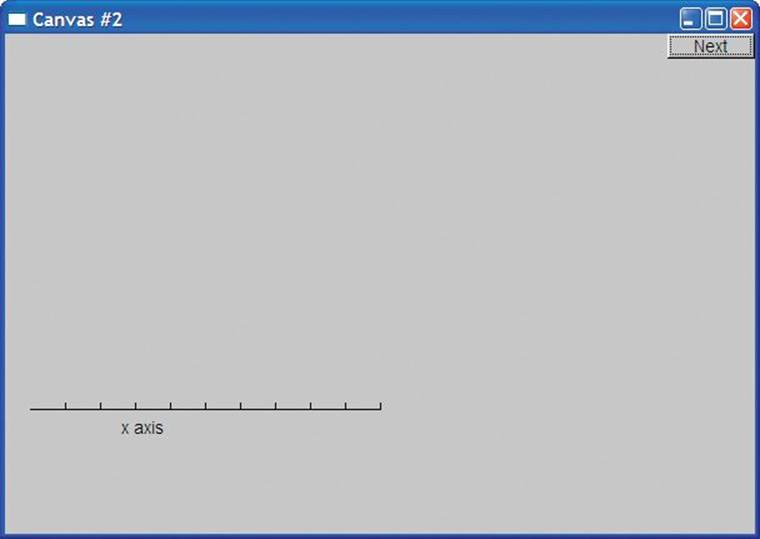
We can see that an Axis::x is a horizontal line. We see the required number of “notches” (10) and the label “x axis.” Usually, the label will explain what the axis and the notches represent. Naturally, we chose to place the x axis somewhere near the bottom of the window. In real life, we’d represent the height and width by symbolic constants so that we could refer to “just above the bottom” as something like y_max-bottom_margin rather than by a “magic constant,” such as 300 (§4.3.1, §15.6.2).
To help identify our output we relabeled the screen to Canvas #2 using Window’s member function set_label().
Now, let’s add a y axis:
Axis ya {Axis::y, Point{20,300}, 280, 10, "y axis"};
ya.set_color(Color::cyan); // choose a color
ya.label.set_color(Color::dark_red); // choose a color for the text
win.attach(ya);
win.set_label("Canvas #3");
win.wait_for_button(); // display!
Just to show off some facilities, we colored our y axis cyan and our label dark red.
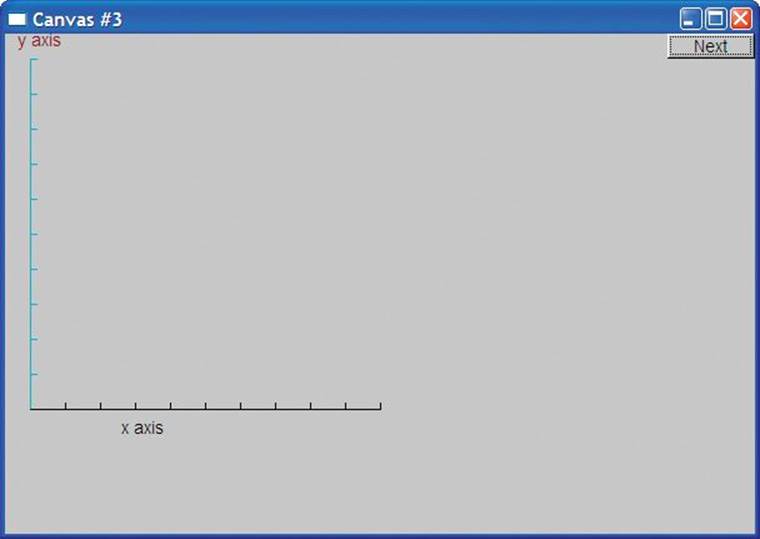
We don’t actually think that it is a good idea to use different colors for x and y axes. We just wanted to show you how you can set the color of a shape and of individual elements of a shape. Using lots of color is not necessarily a good idea. In particular, novices tend to use color with more enthusiasm than taste.
12.7.4 Graphing a function
What next? We now have a window with axes, so it seems a good idea to graph a function. We make a shape representing a sine function and attach it:
Function sine {sin,0,100,Point{20,150},1000,50,50}; // sine curve
// plot sin() in the range [0:100) with (0,0) at (20,150)
// using 1000 points; scale x values *50, scale y values *50
win.attach(sine);
win.set_label("Canvas #4");
win.wait_for_button();
Here, the Function named sine will draw a sine curve using the standard library function sin() to generate values. We explain details about how to graph functions in §15.3. For now, just note that to graph a function we have to say where it starts (a Point) and for what set of input values we want to see it (a range), and we need to give some information about how to squeeze that information into our window (scaling):
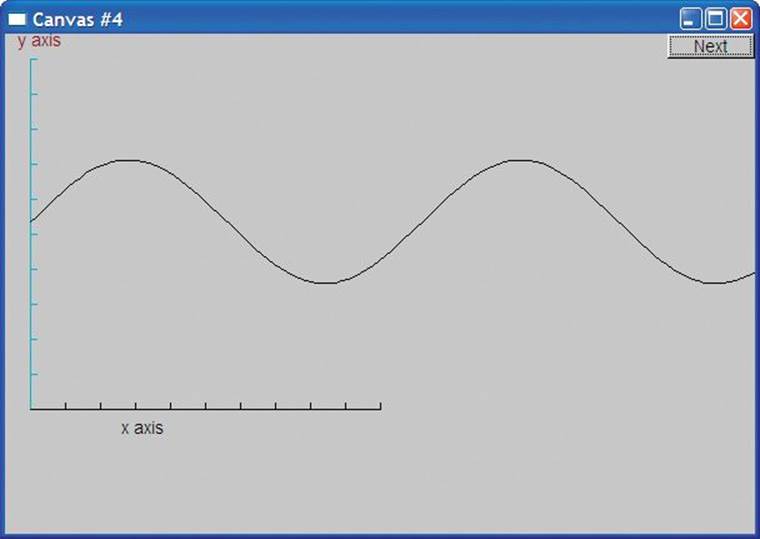
Note how the curve simply stops when it hits the edge of the window. Points drawn outside our window rectangle are simply ignored by the GUI system and never seen.
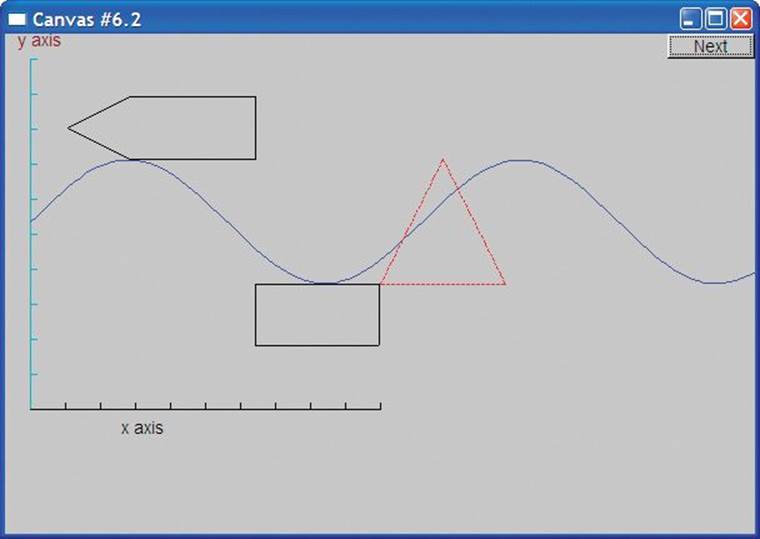
12.7.5 Polygons
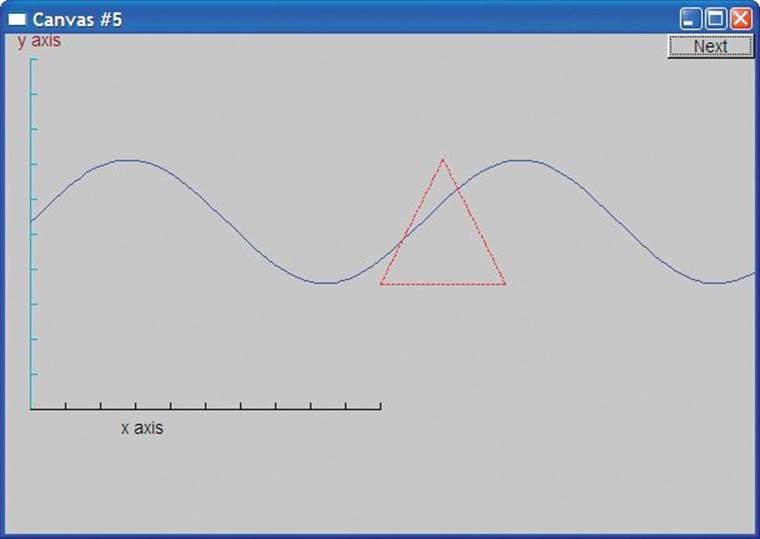
A graphed function is an example of data presentation. We’ll see much more of that in Chapter 15. However, we can also draw different kinds of objects in a window: geometric shapes. We use geometric shapes for graphical illustrations, to indicate user interaction elements (such as buttons), and generally to make our presentations more interesting. A Polygon is characterized by a sequence of points, which the Polygon class connects by lines. The first line connects the first point to the second, the second line connects the second point to the third, and the last line connects the last point to the first:
sine.set_color(Color::blue); // we changed our mind about sine’s color
Polygon poly; // a polygon; a Polygon is a kind of Shape
poly.add(Point{300,200}); // three points make a triangle
poly.add(Point{350,100});
poly.add(Point{400,200});
poly.set_color(Color::red);
poly.set_style(Line_style::dash);
win.attach(poly);
win.set_label("Canvas #5");
win.wait_for_button();
This time we change the color of the sine curve (sine) just to show how. Then, we add a triangle, just as in our first example from §12.3, as an example of a polygon. Again, we set a color, and finally, we set a style. The lines of a Polygon have a “style.” By default that is solid, but we can also make those lines dashed, dotted, etc. as needed (see §13.5). We get
12.7.6 Rectangles
![]()
A screen is a rectangle, a window is a rectangle, and a piece of paper is a rectangle. In fact, an awful lot of the shapes in our modern world are rectangles (or at least rectangles with rounded corners). There is a reason for this: a rectangle is the simplest shape to deal with. For example, it’s easy to describe (top left corner plus width plus height, or top left corner plus bottom right corner, or whatever), it’s easy to tell whether a point is inside a rectangle or outside it, and it’s easy to get hardware to draw a rectangle of pixels fast.
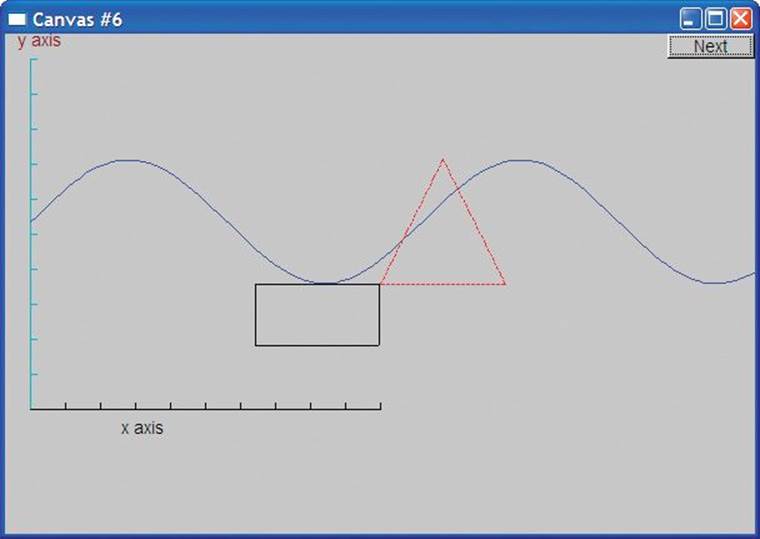
So, most higher-level graphics libraries deal better with rectangles than with other closed shapes. Consequently, we provide Rectangle as a class separate from the Polygon class. A Rectangle is characterized by its top left corner plus a width and height:
Rectangle r {Point{200,200}, 100, 50}; // top left corner, width, height
win.attach(r);
win.set_label("Canvas #6");
win.wait_for_button();
From that, we get
Please note that making a polyline with four points in the right places is not enough to make a Rectangle. It is easy to make a Closed_polyline that looks like a Rectangle on the screen (you can even make an Open_polyline that looks just like a Rectangle); for example:
Closed_polyline poly_rect;
poly_rect.add(Point{100,50});
poly_rect.add(Point{200,50});
poly_rect.add(Point{200,100});
poly_rect.add(Point{100,100});
win.attach(poly_rect);
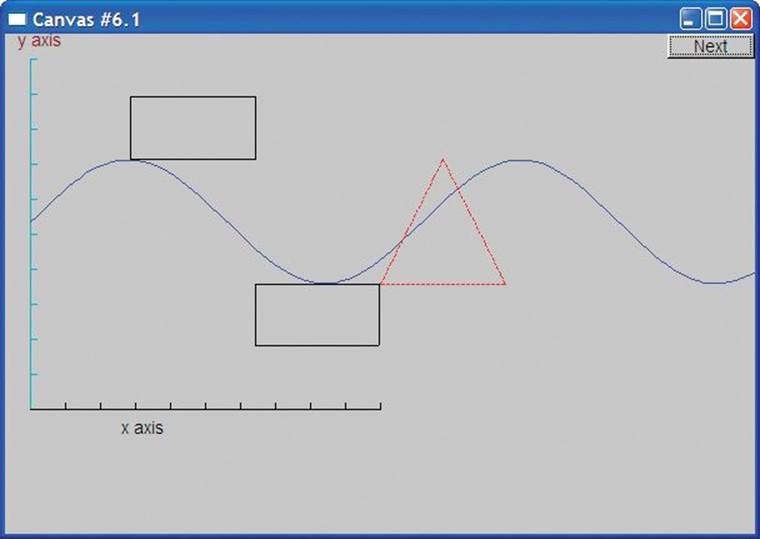
In fact, the image on the screen of such a poly_rect is a rectangle. However, the poly_rect object in memory is not a Rectangle and it does not “know” anything about rectangles. The simplest way to prove that is to add another point:
poly_rect.add(Point{50,75});
No rectangle has five points:
![]()
It is important for our reasoning about our code that a Rectangle doesn’t just happen to look like a rectangle on the screen; it maintains the fundamental guarantees of a rectangle (as we know them from geometry). We write code that depends on a Rectangle really being a rectangle on the screen and staying that way.
12.7.7 Fill
We have been drawing our shapes as outlines. We can also “fill” a rectangle with color:
r.set_fill_color(Color::yellow); // color the inside of the rectangle
poly.set_style(Line_style(Line_style::dash,4));
poly_rect.set_style(Line_style(Line_style::dash,2));
poly_rect.set_fill_color(Color::green);
win.set_label("Canvas #7");
win.wait_for_button();
We also decided that we didn’t like the line style of our triangle (poly), so we set its line style to “fat (thickness four times normal) dashed.” Similarly, we changed the style of poly_rect (now no longer looking like a rectangle):
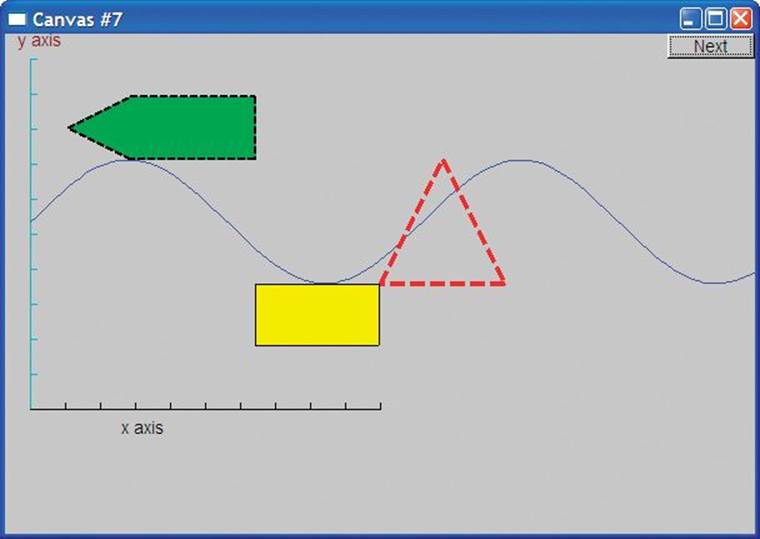
If you look carefully at poly_rect, you’ll see that the outline is printed on top of the fill.
It is possible to fill any closed shape (see §13.9). Rectangles are just special in how easy (and fast) they are to fill.
12.7.8 Text
![]()
Finally, no system for drawing is complete without a simple way of writing text — drawing each character as a set of lines just doesn’t cut it. We label the window itself, and axes can have labels, but we can also place text anywhere using a Text object:
Text t {Point{150,150}, "Hello, graphical world!"};
win.attach(t);
win.set_label("Canvas #8");
win.wait_for_button();
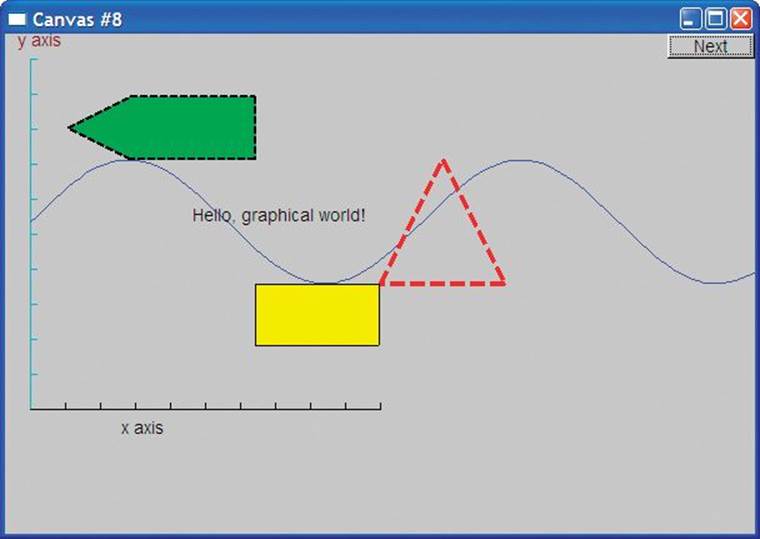
From the primitive graphics elements you see in this window, you can build displays of just about any complexity and subtlety. For now, just note a peculiarity of the code in this chapter: there are no loops, no selection statements, and all data was “hardwired” in. The output was just composed of primitives in the simplest possible way. Once we start composing these primitives using data and algorithms, things will start to get interesting.
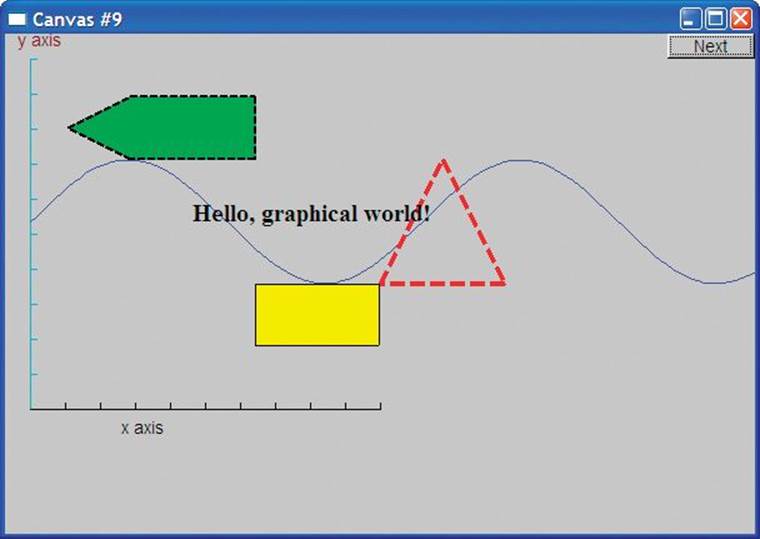
We have seen how we can control the color of text: the label of an Axis (§12.7.3) is simply a Text object. In addition, we can choose a font and set the size of the characters:
t.set_font(Font::times_bold);
t.set_font_size(20);
win.set_label("Canvas #9");
win.wait_for_button();
We enlarged the characters of the Text string Hello, graphical world! to point size 20 and chose the Times font in bold:
12.7.9 Images
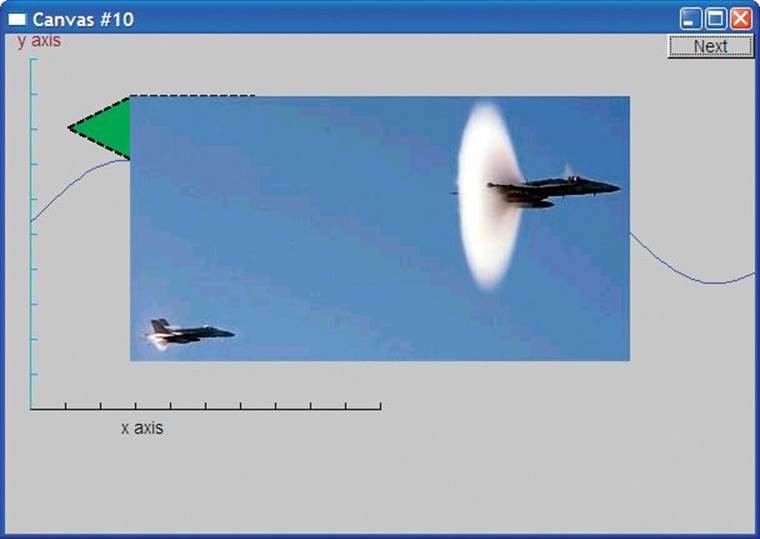
We can also load images from files:
Image ii {Point{100,50),"image.jpg"}; // 400*212-pixel jpg
win.attach(ii);
win.set_label("Canvas #10");
win.wait_for_button();
As it happens, the file called image.jpg is a photo of two planes breaking the sound barrier:
That photo is relatively large and we placed it right on top of our text and shapes. So, to clean up our window a bit, let us move it a bit out of the way:
ii.move(100,200);
win.set_label("Canvas #11");
win.wait_for_button();
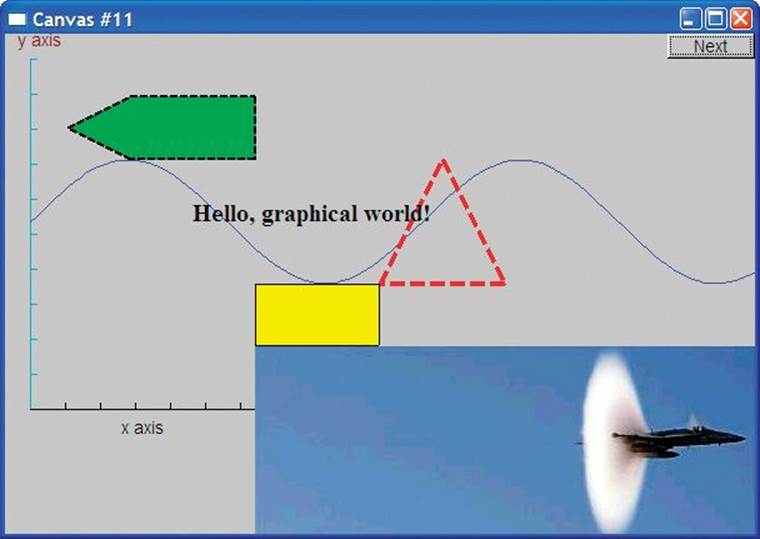
Note how the parts of the photo that didn’t fit in the window are simply not represented. What would have appeared outside the window is “clipped” away.
12.7.10 And much more
And here, without further comment, is some more code:
Circle c {Point{100,200},50};
Ellipse e {Point{100,200}, 75,25};
e.set_color(Color::dark_red);
Mark m {Point{100,200),'x'};
ostringstream oss;
oss << "screen size: " << x_max() << "*" << y_max()
<< "; window size: " << win.x_max() << "*" << win.y_max();
Text sizes {Point{100,20},oss.str()};
Image cal {Point{225,225},"snow_cpp.gif"}; // 320*240-pixel gif
cal.set_mask(Point{40,40},200,150); // display center part of image
win.attach(c);
win.attach(m);
win.attach(e);
win.attach(sizes);
win.attach(cal);
win.set_label("Canvas #12");
win.wait_for_button();
Can you guess what this code does? Is it obvious?
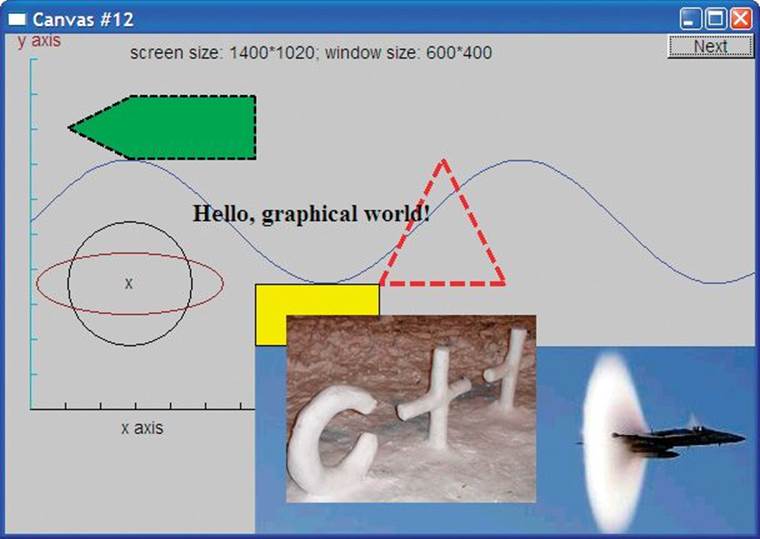
![]()
The connection between the code and what appears on the screen is direct. If you don’t yet see how that code caused that output, it soon will become clear. Note the way we used an ostringstream (§11.4) to format the text object displaying sizes.
12.8 Getting this to run
We have seen how to make a window and how to draw various shapes in it. In the following chapters, we’ll see how those Shape classes are defined and show more ways of using them.
Getting this program to run requires more than the programs we have presented so far. In addition to our code in main(), we need to get the interface library code compiled and linked to our code, and finally, nothing will run unless the FLTK library (or whatever GUI system we use) is installed and correctly linked to ours.
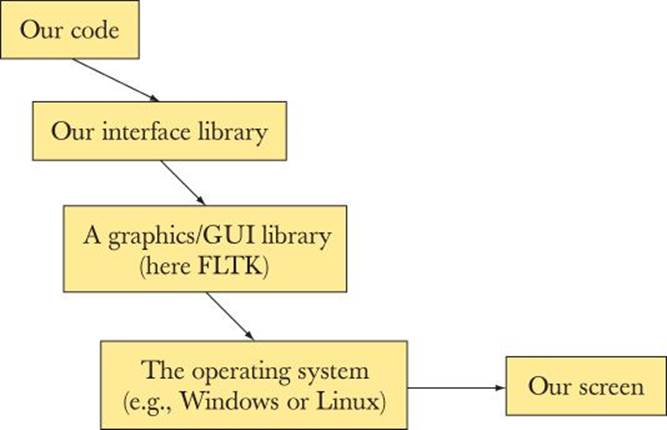
One way of looking at the program is that it has four distinct parts:
• Our program code (main(), etc.)
• Our interface library (Window, Shape, Polygon, etc.)
• The FLTK library
• The C++ standard library
Indirectly, we also use the operating system. Leaving out the OS and the standard library, we can illustrate the organization of our graphics code like this:
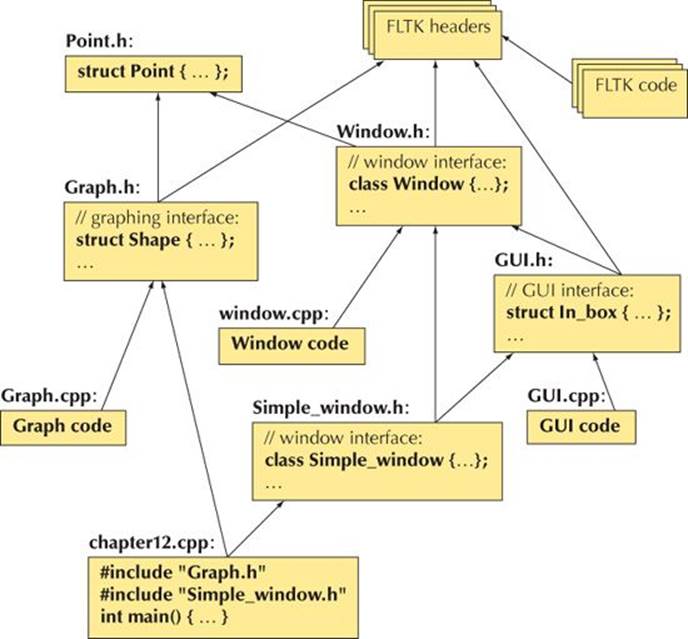
Appendix D explains how to get all of this to work together.
12.8.1 Source files
Our graphics and GUI interface library consists of just five header files and three code files:
• Headers:
• Point.h
• Window.h
• Simple_window.h
• Graph.h
• GUI.h
• Code files:
• Window.cpp
• Graph.cpp
• GUI.cpp
Until Chapter 16, you can ignore the GUI files.
 Drill
Drill
The drill is the graphical equivalent to the “Hello, World!” program. Its purpose is to get you acquainted with the simplest graphical output tools.
1. Get an empty Simple_window with the size 600 by 400 and a label My window compiled, linked, and run. Note that you have to link the FLTK library as described in Appendix D; #include Graph.h and Simple_window.h in your code; and include Graph.cpp and Window.cpp in your project.
2. Now add the examples from §12.7 one by one, testing between each added subsection example.
3. Go through and make one minor change (e.g., in color, in location, or in number of points) to each of the subsection examples.
Review
1. Why do we use graphics?
2. When do we try not to use graphics?
3. Why is graphics interesting for a programmer?
4. What is a window?
5. In which namespace do we keep our graphics interface classes (our graphics library)?
6. What header files do you need to do basic graphics using our graphics library?
7. What is the simplest window to use?
8. What is the minimal window?
9. What’s a window label?
10. How do you label a window?
11. How do screen coordinates work? Window coordinates? Mathematical coordinates?
12. What are examples of simple “shapes” that we can display?
13. What command attaches a shape to a window?
14. Which basic shape would you use to draw a hexagon?
15. How do you write text somewhere in a window?
16. How would you put a photo of your best friend in a window (using a program you wrote yourself)?
17. You made a Window object, but nothing appears on your screen. What are some possible reasons for that?
18. You have made a shape, but it doesn’t appear in the window. What are some possible reasons for that?
Terms
color
coordinates
display
fill color
FLTK
graphics
GUI
GUI library
HTML
image
JPEG
line style
software layer
window
XML
Exercises
We recommend that you use Simple_window for these exercises.
1. Draw a rectangle as a Rectangle and as a Polygon. Make the lines of the Polygon red and the lines of the Rectangle blue.
2. Draw a 100-by-30 Rectangle and place the text “Howdy!” inside it.
3. Draw your initials 150 pixels high. Use a thick line. Draw each initial in a different color.
4. Draw a 3-by-3 tic-tac-toe board of alternating white and red squares.
5. Draw a red ¼-inch frame around a rectangle that is three-quarters the height of your screen and two-thirds the width.
6. What happens when you draw a Shape that doesn’t fit inside its window? What happens when you draw a Window that doesn’t fit on your screen? Write two programs that illustrate these two phenomena.
7. Draw a two-dimensional house seen from the front, the way a child would: with a door, two windows, and a roof with a chimney. Feel free to add details; maybe have “smoke” come out of the chimney.
8. Draw the Olympic five rings. If you can’t remember the colors, look them up.
9. Display an image on the screen, e.g., a photo of a friend. Label the image both with a title on the window and with a caption in the window.
10. Draw the file diagram from §12.8.
11. Draw a series of regular polygons, one inside the other. The innermost should be an equilateral triangle, enclosed by a square, enclosed by a pentagon, etc. For the mathematically adept only: let all the points of each N-polygon touch sides of the (N+1)-polygon. Hint: The trigonometric functions are found in <cmath> (§24.8, §B.9.2).
12. A superellipse is a two-dimensional shape defined by the equation
![]()
Look up superellipse on the web to get a better idea of what such shapes look like. Write a program that draws “starlike” patterns by connecting points on a superellipse. Take a, b, m, n, and N as arguments. Select N points on the superellipse defined by a, b, m, and n. Make the points equally spaced for some definition of “equal.” Connect each of those N points to one or more other points (if you like you can make the number of points to which to connect a point another argument or just use N-1, i.e., all the other points).
13. Find a way to add color to the lines from the previous exercise. Make some lines one color and other lines another color or other colors.
Postscript
![]()
The ideal for program design is to have our concepts directly represented as entities in our program. So, we often represent ideas by classes, real-world entities by objects of classes, and actions and computations by functions. Graphics is a domain where this idea has an obvious application. We have concepts, such as circles and polygons, and we represent them in our program as class Circle and class Polygon. Where graphics is unusual is that when writing a graphics program, we also have the opportunity to see objects of those classes on the screen; that is, the state of our program is directly represented for us to observe — in most applications we are not that lucky. This direct correspondence between ideas, code, and output is what makes graphics programming so attractive. Please do remember, though, that graphics are just illustrations of the general idea of using classes to directly represent concepts in code. That idea is far more general and useful: just about anything we can think of can be represented in code as a class, an object of a class, or a set of classes.