Programming: Principles and Practice Using C++ (2014)
Part II: Input and Output
13. Graphics Classes
“A language that doesn’t
change the way you think
isn’t worth learning.”
—Traditional
Chapter 12 gave an idea of what we could do in terms of graphics using a set of simple interface classes, and how we can do it. This chapter presents many of the classes offered. The focus here is on the design, use, and implementation of individual interface classes such as Point, Color,Polygon, and Open_polyline and their uses. The following chapter will present ideas for designing sets of related classes and will also present more implementation techniques.
13.1 Overview of graphics classes
13.2 Point and Line
13.3 Lines
13.4 Color
13.5 Line_style
13.6 Open_polyline
13.7 Closed_polyline
13.8 Polygon
13.9 Rectangle
13.10 Managing unnamed objects
13.11 Text
13.12 Circle
13.13 Ellipse
13.14 Marked_polyline
13.15 Marks
13.16 Mark
13.17 Images
13.1 Overview of graphics classes
Graphics and GUI libraries provide lots of facilities. By “lots” we mean hundreds of classes, often with dozens of functions applying to each. Reading a description, manual, or documentation is a bit like looking at an old-fashioned botany textbook listing details of thousands of plants organized according to obscure classifying traits. It is daunting! It can also be exciting — looking at the facilities of a modern graphics/GUI library can make you feel like a child in a candy store, but it can be hard to figure out where to start and what is really good for you.
One purpose of our interface library is to reduce the shock delivered by the complexity of a full-blown graphics/GUI library. We present just two dozen classes with hardly any operations. Yet they allow you to produce useful graphical output. A closely related goal is to introduce key graphics and GUI concepts through those classes. Already, you can write programs displaying results as simple graphics. After this chapter, your range of graphics programs will have increased to exceed most people’s initial requirements. After Chapter 14, you’ll understand most of the design techniques and ideas involved so that you can deepen your understanding and extend your range of graphical expression as needed. You can do so either by adding to the facilities described here or by adopting another C++ graphics/GUI library.
The key interface classes are:
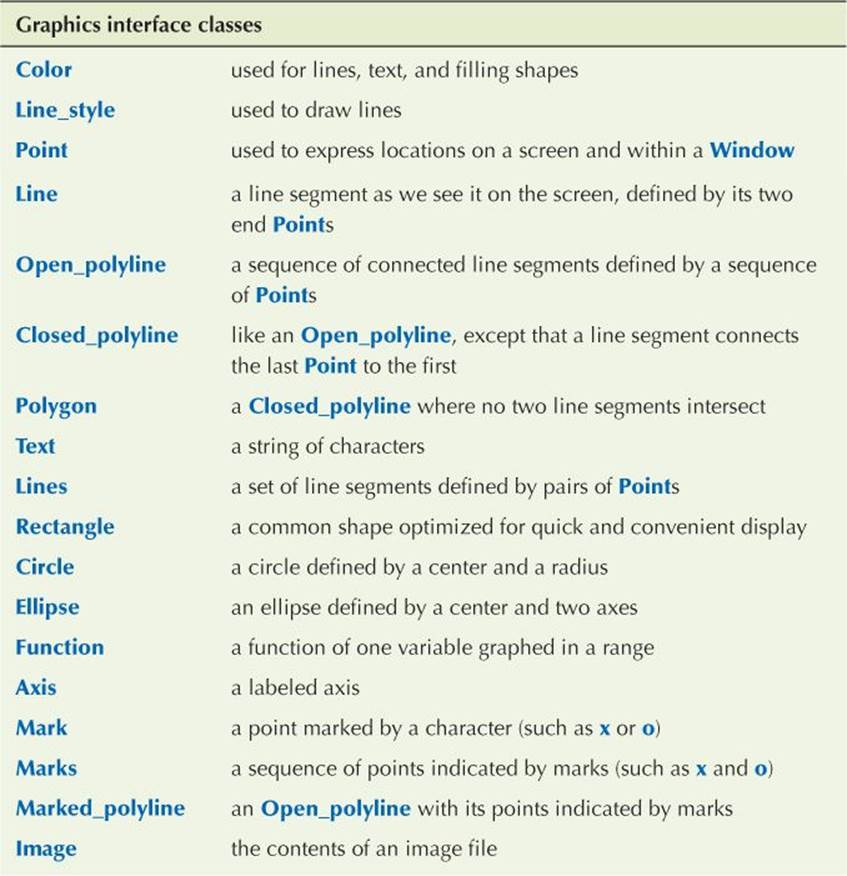
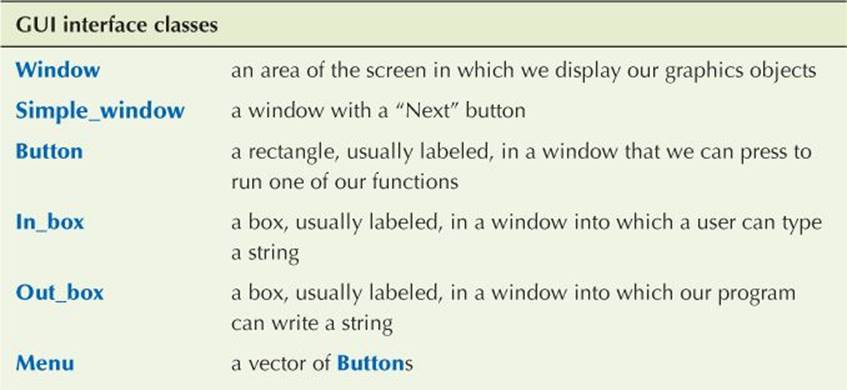
Chapter 15 examines Function and Axis. Chapter 16 presents the main GUI interface classes:
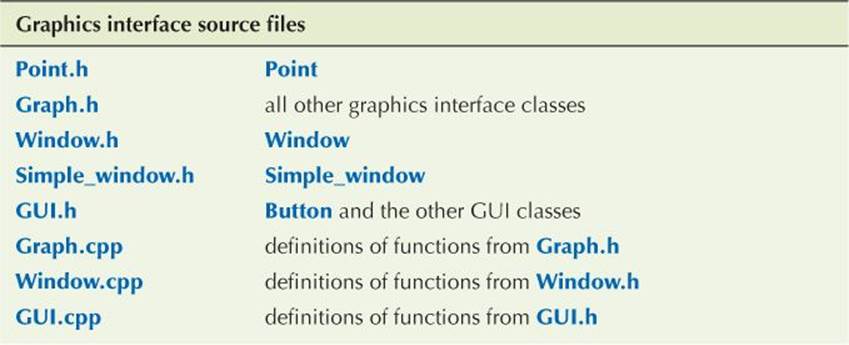
The source code is organized into files like this:
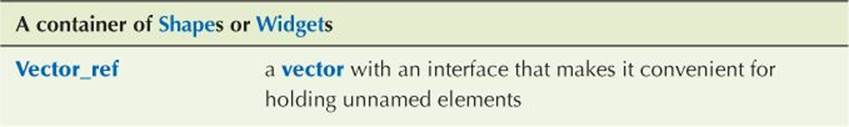
In addition to the graphics classes, we present a class that happens to be useful for holding collections for Shapes or Widgets:
When you read the following sections, please don’t move too fast. There is little that isn’t pretty obvious, but the purpose of this chapter isn’t just to show you some pretty pictures — you see prettier pictures on your computer screen or television every day. The main points of this chapter are
• To show the correspondence between code and the pictures produced.
• To get you used to reading code and thinking about how it works.
• To get you to think about the design of code — in particular to think about how to represent concepts as classes in code. Why do those classes look the way they do? How else could they have looked? We made many, many design decisions, most of which could reasonably have been made differently, in some cases radically differently.
So please don’t rush. If you do, you’ll miss something important and you might then find the exercises unnecessarily hard.
13.2 Point and Line
The most basic part of any graphics system is the point. To define point is to define how we organize our geometric space. Here, we use a conventional, computer-oriented layout of two-dimensional points defined by (x,y) integer coordinates. As described in §12.5, x coordinates go from 0(representing the left-hand side of the screen) to x_max() (representing the right-hand side of the screen); y coordinates go from 0 (representing the top of the screen) to y_max() (representing the bottom of the screen).
As defined in Point.h, Point is simply a pair of ints (the coordinates):
struct Point {
int x, y;
};
bool operator==(Point a, Point b) { return a.x==b.x && a.y==b.y; }
bool operator!=(Point a, Point b) { return !(a==b); }
In Graph.h, we find Shape, which we describe in detail in Chapter 14, and Line:
struct Line : Shape { // a Line is a Shape defined by two Points
Line(Point p1, Point p2); // construct a Line from two Points
};
A Line is a kind of Shape. That’s what : Shape means. Shape is called a base class for Line or simply a base of Line. Basically, Shape provides the facilities needed to make the definition of Line simple. Once we have a feel for the particular shapes, such as Line and Open_polyline, we’ll explain what that implies (Chapter 14).
A Line is defined by two Points. Leaving out the “scaffolding” (#includes, etc. as described in §12.3), we can create lines and cause them to be drawn like this:
// draw two lines
constexpr Point x {100,100};
Simple_window win1 {x,600,400,"two lines"};
Line horizontal {x,Point{200,100}}; // make a horizontal line
Line vertical {Point{150,50},Point{150,150}}; // make a vertical line
win1.attach(horizontal); // attach the lines to the window
win1.attach(vertical);
win1.wait_for_button(); // display!
Executing that, we get
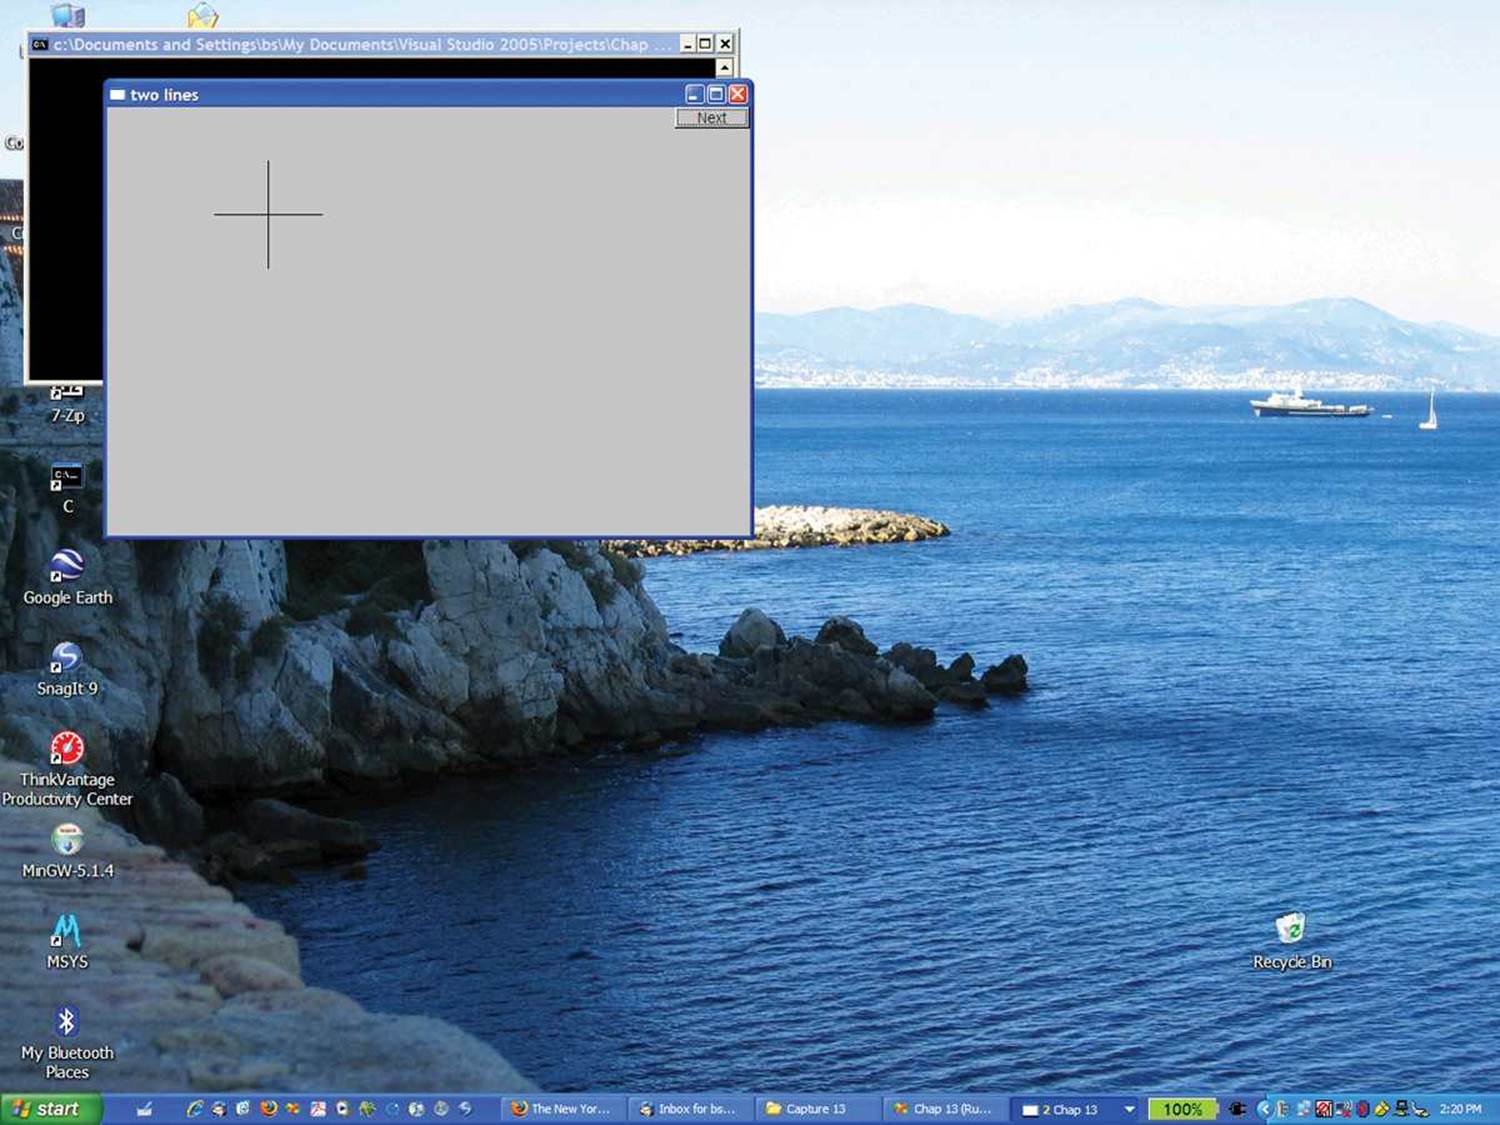
As a user interface designed for simplicity, Line works quite well. You don’t need to be Einstein to guess that
Line vertical {Point{150,50},Point{150,150}};
creates a (vertical) line from (150,50) to (150,150). There are, of course, implementation details, but you don’t have to know those to make Lines. The implementation of Line’s constructor is correspondingly simple:
Line::Line(Point p1, Point p2) // construct a line from two points
{
add(p1); // add p1 to this shape
add(p2); // add p2 to this shape
}
That is, it simply “adds” two points. Adds to what? And how does a Line get drawn in a window? The answer lies in the Shape class. As we’ll describe in Chapter 14, Shape can hold points defining lines, knows how to draw lines defined by pairs of Points, and provides a function add() that allows an object to add a Point to its Shape. The key point (sic!) here is that defining Line is trivial. Most of the implementation work is done by “the system” so that we can concentrate on writing simple classes that are easy to use.
From now on we’ll leave out the definition of the Simple_window and the calls of attach(). Those are just more “scaffolding” that we need for a complete program but that adds little to the discussion of specific Shapes.
13.3 Lines
As it turns out, we rarely draw just one line. We tend to think in terms of objects consisting of many lines, such as triangles, polygons, paths, mazes, grids, bar graphs, mathematical functions, graphs of data, etc. One of the simplest such “composite graphical object classes” is Lines:
struct Lines : Shape { // related lines
Lines() {} // empty
Lines(initializer_list<Point> lst); // initialize from a list of Points
void draw_lines() const;
void add(Point p1, Point p2); // add a line defined by two points
};
A Lines object is simply a collection of lines, each defined by a pair of Points. For example, had we considered the two lines from the Line example in §13.2 as part of a single graphical object, we could have defined them like this:
Lines x;
x.add(Point{100,100}, Point{200,100}); // first line: horizontal
x.add(Point{150,50}, Point{150,150}); // second line: vertical
This gives output that is indistinguishable (to the last pixel) from the Line version:
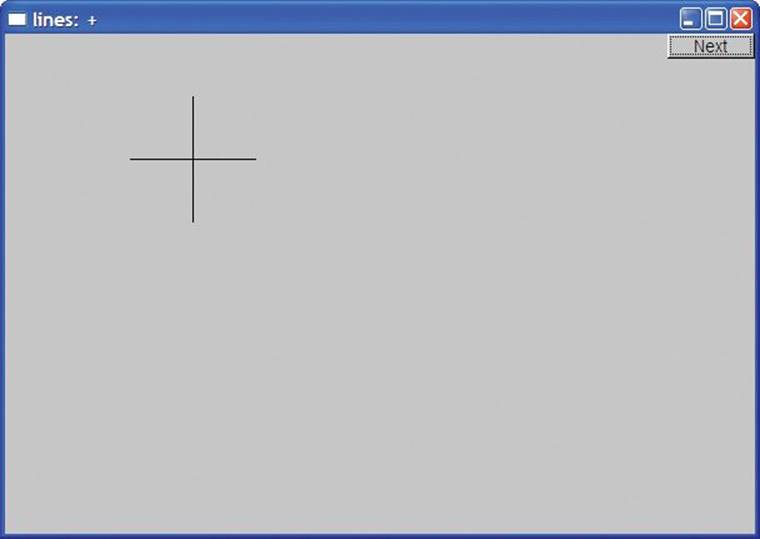
The only way we can tell that this is a different window is that we labeled them differently.
![]()
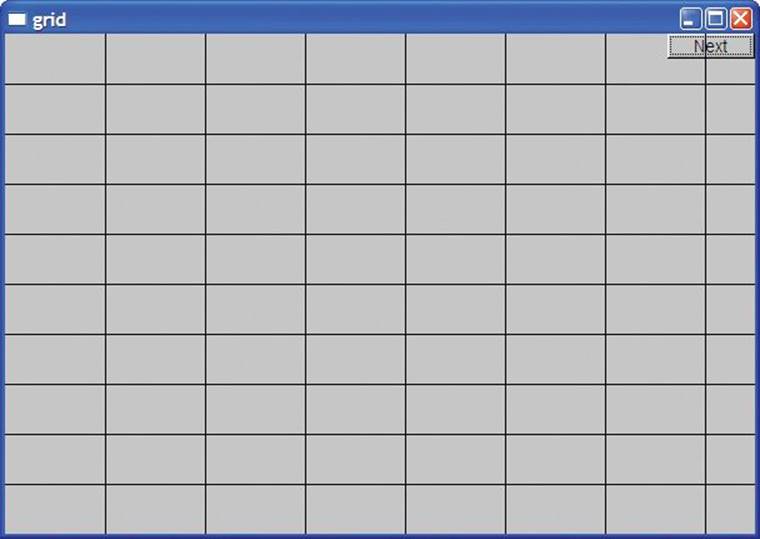
The difference between a set of Line objects and a set of lines in a Lines object is completely one of our view of what’s going on. By using Lines, we have expressed our opinion that the two lines belong together and should be manipulated together. For example, we can change the color of all lines that are part of a Lines object with a single command. On the other hand, we can give lines that are individual Line objects different colors. As a more realistic example, consider how to define a grid. A grid consists of a number of evenly spaced horizontal and vertical lines. However, we think of a grid as one “thing,” so we define those lines as part of a Lines object, which we call grid:
int x_size = win3.x_max(); // get the size of our window
int y_size = win3.y_max();
int x_grid = 80;
int y_grid = 40;
Lines grid;
for (int x=x_grid; x<x_size; x+=x_grid)
grid.add(Point{x,0},Point{x,y_size}); // vertical line
for (int y = y_grid; y<y_size; y+=y_grid)
grid.add(Point{0,y},Point{x_size,y}); // horizontal line
Note how we get the dimension of our window using x_max() and y_max(). This is also the first example where we are writing code that computes which objects we want to display. It would have been unbearably tedious to define this grid by defining one named variable for each grid line. From that code, we get
Let’s return to the design of Lines. How are the member functions of class Lines implemented? Lines provides just two constructors and two operations.
The add() function simply adds a line defined by a pair of points to the set of lines to be displayed:
void Lines::add(Point p1, Point p2)
{
Shape::add(p1);
Shape::add(p2);
}
Yes, the Shape:: qualification is needed because otherwise the compiler would see add(p1) as an (illegal) attempt to call Lines’ add() rather than Shape’s add().
The draw_lines() function draws the lines defined using add():
void Lines::draw_lines() const
{
if (color().visibility())
for (int i=1; i<number_of_points(); i+=2)
fl_line(point(i-1).x,point(i-1).y,point(i).x,point(i).y);
}
That is, Lines::draw_lines() takes two points at a time (starting with points 0 and 1) and draws the line between them using the underlying library’s line-drawing function (fl_line()). Visibility is a property of the Lines’ Color object (§13.4), so we have to check that the lines are meant to bevisible before drawing them.
As we explain in Chapter 14, draw_lines() is called by “the system.” We don’t need to check that the number of points is even — Lines’ add() can add only pairs of points. The functions number_of_points() and point() are defined in class Shape (§14.2) and have their obvious meaning. These two functions provide read-only access to a Shape’s points. The member function draw_lines() is defined to be const (see §9.7.4) because it doesn’t modify the shape.
![]()
The default constructor for Lines simply creates an empty object (containing no lines): the model of starting out with no points and then add()ing points as needed is more flexible than any constructor could be. However, we also added a constructor taking an initializer_list of pairs ofPoints, each defining a line. Given that initializer-list constructor (§18.2), we can simply define Lines starting out with 0, 1, 2, , 3, . . . lines. For example, the first Lines example could be written like this:
Lines x = {
{Point{100,100}, Point{200,100}}, // first line: horizontal
{Point{150,50}, Point{150,150}} // second line: vertical
};
or even like this:
Lines x = {
{{100,100}, {200,100}}, // first line: horizontal
{{150,50}, {150,150}} // second line: vertical
};
The initializer-list constructor is easily defined:
void Lines::Lines(initializer_list<pair<Point,Point>> lst)
{
for (auto p : lst) add(p.first,p.second);
}
The auto is a placeholder for the type pair<Point,Point>, and first and second are the names of a pair’s first and second members. The types initializer_list and pair are defined in the standard library (§B.6.4, §B.6.3).
13.4 Color
Color is the type we use to represent color. We can use Color like this:
grid.set_color(Color::red);
This colors the lines defined in grid red so that we get
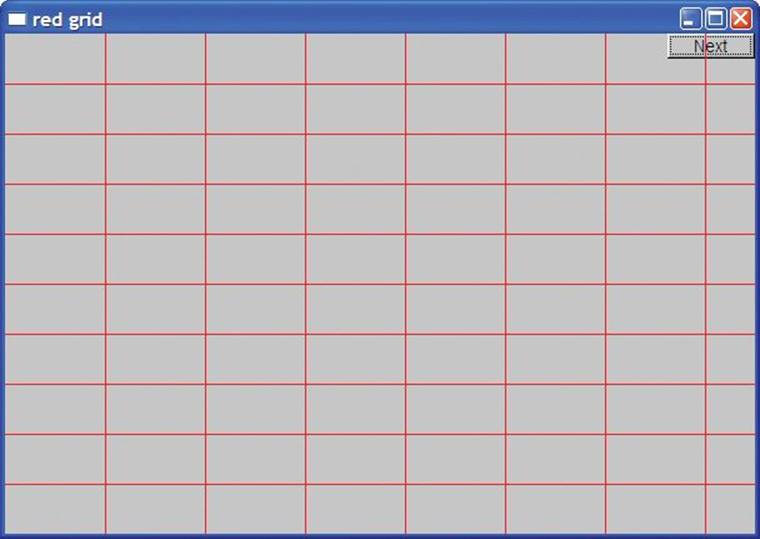
Color defines the notion of a color and gives symbolic names to a few of the more common colors:
struct Color {
enum Color_type {
red=FL_RED,
blue=FL_BLUE,
green=FL_GREEN,
yellow=FL_YELLOW,
white=FL_WHITE,
black=FL_BLACK,
magenta=FL_MAGENTA,
cyan=FL_CYAN,
dark_red=FL_DARK_RED,
dark_green=FL_DARK_GREEN,
dark_yellow=FL_DARK_YELLOW,
dark_blue=FL_DARK_BLUE,
dark_magenta=FL_DARK_MAGENTA,
dark_cyan=FL_DARK_CYAN
};
enum Transparency { invisible = 0, visible=255 };
Color(Color_type cc) :c{Fl_Color(cc)}, v{visible} { }
Color(Color_type cc, Transparency vv) :c{Fl_Color(cc)}, v{vv} { }
Color(int cc) :c{Fl_Color(cc)}, v{visible} { }
Color(Transparency vv) :c{Fl_Color()}, v{vv} { } // default color
int as_int() const { return c; }
char visibility() const { return v; }
void set_visibility(Transparency vv) { v=vv; }
private:
char v; // invisible and visible for now
Fl_Color c;
};
The purpose of Color is
• To hide the implementation’s notion of color, FLTK’s Fl_Color type
• To map between Fl_Color and Color_type values
• To give the color constants a scope
• To provide a simple version of transparency (visible and invisible)
You can pick colors
• From the list of named colors, for example, Color::dark_blue.
• By picking from a small “palette” of colors that most screens display well by specifying a value in the range 0-255; for example, Color(99) is a dark green. For a code example, see §13.9.
• By picking a value in the RGB (red, green, blue) system, which we will not explain here. Look it up if you need it. In particular, a search for “RGB color” on the web gives many sources, such as http://en.wikipedia.org/wiki/RGB_color_model andwww.rapidtables.com/web/color/RGB_Color.htm. See also exercises 13 and 14.
![]()
Note the use of constructors to allow Colors to be created either from the Color_type or from a plain int. The member c is initialized by each constructor. You could argue that c is too short and too obscure a name to use, but since it is used only within the small scope of Color and not intended for general use, that’s probably OK. We made the member c private to protect it from direct use from our users. For our representation of the data member c we use the FLTK type Fl_Color that we don’t really want to expose to our users. However, looking at a color as an int representing its RGB (or other) value is very common, so we supplied as_int() for that. Note that as_int() is a const member because it doesn’t actually change the Color object that it is used for.
The transparency is represented by the member v which can hold the values Color::visible and Color::invisible, with their obvious meaning. It may surprise you that an “invisible color” can be useful, but it can be most useful to have part of a composite shape invisible.
13.5 Line_style
When we draw several lines in a window, we can distinguish them by color, by style, or by both. A line style is the pattern used to outline the line. We can use Line_style like this:
grid.set_style(Line_style::dot);
This displays the lines in grid as a sequence of dots rather than a solid line:
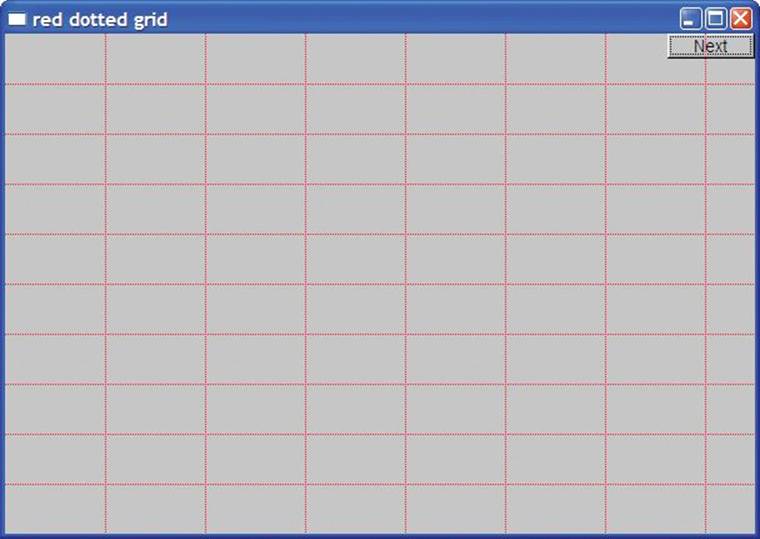
That “thinned out” the grid a bit, making it more discreet. By adjusting the width (thickness), we can adjust the grid lines to suit our taste and needs.
The Line_style type looks like this:
struct Line_style {
enum Line_style_type {
solid=FL_SOLID, // -------
dash=FL_DASH, // - - - -
dot=FL_DOT, // .......
dashdot=FL_DASHDOT, // - . - .
dashdotdot=FL_DASHDOTDOT, // -..-..
};
Line_style(Line_style_type ss) :s{ss}, w{0} { }
Line_style(Line_style_type lst, int ww) :s{lst}, w{ww} { }
Line_style(int ss) :s{ss}, w{0} { }
int width() const { return w; }
int style() const { return s; }
private:
int s;
int w;
};
The programming techniques for defining Line_style are exactly the same as the ones we used for Color. Here, we hide the fact that FLTK uses plain ints to represent line styles. Why is something like that worth hiding? Because it is exactly such a detail that might change as a library evolves. The next FLTK release might very well have a Fl_linestyle type, or we might retarget our interface classes to some other GUI library. In either case, we wouldn’t like to have our code and our users’ code littered with plain ints that we just happened to know represent line styles.
![]()
Most of the time, we don’t worry about style at all; we just rely on the default (default width and solid lines). This default line width is defined by the constructors in the cases where we don’t specify one explicitly. Setting defaults is one of the things that constructors are good for, and good defaults can significantly help users of a class.
Note that Line_style has two “components”: the style proper (e.g., use dashed or solid lines) and width (the thickness of the line used). The width is measured in integers. The default width is 1. We can request a fat dashed line like this:
grid.set_style(Line_style{Line_style::dash,2});
This produces

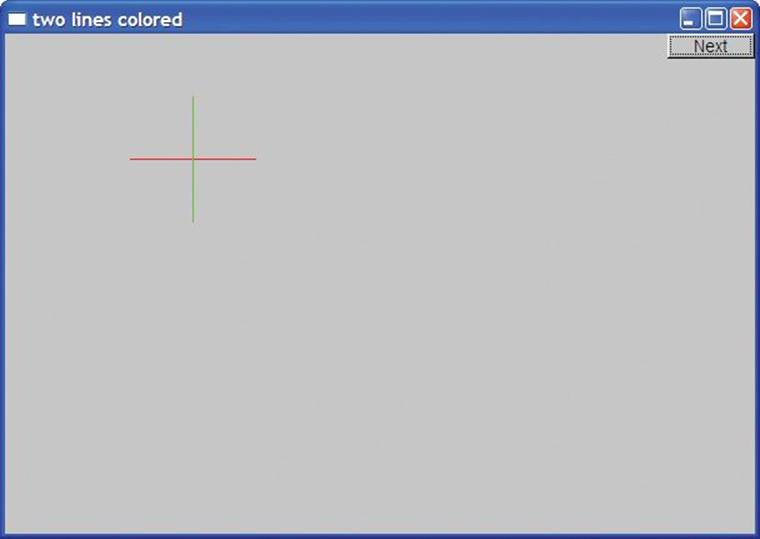
Note that color and style apply to all lines of a shape. That is one of the advantages of grouping many lines into a single graphics object, such as a Lines, Open_polyline, or Polygon. If we want to control the color or style for lines separately, we must define them as separate Lines. For example:
horizontal.set_color(Color::red);
vertical.set_color(Color::green);
This gives us
13.6 Open_polyline
An Open_polyline is a shape that is composed of a series of connected line segments defined by a series of points. Poly is the Greek word for “many,” and polyline is a fairly conventional name for a shape composed of many lines. For example:
Open_polyline opl = {
{100,100}, {150,200}, {250,250}, {300,200}
};
This draws the shape that you get by connecting the four points:
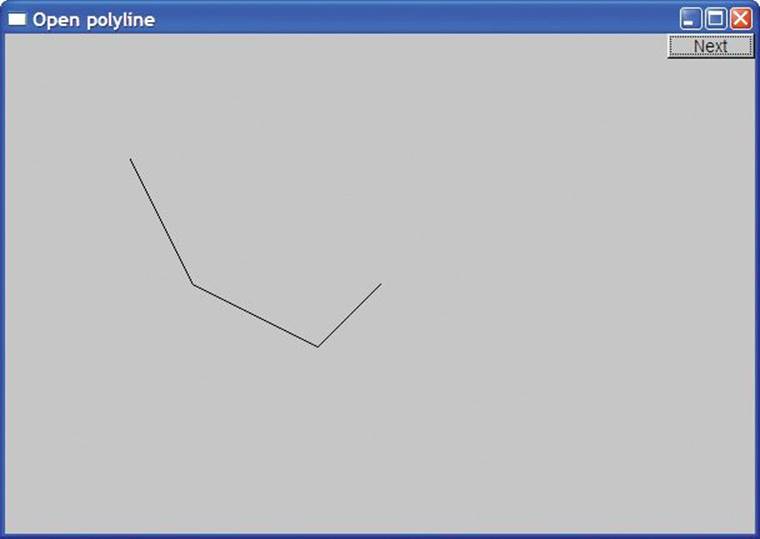
Basically, an Open_polyline is a fancy word for what we encountered in kindergarten playing “Connect the Dots.”
Class Open_polyline is defined like this:
struct Open_polyline : Shape { // open sequence of lines
using Shape::Shape; // use Shape’s constructors (§A.16)
void add(Point p) { Shape::add(p); }
};
Open_polyline inherits from Shape. Open_polyline’s add() function is there to allow the users of an Open_polyline to access the add() from Shape (that is, Shape::add()). We don’t even need to define a draw_lines() because Shape by default interprets the Points add()ed as a sequence of connected lines.
The declaration using Shape::Shape is a using declaration. It says that an Open_polyline can use the constructors defined for Shape. Shape has a default constructor (§9.7.3) and an initializer-list constructor (§18.2), so the using declaration is simply a shorthand for defining those two constructors for Open_polyline. As for Lines, the initializer-list constructor is there as a shorthand for an initial sequence of add()s.
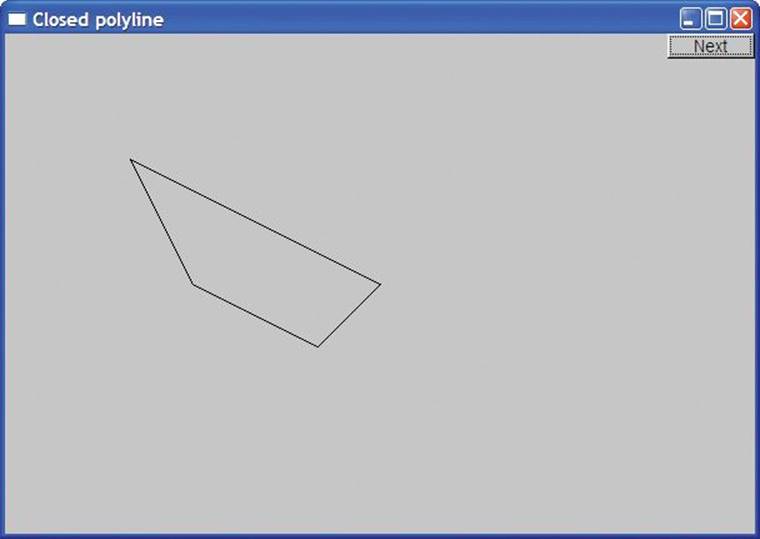
13.7 Closed_polyline
A Closed_polyline is just like an Open_polyline, except that we also draw a line from the last point to the first. For example, we could use the same points we used for the Open_polyline in §13.6 for a Closed_polyline:
Closed_polyline cpl = {
{100,100}, {150,200}, {250,250}, {300,200}
};
The result is (of course) identical to that of §13.6 except for that final closing line:
The definition of Closed_polyline is
struct Closed_polyline : Open_polyline { // closed sequence of lines
using Open_polyline::Open_polyline; // use Open_polyline’s
// constructors (§A.16)
void draw_lines() const;
};
void Closed_polyline::draw_lines() const
{
Open_polyline::draw_lines(); // first draw the “open polyline part”
// then draw closing line:
if (2<number_of_points() && color().visibility())
fl_line(point(number_of_points()-1).x,
point(number_of_points()-1).y,
point(0).x,
point(0).y);
}
The using declaration (§A.16) says that Closed_polyline has the same constructors as Open_polyline. Closed_polyline needs its own draw_lines() to draw that closing line connecting the last point to the first.
We only have to do the little detail where Closed_polyline differs from what Open_polyline offers. That’s important and is sometimes called “programming by difference.” We need to program only what’s different about our derived class (here, Closed_polyline) compared to what a base class (here, Open_polyline) offers.
So how do we draw that closing line? We use the FLTK line-drawing function fl_line(). It takes four ints representing two points. So, here the underlying graphics library is again used. Note, however, that — as in every other case — the mention of FLTK is kept within the implementation of our class rather than being exposed to our users. No user code needs to mention fl_line() or to know about interfaces where points appear implicitly as integer pairs. If we wanted to, we could replace FLTK with another GUI library with very little impact on our users’ code.
13.8 Polygon
A Polygon is very similar to a Closed_polyline. The only difference is that for Polygons we don’t allow lines to cross. For example, the Closed_polyline above is a polygon, but we can add another point:
cpl.add(Point{100,250});
The result is
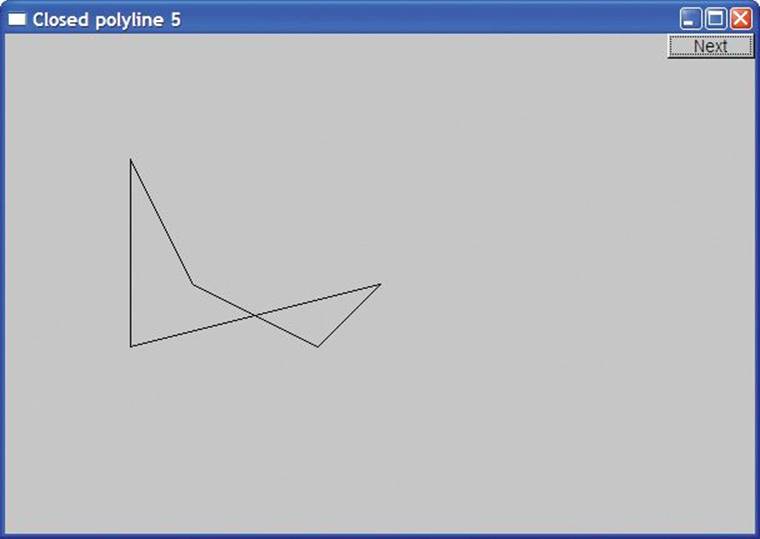
According to classical definitions, this Closed_polyline is not a polygon. How do we define Polygon so that we correctly capture the relationship to Closed_polyline without violating the rules of geometry? The presentation above contains a strong hint. A Polygon is a Closed_polyline where lines do not cross. Alternatively, we could emphasize the way a shape is built out of points and say that a Polygon is a Closed_polyline where we cannot add a Point that defines a line segment that intersects one of the existing lines of the Polygon.
Given that idea, we define Polygon like this:
struct Polygon : Closed_polyline { // closed sequence of nonintersecting
// lines
using Closed_polyline::Closed_polyline; // use Closed_polyline’s
// constructors
void add(Point p);
void draw_lines() const;
};
void Polygon::add(Point p)
{
// check that the new line doesn’t intersect existing lines (code not shown)
Closed_polyline::add(p);
}
Here we inherit Closed_polyline’s definition of draw_lines(), thus saving a fair bit of work and avoiding duplication of code. Unfortunately, we have to check each add(). That yields an inefficient (order N-squared) algorithm — defining a Polygon with N points requires N*(N-1)/2 calls ofintersect(). In effect, we have made the assumption that the Polygon class will be used for polygons of a low number of points. For example, creating a Polygon with 24 Points involves 24*(24-1)/2 == 276 calls of intersect(). That’s probably acceptable, but if we wanted a polygon with 2000 points it would cost us about 2,000,000 calls, and we might look for a better algorithm, which might require a modified interface.
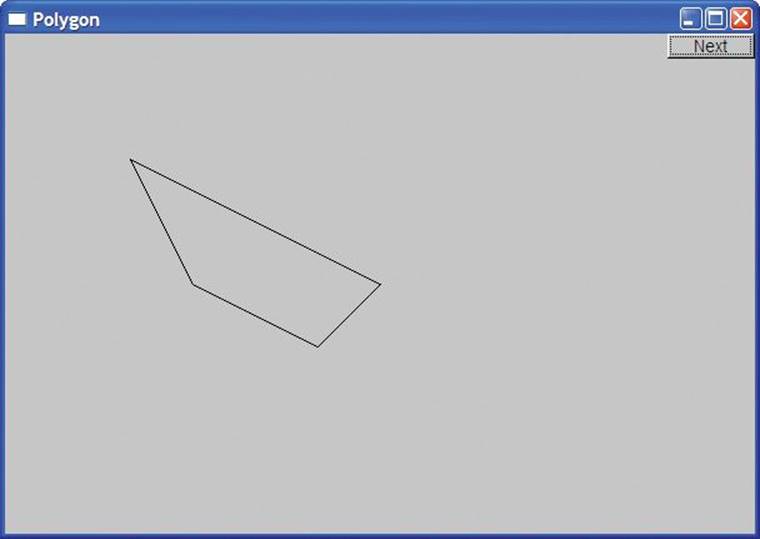
Using the initializer-list constructor, we can create a polygon like this:
Polygon poly = {
{100,100}, {150,200}, {250,250}, {300,200}
};
Obviously, this creates a Polygon that (to the last pixel) is identical to our original Closed_polyline:
Ensuring that a Polygon really represents a polygon turned out to be surprisingly messy. The check for intersection that we left out of Polygon::add() is arguably the most complicated in the whole graphics library. If you are interested in fiddly coordinate manipulation of geometry, have a look at the code.
![]()
The trouble is that Polygon’s invariant “the points represent a polygon” can’t be verified until all points have been defined; that is, we are not — as strongly recommended — establishing Polygon’s invariant in its constructor. We considered removing add() and requiring that a Polygon be completely specified by an initializer list with at least three points, but that would have complicated uses where a program generated a sequence of points.
13.9 Rectangle
The most common shape on a screen is a rectangle. The reasons for that are partly cultural (most of our doors, windows, pictures, walls, bookcases, pages, etc. are also rectangular) and partly technical (keeping a coordinate within rectangular space is simpler than for any other shaped space). Anyway, rectangles are so common that GUI systems support them directly rather than treating them simply as polygons that happen to have four corners and right angles.
struct Rectangle : Shape {
Rectangle(Point xy, int ww, int hh);
Rectangle(Point x, Point y);
void draw_lines() const;
int height() const { return h; }
int width() const { return w; }
private:
int h; // height
int w; // width
};
We can specify a rectangle by two points (top left and bottom right) or by one point (top left) and a width and a height. The constructors can be defined like this:
Rectangle::Rectangle(Point xy, int ww, int hh)
: w{ww}, h{hh}
{
if (h<=0 || w<=0)
error("Bad rectangle: non-positive side");
add(xy);
}
Rectangle::Rectangle(Point x, Point y)
:w{y.x-x.x}, h{y.y-x.y}
{
if (h<=0 || w<=0)
error("Bad rectangle: first point is not top left");
add(x);
}
Each constructor initializes the members h and w appropriately (using the member initialization syntax; see §9.4.4) and stores away the top left corner point in the Rectangle’s base Shape (using add()). In addition, it does a simple sanity check: we don’t really want Rectangles with negative width or height.
![]()
One of the reasons that some graphics/GUI systems treat rectangles as special is that the algorithm for determining which pixels are inside a rectangle is far simpler — and therefore far faster — than for other shapes, such as Polygons and Circles. Consequently, the notion of “fill color” — that is, the color of the space inside the rectangle — is more commonly used for rectangles than for other shapes. We can set the fill color in a constructor or by the operation set_fill_color() (provided by Shape together with the other services related to color):
Rectangle rect00 {Point{150,100},200,100};
Rectangle rect11 {Point{50,50},Point{250,150}};
Rectangle rect12 {Point{50,150},Point{250,250}}; // just below rect11
Rectangle rect21 {Point{250,50},200,100}; // just to the right of rect11
Rectangle rect22 {Point{250,150},200,100}; // just below rect21
rect00.set_fill_color(Color::yellow);
rect11.set_fill_color(Color::blue);
rect12.set_fill_color(Color::red);
rect21.set_fill_color(Color::green);
This produces
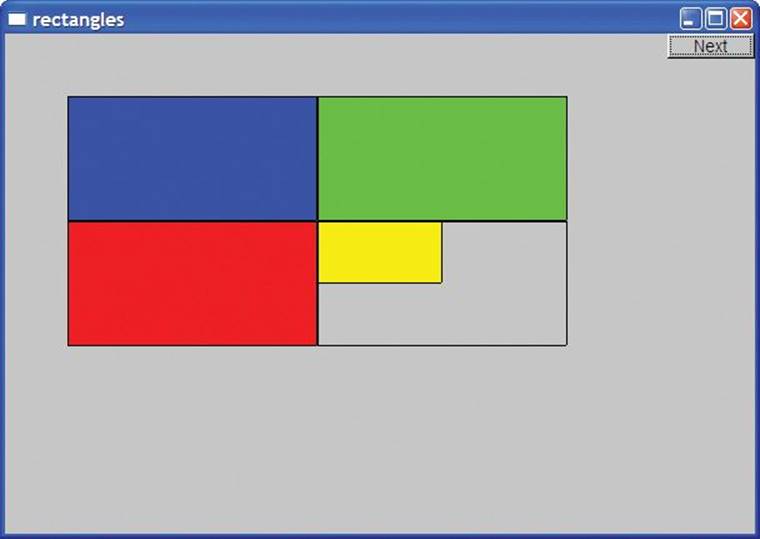
When you don’t have a fill color, the rectangle is transparent; that’s how you can see a corner of the yellow rect00.
We can move shapes around in a window (§14.2.3). For example:
rect11.move(400,0); // to the right of rect21
rect11.set_fill_color(Color::white);
win12.set_label("rectangles 2");
This produces
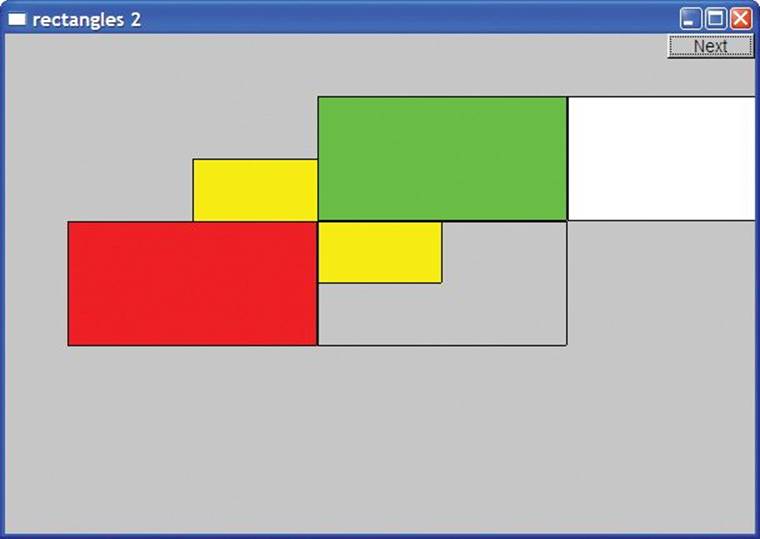
Note how only part of the white rect11 fits in the window. What doesn’t fit is “clipped”; that is, it is not shown anywhere on the screen.
![]()
Note also how shapes are placed one on top of another. This is done just like you would put sheets of paper on a table. The first one you put will be on the bottom. Our Window (§E.3) provides a simple way of reordering shapes. You can tell a window to put a shape on top (usingWindow::put_on_top()). For example:
win12.put_on_top(rect00);
win12.set_label("rectangles 3");
This produces
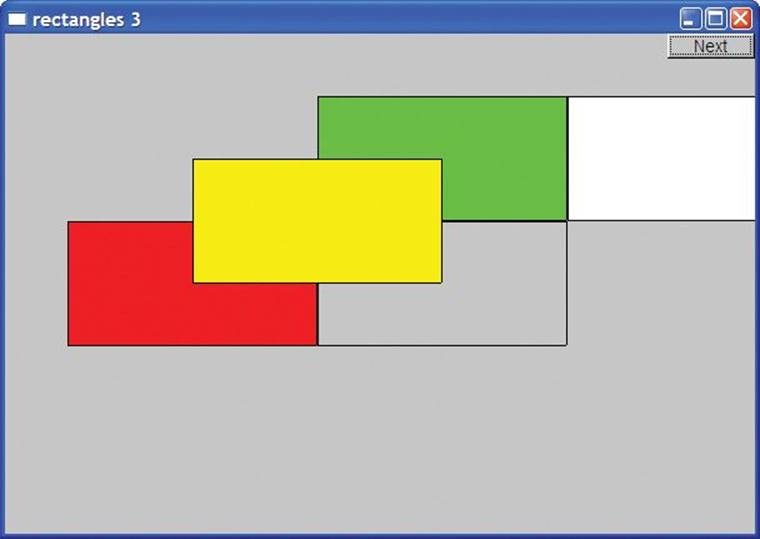
Note that we can see the lines that make up the rectangles even though we have filled (all but one of) them. If we don’t like those outlines, we can remove them:
rect00.set_color(Color::invisible);
rect11.set_color(Color::invisible);
rect12.set_color(Color::invisible);
rect21.set_color(Color::invisible);
rect22.set_color(Color::invisible);
We get
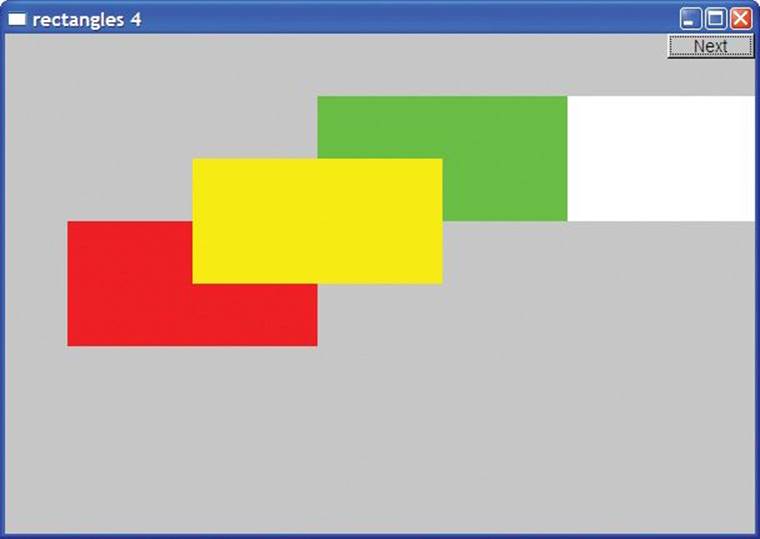
Note that with both fill color and line color set to invisible, rect22 can no longer be seen.
Because it has to deal with both line color and fill color, Rectangle’s draw_lines() is a bit messy:
void Rectangle::draw_lines() const
{
if (fill_color().visibility()) { // fill
fl_color(fill_color().as_int());
fl_rectf(point(0).x,point(0).y,w,h);
}
if (color().visibility()) { // lines on top of fill
fl_color(color().as_int());
fl_rect(point(0).x,point(0).y,w,h);
}
}
As you can see, FLTK provides functions for drawing rectangle fill (fl_rectf()) and rectangle outlines (fl_rect()). By default, we draw both (with the lines/outline on top).
13.10 Managing unnamed objects
So far, we have named all our graphical objects. When we want lots of objects, this becomes infeasible. As an example, let us draw a simple color chart of the 256 colors in FLTK’s palette; that is, let’s make 256 colored squares and draw them in a 16-by-16 matrix that shows how colors with similar color values relate. First, here is the result:
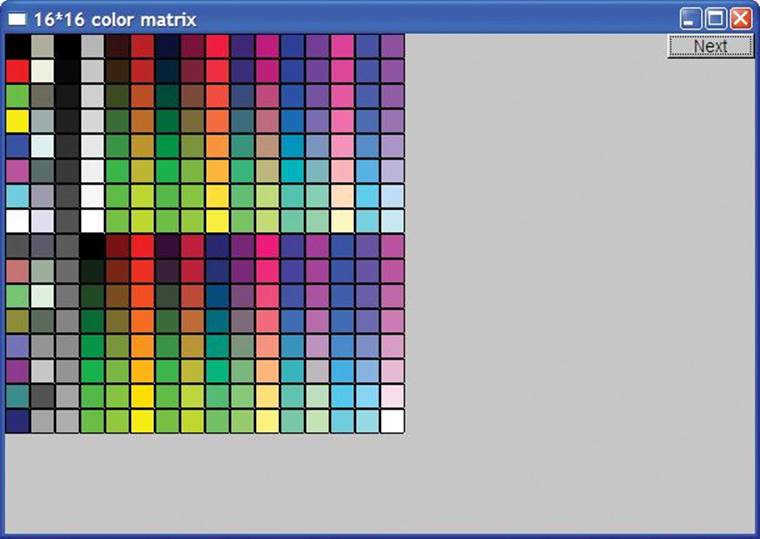
![]()
Naming those 256 squares would not only be tedious, it would be silly. The obvious “name” of the top left square is its location in the matrix (0,0), and any other square is similarly identified (“named”) by a coordinate pair (i,j). What we need for this example is the equivalent of a matrix of objects. We thought of using a vector<Rectangle>, but that turned out to be not quite flexible enough. For example, it can be useful to have a collection of unnamed objects (elements) that are not all of the same type. We discuss that flexibility issue in §14.3. Here, we’ll just present our solution: a vector type that can hold named and unnamed objects:
template<class T> class Vector_ref {
public:
// . . .
void push_back(T&); // add a named object
void push_back(T*); // add an unnamed object
T& operator[](int i); // subscripting: read and write access
const T& operator[](int i) const;
int size() const;
};
The way you use it is very much like a standard library vector:
Vector_ref<Rectangle> rect;
Rectangle x {Point{100,200},Point{200,300}};
rect.push_back(x); // add named
rect.push_back(new Rectangle{Point{50,60},Point{80,90}}); // add unnamed
for (int i=0; i<rect.size(); ++i) rect[i].move(10,10); // use rect
![]()
We explain the new operator in Chapter 17, and the implementation of Vector_ref is presented in Appendix E. For now, it is sufficient to know that we can use it to hold unnamed objects. Operator new is followed by the name of a type (here, Rectangle) optionally followed by an initializer list (here, {Point{50,60},Point{80,90}}). Experienced programmers will be relieved to hear that we did not introduce a memory leak in this example.
Given Rectangle and Vector_ref, we can play with colors. For example, we can draw a simple color chart of the 256 colors shown above:
Vector_ref<Rectangle> vr;
for (int i = 0; i<16; ++i)
for (int j = 0; j<16; ++j) {
vr.push_back(new Rectangle{Point{i*20,j*20},20,20});
vr[vr.size()-1].set_fill_color(Color{i*16+j});
win20.attach(vr[vr.size()-1]);
}
We make a Vector_ref of 256 Rectangles, organized graphically in the Window as a 16-by-16 matrix. We give the Rectangles the colors 0, 1, 2, 3, 4, and so on. After each Rectangle is created, we attach it to the window, so that it will be displayed:

13.11 Text
Obviously, we want to be able to add text to our displays. For example, we might want to label our “odd” Closed_polyline from §13.8:
Text t {Point{200,200},"A closed polyline that isn't a polygon"};
t.set_color(Color::blue);
We get
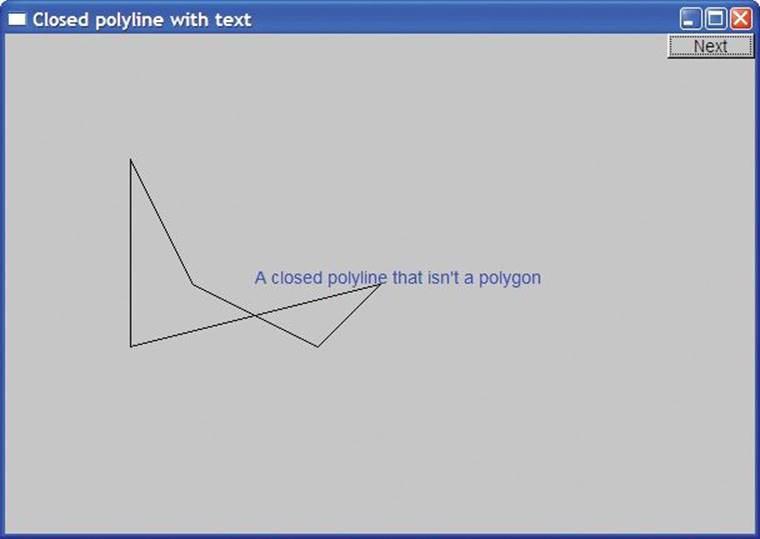
Basically, a Text object defines a line of text starting at a Point. The Point will be the bottom left corner of the text. The reason for restricting the string to be a single line is to ensure portability across systems. Don’t try to put in a newline character; it may or may not be represented as a newline in your window. String streams (§11.4) are useful for composing strings for display in Text objects (examples in §12.7.7 and §12.7.8). Text is defined like this:
struct Text : Shape {
// the point is the bottom left of the first letter
Text(Point x, const string& s)
: lab{s}
{ add(x); }
void draw_lines() const;
void set_label(const string& s) { lab = s; }
string label() const { return lab; }
void set_font(Font f) { fnt = f; }
Font font() const { return fnt; }
void set_font_size(int s) { fnt_sz = s; }
int font_size() const { return fnt_sz; }
private:
string lab; // label
Font fnt {fl_font()};
int fnt_sz {(fl_size()<14)?14:fl_size()} ;
};
If you want the font character size to be less than 14 or larger than the FLTK default, you have to explicitly set it. This is an example of a test protecting a user from possible variations in the behavior of an underlying library. In this case, an update of FLTK changed its default in a way that broke existing programs by making the characters tiny, and we decided to prevent that problem.
We provide the initializers as member initializers, rather than as part of the constructors’ initializer lists, because the initializers do not depend on constructor arguments.
Text has its own draw_lines() because only the Text class knows how its string is stored:
void Text::draw_lines() const
{
fl_draw(lab.c_str(),point(0).x,point(0).y);
}
The color of the characters is determined exactly like the lines in shapes composed of lines (such as Open_polyline and Circle), so you can choose a color using set_color() and see what color is currently used by color(). The character size and font are handled analogously. There is a small number of predefined fonts:
class Font { // character font
public:
enum Font_type {
helvetica=FL_HELVETICA,
helvetica_bold=FL_HELVETICA_BOLD,
helvetica_italic=FL_HELVETICA_ITALIC,
helvetica_bold_italic=FL_HELVETICA_BOLD_ITALIC,
courier=FL_COURIER,
courier_bold=FL_COURIER_BOLD,
courier_italic=FL_COURIER_ITALIC,
courier_bold_italic=FL_COURIER_BOLD_ITALIC,
times=FL_TIMES,
times_bold=FL_TIMES_BOLD,
times_italic=FL_TIMES_ITALIC,
times_bold_italic=FL_TIMES_BOLD_ITALIC,
symbol=FL_SYMBOL,
screen=FL_SCREEN,
screen_bold=FL_SCREEN_BOLD,
zapf_dingbats=FL_ZAPF_DINGBATS
};
Font(Font_type ff) :f{ff} { }
Font(int ff) :f{ff} { }
int as_int() const { return f; }
private:
int f;
};
The style of class definition used to define Font is the same as we used to define Color (§13.4) and Line_style (§13.5).
13.12 Circle
Just to show that the world isn’t completely rectangular, we provide class Circle and class Ellipse. A Circle is defined by a center and a radius:
struct Circle : Shape {
Circle(Point p, int rr); // center and radius
void draw_lines() const;
Point center() const ;
int radius() const { return r; }
void set_radius(int rr)
{
set_point(0,Point{center().x-rr,center().y-rr}); // maintain
// the center
r = rr;
}
private:
int r;
};
We can use Circle like this:
Circle c1 {Point{100,200},50};
Circle c2 {Point{150,200},100};
Circle c3 {Point{200,200},150};
This produces three circles of different sizes aligned with their centers in a horizontal line:
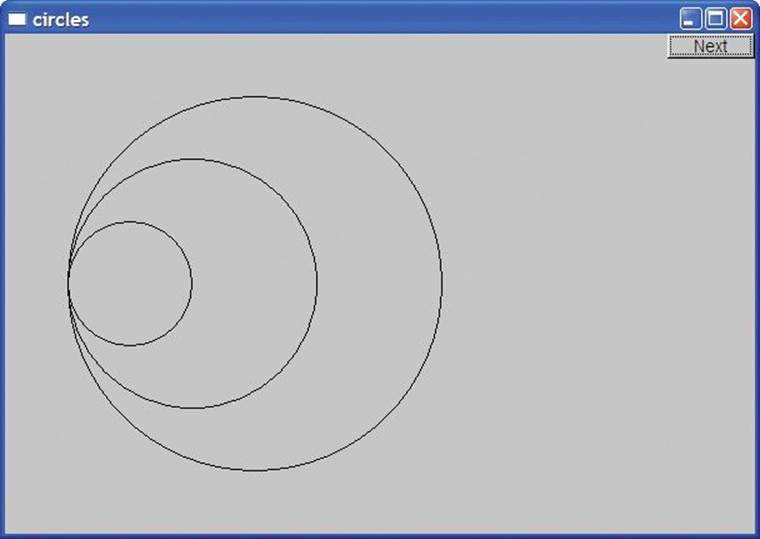
The main peculiarity of Circle’s implementation is that the point stored is not the center, but the top left corner of the square bounding the circle. We could have stored either but chose the one FLTK uses for its optimized circle-drawing routine. That way, Circle provides another example of how a class can be used to present a different (and supposedly nicer) view of a concept than its implementation:
Circle::Circle(Point p, int rr) // center and radius
:r{rr}
{
add(Point{p.x-r,p.y-r}); // store top left corner
}
Point Circle::center() const
{
return {point(0).x+r, point(0).y+r};
}
void Circle::draw_lines() const
{
if (color().visibility())
fl_arc(point(0).x,point(0).y,r+r,r+r,0,360);
}
Note the use of fl_arc() to draw the circle. The initial two arguments specify the top left corner, the next two arguments specify the width and the height of the smallest rectangle that encloses the circle, and the final two arguments specify the beginning and end angle to be drawn. A circle is drawn by going the full 360 degrees, but we can also use fl_arc() to draw parts of a circle (and parts of an ellipse); see exercise 1.
13.13 Ellipse
An ellipse is similar to Circle but is defined with both a major and a minor axis, instead of a radius; that is, to define an ellipse, we give the center’s coordinates, the distance from the center to a point on the x axis, and the distance from the center to a point on the y axis:
struct Ellipse : Shape {
Ellipse(Point p, int w, int h); // center, max and min distance from center
void draw_lines() const;
Point center() const;
Point focus1() const;
Point focus2() const;
void set_major(int ww)
{
set_point(0,Point{center().x-ww,center().y-h}; // maintain
// the center
w = ww;
}
int major() const { return w; }
void set_minor(int hh)
{
set_point(0,Point{center().x-w,center().y-hh}); // maintain
// the center
h = hh;
}
int minor() const { return h; }
private:
int w;
int h;
};
We can use Ellipse like this:
Ellipse e1 {Point{200,200},50,50};
Ellipse e2 {Point{200,200},100,50};
Ellipse e3 {Point{200,200},100,150};
This gives us three ellipses with a common center but different-size axes:
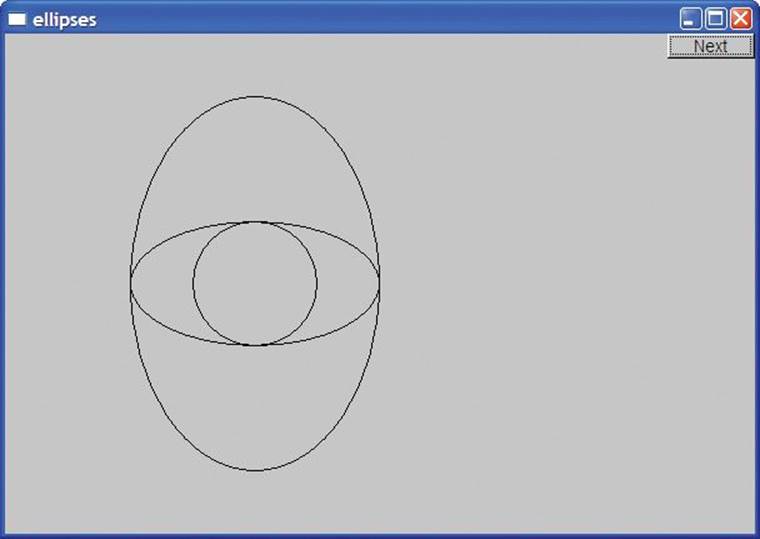
Note that an Ellipse with major()==minor() looks exactly like a circle.
Another popular view of an ellipse specifies two foci plus a sum of distances from a point to the foci. Given an Ellipse, we can compute a focus. For example:
Point focus1() const
{
if (h<=w) // foci are on the x axis:
return {center().x+int(sqrt(double(w*w-h*h))),center().y};
else // foci are on the y axis:
return {center().x,center().y+int(sqrt(double(h*h-w*w)))};
}
![]()
Why is a Circle not an Ellipse? Geometrically, every circle is an ellipse, but not every ellipse is a circle. In particular, a circle is an ellipse where the two foci are equal. Imagine that we defined our Circle to be an Ellipse. We could do that at the cost of needing an extra value in its representation (a circle is defined by a point and a radius; an ellipse needs a center and a pair of axes). We don’t like space overhead where we don’t need it, but the primary reason for our Circle not being an Ellipse is that we couldn’t define it so without somehow disabling set_major() andset_minor(). After all, it would not be a circle (as a mathematician would recognize it) if we could use set_major() to get major()!=minor() — at least it would no longer be a circle after we had done that. We can’t have an object that is of one type sometimes (i.e., when major()!=minor()) and another type some other time (i.e., when major()==minor()). What we can have is an object (an Ellipse) that can look like a circle sometimes. A Circle, on the other hand, never morphs into an ellipse with two unequal axes.
![]()
![]()
When we design classes, we have to be careful not to be too clever and not to be deceived by our “intuition” into defining classes that don’t make sense as classes in our code. Conversely, we have to take care that our classes represent some coherent concept and are not just a collection of data and function members. Just throwing code together without thinking about what ideas/concepts we are representing is “hacking” and leads to code that we can’t explain and that others can’t maintain. If you don’t feel altruistic, remember that “others” might be you in a few months’ time. Such code is also harder to debug.
13.14 Marked_polyline
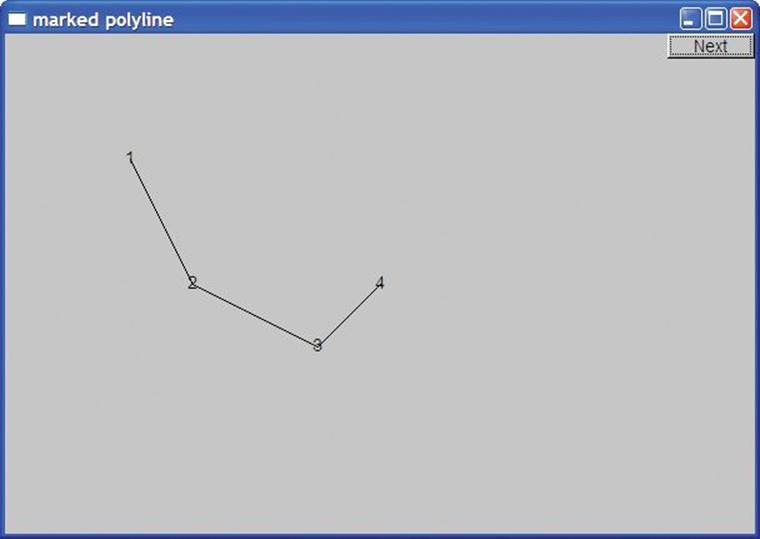
We often want to “label” points on a graph. One way of displaying a graph is as an open polyline, so what we need is an open polyline with “marks” at the points. A Marked_polyline does that. For example:
Marked_polyline mpl {"1234"};
mpl.add(Point{100,100));
mpl.add(Point{150,200));
mpl.add(Point{250,250));
mpl.add(Point{300,200));
This produces
The definition of Marked_polyline is
struct Marked_polyline : Open_polyline {
Marked_polyline(const string& m) :mark{m} { if (m=="") mark = "*"; }
Marked_polyline(const string& m, initializer_list<Point> lst);
void draw_lines() const;
private:
string mark;
};
By deriving from Open_polyline, we get the handling of Points “for free”; all we have to do is to deal with the marks. In particular, draw_lines() becomes
void Marked_polyline::draw_lines() const
{
Open_polyline::draw_lines();
for (int i=0; i<number_of_points(); ++i)
draw_mark(point(i),mark[i%mark.size()]);
}
The call Open_polyline::draw_lines() takes care of the lines, so we just have to deal with the “marks.” We supply the marks as a string of characters and use them in order: the mark[i%mark.size()] selects the character to be used next by cycling through the characters supplied when theMarked_polyline was created. The % is the modulo (remainder) operator. This draw_lines() uses a little helper function draw_mark() to actually output a letter at a given point:
void draw_mark(Point xy, char c)
{
constexpr int dx = 4;
constexpr int dy = 4;
string m {1,c}; // string holding the single char c
fl_draw(m.c_str(),xy.x-dx,xy.y+dy);
}
The dx and dy constants are used to center the letter over the point. The string m is constructed to contain the single character c.
The constructor that takes an initializer list simply forwards the list Open_polyline’s initializer-list constructor:
Marked_polyline(const string& m, initializer_list<Point> lst)
:Open_polyline{lst},
mark{m}
{
if (m=="") mark = "*";
}
The test for the empty string is needed to avoid draw_lines() trying to access a character that isn’t there.
Given the constructor that takes an initializer list, we can abbreviate the example to
Marked_polyline mpl {"1234",{{100,100}, {150,200}, {250,250}, {300,200}}};
13.15 Marks
Sometimes, we want to display marks without lines connecting them. We provide the class Marks for that. For example, we can mark the four points we have used for our various examples without connecting them with lines:
Marks pp {"x",{{100,100}, {150,200}, {250,250}, {300,200}}};
This produces
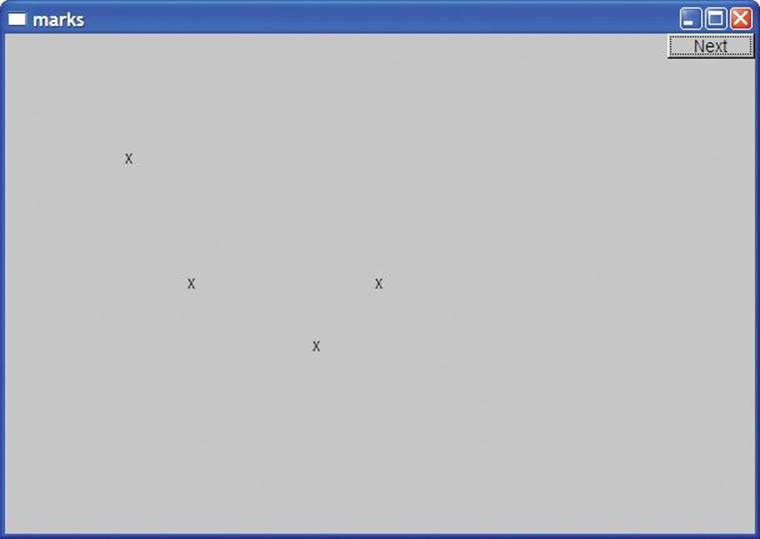
One obvious use of Marks is to display data that represents discrete events so that drawing connecting lines would be inappropriate. An example would be (height, weight) data for a group of people.
A Marks is simply a Marked_polyline with the lines invisible:
struct Marks : Marked_polyline {
Marks(const string& m)
:Marked_polyline{m}
{
set_color(Color{Color::invisible});
}
Marked_polyline(const string& m, initializer_list<Point> lst)
: Marked_polyline{m,lst}
{
set_color(Color{Color::invisible});
}
};
The :Marked_polyline{m} notation is used to initialize the Marked_polyline part of a Marks object. This notation is a variant of the syntax used to initialize members (§9.4.4).
13.16 Mark
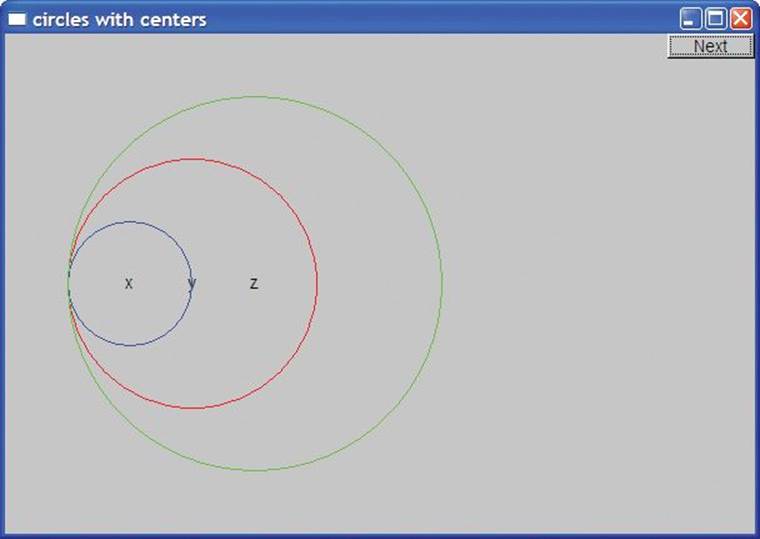
A Point is simply a location in a Window. It is not something we draw or something we can see. If we want to mark a single Point so that we can see it, we can indicate it by a pair of lines as in §13.2 or by using Marks. That’s a bit verbose, so we have a simple version of Marks that is initialized by a point and a character. For example, we could mark the centers of our circles from §13.12 like this:
Mark m1 {Point{100,200},'x'};
Mark m2 {Point{150,200},'y'};
Mark m3 {Point{200,200},'z'};
c1.set_color(Color::blue);
c2.set_color(Color::red);
c3.set_color(Color::green);
This produces
A Mark is simply a Marks with its initial (and typically only) point given immediately:
struct Mark : Marks {
Mark(Point xy, char c) : Marks{string{1,c}}
{
add(xy);
}
};
The string{1,c} is a constructor for string, initializing the string to contain the single character c.
All Mark provides is a convenient notation for creating a Marks object with a single point marked with a single character. Is Mark worth our effort to define it? Or is it just “spurious complication and confusion”? There is no clear, logical answer. We went back and forth on this question, but in the end decided that it was useful for users and the effort to define it was minimal.
Why use a character as a “mark”? We could have used any small shape, but characters provide a useful and simple set of marks. It is often useful to be able to use a variety of “marks” to distinguish different sets of points. Characters such as x, o, +, and * are pleasantly symmetric around a center.
13.17 Images
The average personal computer holds thousands of images in files and can access millions more over the web. Naturally, we want to display some of those images in even quite simple programs. For example, here is an image (rita_path.gif) of the projected path of Hurricane Rita as it approached the Texas Gulf Coast:
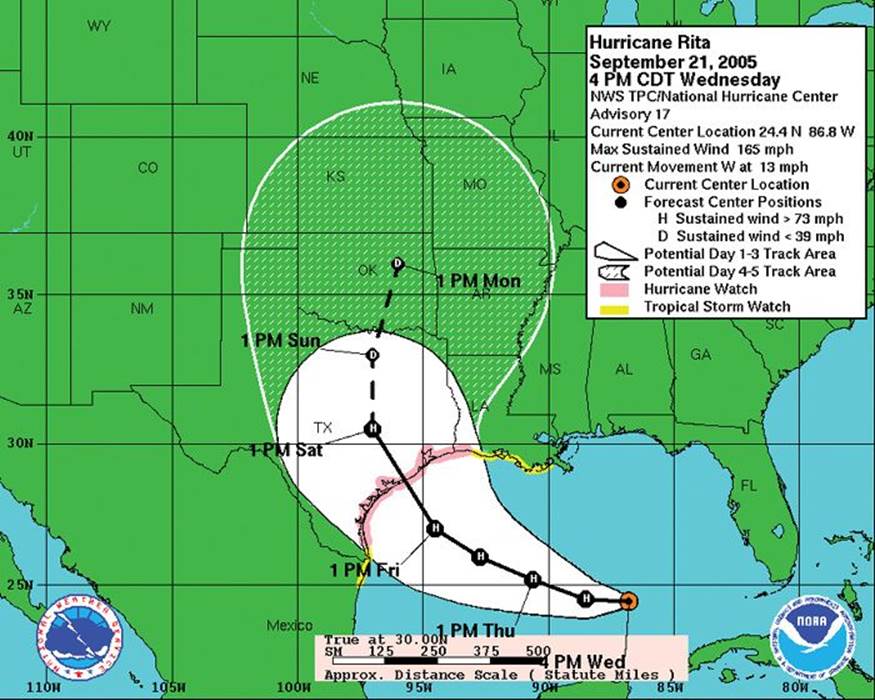
We can select part of that image and add a photo of Rita as seen from space (rita.jpg):
Image rita {Point{0,0},"rita.jpg"};
Image path {Point{0,0},"rita_path.gif"};
path.set_mask(Point{50,250},600,400); // select likely landfall
win.attach(path);
win.attach(rita);
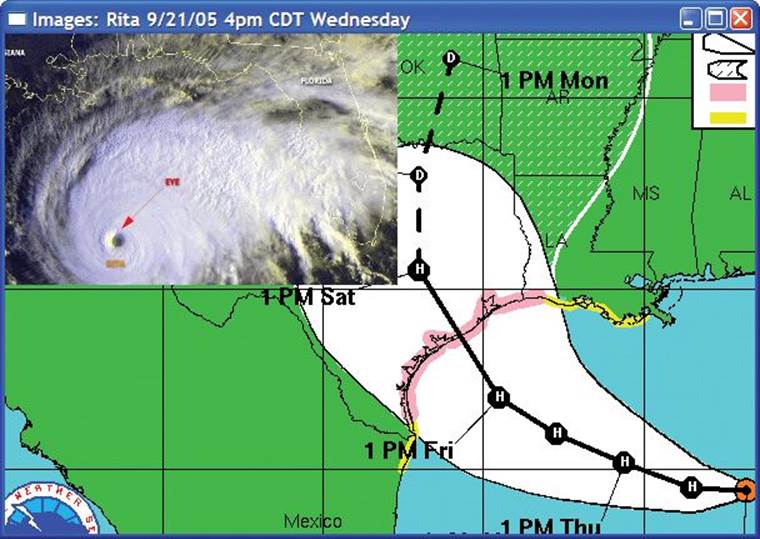
The set_mask() operation selects a sub-picture of an image to be displayed. Here, we selected a (600,400)-pixel image from rita_path.gif (loaded as path) with its top leftmost point at path’s point (50,250). Selecting only part of an image for display is so common that we chose to support it directly.
Shapes are laid down in the order they are attached, like pieces of paper on a desk, so we got path “on the bottom” simply by attaching it before rita.
Images can be encoded in a bewildering variety of formats. Here we deal with only two of the most common, JPEG and GIF:
enum class Suffix { none, jpg, gif };
In our graphics interface library, we represent an image in memory as an object of class Image:
struct Image : Shape {
Image(Point xy, string file_name, Suffix e = Suffix::none);
~Image() { delete p; }
void draw_lines() const;
void set_mask(Point xy, int ww, int hh)
{ w=ww; h=hh; cx=xy.x; cy=xy.y; }
private:
int w,h; // define “masking box” within image relative to position (cx,cy)
int cx,cy;
Fl_Image* p;
Text fn;
};
The Image constructor tries to open a file with the name given to it. Then it tries to create a picture using the encoding specified as an optional argument or (more often) as a file suffix. If the image cannot be displayed (e.g., because the file wasn’t found), the Image displays a Bad_image. The definition of Bad_image looks like this:
struct Bad_image : Fl_Image {
Bad_image(int h, int w) : Fl_Image{h,w,0} { }
void draw(int x,int y, int, int, int, int) { draw_empty(x,y); }
};
The handling of images within a graphics library is quite complicated, but the main complexity of our graphics interface class Image is in the file handling in the constructor:
// somewhat overelaborate constructor
// because errors related to image files can be such a pain to debug
Image::Image(Point xy, string s, Suffix e)
:w{0}, h{0}, fn{xy,""}
{
add(xy);
if (!can_open(s)) { // can we open s?
fn.set_label("cannot open \""+s+'"');
p = new Bad_image(30,20); // the “error image”
return;
}
if (e == Suffix::none) e = get_encoding(s);
switch(e) { // check if it is a known encoding
case Suffix::jpg:
p = new Fl_JPEG_Image{s.c_str()};
break;
case Suffix::gif:
p = new Fl_GIF_Image{s.c_str()};
break;
default: // unsupported image encoding
fn.set_label("unsupported file type \""+s+'"');
p = new Bad_image{30,20}; // the “error image”
}
}
We use the suffix to pick the kind of object we create to hold the image (a Fl_JPEG_Image or a Fl_GIF_Image). We create that implementation object using new and assign it to a pointer. This is an implementation detail (see Chapter 17 for a discussion of operator new and pointers) related to the organization of FLTK and is of no fundamental importance here. FLTK uses C-style strings, so we have to use s.c_str() rather than plain s.
Now, we just have to implement can_open() to test if we can open a named file for reading:
bool can_open(const string& s)
// check if a file named s exists and can be opened for reading
{
ifstream ff(s);
return ff;
}
Opening a file and then closing it again is a fairly clumsy way of portably separating errors related to “can’t open the file” from errors related to the format of the data in the file.
You can look up the get_encoding() function, if you like. It simply looks for a suffix and looks up that suffix in a table of known suffixes. That lookup table is a standard library map (see §21.6).
 Drill
Drill
1. Make an 800-by-1000 Simple_window.
2. Put an 8-by-8 grid on the leftmost 800-by-800 part of that window (so that each square is 100 by 100).
3. Make the eight squares on the diagonal starting from the top left corner red (use Rectangle).
4. Find a 200-by-200-pixel image (JPEG or GIF) and place three copies of it on the grid (each image covering four squares). If you can’t find an image that is exactly 200 by 200, use set_mask() to pick a 200-by-200 section of a larger image. Don’t obscure the red squares.
5. Add a 100-by-100 image. Have it move around from square to square when you click the “Next” button. Just put wait_for_button() in a loop with some code that picks a new square for your image.
Review
1. Why don’t we “just” use a commercial or open-source graphics library directly?
2. About how many classes from our graphics interface library do you need to do simple graphics output?
3. What are the header files needed to use the graphics interface library?
4. What classes define closed shapes?
5. Why don’t we just use Line for every shape?
6. What do the arguments to Point indicate?
7. What are the components of Line_style?
8. What are the components of Color?
9. What is RGB?
10. What are the differences between two Lines and a Lines containing two lines?
11. What properties can you set for every Shape?
12. How many sides does a Closed_polyline defined by five Points have?
13. What do you see if you define a Shape but don’t attach it to a Window?
14. How does a Rectangle differ from a Polygon with four Points (corners)?
15. How does a Polygon differ from a Closed_polyline?
16. What’s on top: fill or outline?
17. Why didn’t we bother defining a Triangle class (after all, we did define Rectangle)?
18. How do you move a Shape to another place in a Window?
19. How do you label a Shape with a line of text?
20. What properties can you set for a text string in a Text?
21. What is a font and why do we care?
22. What is Vector_ref for and how do we use it?
23. What is the difference between a Circle and an Ellipse?
24. What happens if you try to display an Image given a file name that doesn’t refer to a file containing an image?
25. How do you display part of an image?
Terms
closed shape
color
ellipse
fill
font
font size
GIF
image
image encoding
invisible
JPEG
line
line style
open shape
point
polygon
polyline
unnamed object
Vector_ref
visible
Exercises
For each “define a class” exercise, display a couple of objects of the class to demonstrate that they work.
1. Define a class Arc, which draws a part of an ellipse. Hint: fl_arc().
2. Draw a box with rounded corners. Define a class Box, consisting of four lines and four arcs.
3. Define a class Arrow, which draws a line with an arrowhead.
4. Define functions n(), s(), e(), w(), center(), ne(), se(), sw(), and nw(). Each takes a Rectangle argument and returns a Point. These functions define “connection points” on and in the rectangle. For example, nw(r) is the northwest (top left) corner of a Rectangle called r.
5. Define the functions from exercise 4 for a Circle and an Ellipse. Place the connection points on or outside the shape but not outside the bounding rectangle.
6. Write a program that draws a class diagram like the one in §12.6. It will simplify matters if you start by defining a Box class that is a rectangle with a text label.
7. Make an RGB color chart (e.g., search the web for “RGB color chart”).
8. Define a class Regular_hexagon (a regular hexagon is a six-sided polygon with all sides of equal length). Use the center and the distance from the center to a corner point as constructor arguments.
9. Tile a part of a window with Regular_hexagons (use at least eight hexagons).
10. Define a class Regular_polygon. Use the center, the number of sides (>2), and the distance from the center to a corner as constructor arguments.
11. Draw a 300-by-200-pixel ellipse. Draw a 400-pixel-long x axis and a 300-pixel-long y axis through the center of the ellipse. Mark the foci. Mark a point on the ellipse that is not on one of the axes. Draw the two lines from the foci to the point.
12. Draw a circle. Move a mark around on the circle (let it move a bit each time you hit the “Next” button).
13. Draw the color matrix from §13.10, but without lines around each color.
14. Define a right triangle class. Make an octagonal shape out of eight right triangles of different colors.
15. “Tile” a window with small right triangles.
16. Do the previous exercise, but with hexagons.
17. Do the previous exercise, but using hexagons of a few different colors.
18. Define a class Poly that represents a polygon but checks that its points really do make a polygon in its constructor. Hint: You’ll have to supply the points to the constructor.
19. Define a class Star. One parameter should be the number of points. Draw a few stars with differing numbers of points, differing line colors, and differing fill colors.
Postscript
Chapter 12 showed how to be a user of classes. This chapter moves us one level up the “food chain” of programmers: here we become tool builders in addition to being tool users.
All materials on the site are licensed Creative Commons Attribution-Sharealike 3.0 Unported CC BY-SA 3.0 & GNU Free Documentation License (GFDL)
If you are the copyright holder of any material contained on our site and intend to remove it, please contact our site administrator for approval.
© 2016-2026 All site design rights belong to S.Y.A.