Administering ArcGIS for Server (2014)
Chapter 8. Server Logs
Besides securing the GIS services, which we learned in the previous chapter, it is important to keep an eye on the services to verify that they are healthy and available for use. Monitoring a live system is crucial to maintaining stability and performance; not only to avoid potential failures but even for debugging and tracing back an event. That is why having a system record its activities results in a rich database of logs that can be used for investigation. Logfiles tell a fascinating story to those who can read it. They carry the history of all events narrated in thorough detail. ArcGIS for Server, like any other system, keeps logfiles for all events, from the basic "connection established" event to the severe "service failed to initiate" event. In this chapter, we will learn how to read logfiles and understand them in order to extract useful information that can help solving problems that might occur.
Logging levels
Recording events on Server is done at different levels. You can tell Server to log every single event as it happens or filter to record only fatal errors. Consequently, recording fine events generates more logs than recording only those messages with errors. There are seven logging levels, and these are described in the following Esri table:
|
Log level |
Description |
|
Severe |
This level logs serious problems that require immediate attention. It only includes severe messages. |
|
Warning |
This level logs moderate problems that require attention. It also includes severe-level messages. |
|
Info |
This level logs common administrative messages from Server, including messages about service creation and startup. It also includes severe and warning messages. |
|
Fine |
This level logs common messages from users of Server, such as names of operation requests received. It includes severe, warning, and info messages. |
|
Verbose |
This level logs messages providing more details about how Server completes an operation, such as whether each layer in a map service was drawn successfully, how fast the layer was drawn, and how long it took Server to access the layer's source data. This level includes severe, warning, info, and fine messages. |
|
Debug |
This level logs highly verbose messages designed for developers and support technicians who want to obtain a better understanding of the state of Server when troubleshooting. This level should not be used in a production environment as it may cause a significant decrease in Server performance. |
|
Off |
At this level, logging is turned off. Events are not logged with Server. |
As you can see, Debug is the finest level and keeps Server busy with logging events, making other important tasks suffer.
Log analysis
Logs can be viewed and refreshed actively from the ArcGIS for Server Manager window as they are written. To see your current logfiles, go to Manager and activate the Logs tab:

Naturally, each GIS server generates its own logs and this is all saved by default at C:\arcgisserver\logs\. You cannot use a shared folder for this; each GIS server should generate its own logs in its directory, ArcGIS for Server aggregates those logs into the Server site, in a table view with filters options, which allows you to search through the logs. From the View Log Messages panel, click on Query to view the current logfiles as shown in the following screenshot. You might get messages different from mine.
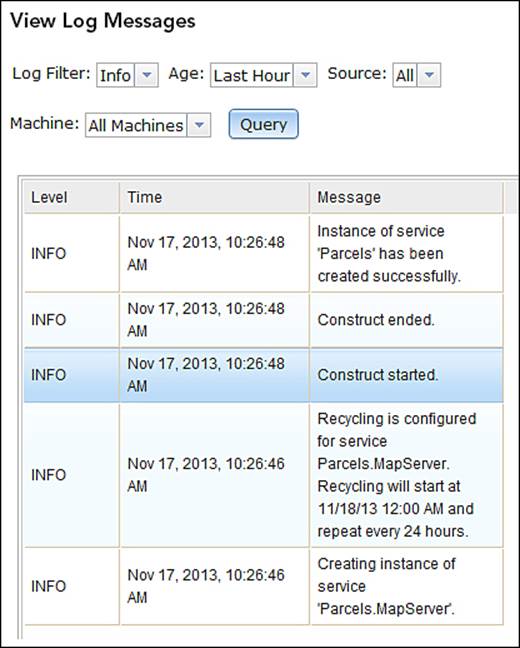
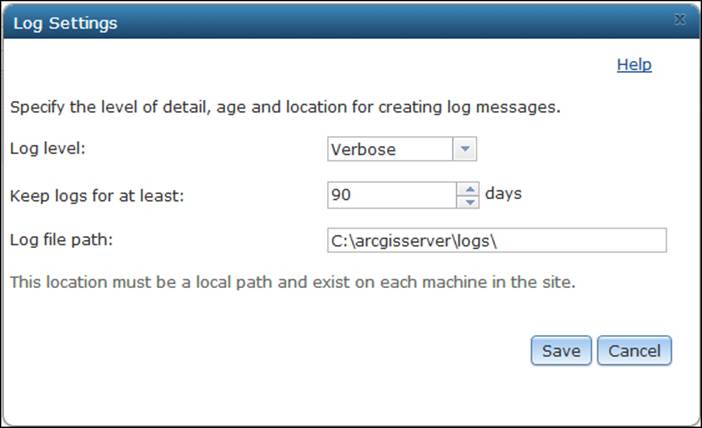
You might not have any messages if your current log level is set to only record errors, and there are no errors. To change the log level, click on Settings. From the Log Settings form, select Verbose from the Log Level drop-down list. You can set the logs to be cleared automatically if you want to. Keep the rest of the settings intact and click on the Save button.
By default, the logs are kept on the GIS server for three months. If you are planning to keep the logs for longer than that, perhaps for offline analysis, you may want to archive them periodically and delete them. Generally, clearing the logs is better for performance. This will be discussed in the coming pages.
Tip
Best practice
Since logs are saved to disk frequently, they use high IO. It is recommended that you point the log path to a local directory, preferably on a Solid State Drive (SSD) for best performance.
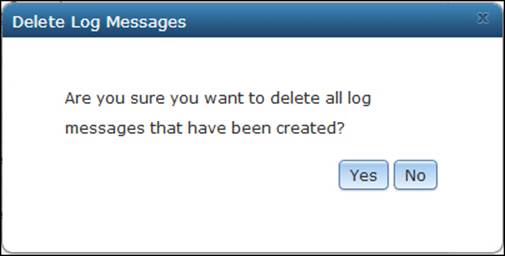
Now, let us see how the logs are being generated. First of all, let us clear all the logs to start afresh. To do that, click on Delete Logs from ArcGIS for Server Manager and then click on Yes, as shown in the following screenshot:
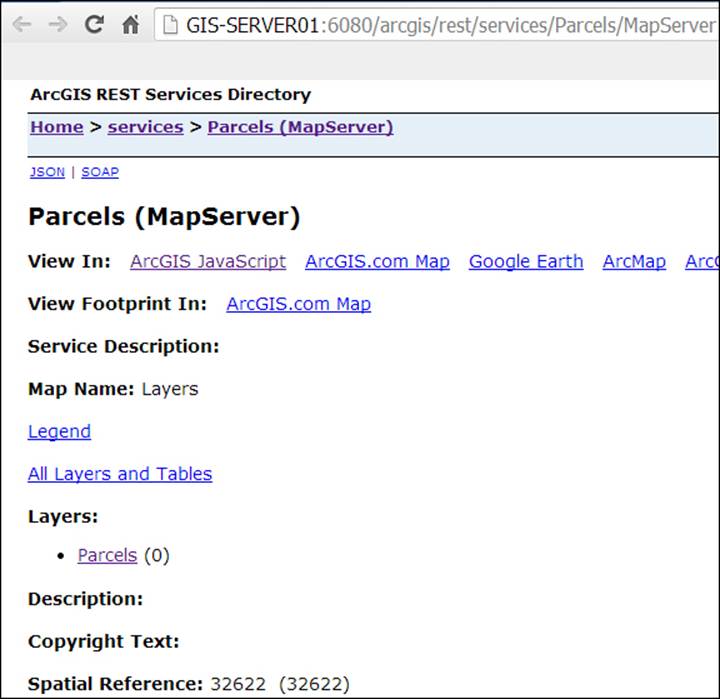
Now that the logs are cleared, we will activate the parcels service by simply visiting the REST URL and then checking the log. You must remember how we get the REST URL from a service; we explained that in Chapter 3, Consuming GIS Services. The following is the REST URL:
http://GIS-SERVER01:6080/arcgis/rest/services/Parcels/MapServer
Type the REST URL on a new browser page and press Enter. You should see something like the following screenshot if you have access to the service:
Go back to your logs and click on Query to refresh the page. You should see one message in the table. You might see other messages from Server that happened to be executed at that particular time but look for this one:
|
Level |
Time |
Message |
Source |
Machine |
User Name |
|
INFO |
Nov 17, 2013, 11:18:26 AM |
Request user: Anonymous user, Service: Parcels/MapServer |
Rest |
GIS-SERVER01 |
Anonymous user |
The level is INFO, which means a detailed event; it says a request user from REST consumed the Parcels Map Service and GIS-SERVER01 served that request. If you have security enabled, you would even know which user consumed that service. Now, let us take it to the next level. On the Parcels REST page, click on ArcGIS JavaScript to view the map with the service loaded.
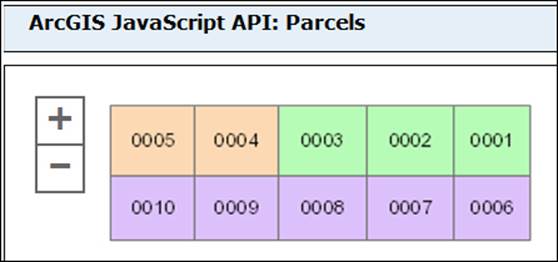
Go back to the log view and click on Query to refresh; make sure the Log Filter dropdown is set to Verbose. A fleet of messages was generated from our last action; we will take a look at each line and analyze it.
Note
There are many columns that can be displayed on the log table and you can show or hide them from the Columns button.
For a better view, you can click on the Printer Friendly View link, which will display a text format version of this table in a new page.

This is the log we are going to analyze; we will start from the first line:
INFO, Nov 17, 2013, 11:29:17 AM, Request user: Anonymous user, Service: Parcels/MapServer Rest.
This is a request to consume the service. You can use this identifier to measure how many times a service has been requested.
FINE Nov 17, 2013, 11:29:17 AM REST request received. Request size is 178 characters. Parcels.MapServer
The preceding line is appended if there is more work to be followed; it shows the request size in bytes.
FINE Nov 17, 2013, 11:29:17 AM Begin ExportMapImage Parcels.MapServer
The process is so fast that we are still in the same second. The preceding line of code tells us that the Export Map Image process just started. This is the big process where Server exports an image of the desired area; however, there is still more work to follow to create the actual image. You can start measuring the drawing time of a certain service from this line.
VERBOSE Nov 17, 2013, 11:29:17 AM Begining of preparation. Parcels.MapServer
VERBOSE Nov 17, 2013, 11:29:17 AM End of preparation. Parcels.MapServer
The preceding two lines highlight the preparation of the export image process. They usually happen very fast.
FINE Nov 17, 2013, 11:29:17 AM Extent:1467314.863829,2191233.084700,2574598.328396,2702665.79038;Size:1574,727; Scale:2658831.00Parcels.MapServer
A map needs an initial extent coordinates for it to draw. At the first call of the service, Server implicitly sends the default full extent to draw the map. After that, the user will explicitly request a new extent, each time he/she zooms in or pans the map.
VERBOSE Nov 17, 2013, 11:29:17 AM Beginning of layer draw: Parcels Parcels.MapServer
Since we only have one layer, you will see one occurrence of this line; however, you will see these lines reappear with more layers and there will be more logs to follow.
VERBOSE Nov 17, 2013, 11:29:17 AM Execute Query Parcels.MapServer
I consider this one of the most important lines; this is where the database is advised and queried to get the actual features. You can make a good measurement here by monitoring how long an execute query takes. If this takes a long time to execute, you might want to consult your DBA to look into tuning the database.
VERBOSE Nov 17, 2013, 11:29:17 AM Symbol Drawing Parcels.MapServer
VERBOSE Nov 17, 2013, 11:29:17 AM Data Access Parcels.MapServer
VERBOSE Nov 17, 2013, 11:29:17 AM Symbolizing Parcels.MapServer
Symbology work, depending on the user, can be executed either on the server or on the client. Since we are running on a browser, the symbology drawing will be carried on the client's browser by JavaScript. Note that this is only the symbology drawing; the labeling is done in another step.
VERBOSE Nov 17, 2013, 11:29:17 AM Number of features drawn: 10Parcels.MapServer
This message shows the number of features that have been drawn. This line is useful if you want to know how many features are retrieved for each request and monitor the performance.
VERBOSE Nov 17, 2013, 11:29:17 AM End of layer draw: Parcels Parcels.MapServer
This line signifies the end of layer drawing; you should now start seeing the map, but with no labels.
VERBOSE Nov 17, 2013, 11:29:17 AM Beginning of labeling phase (labeling and label draw) Parcels.MapServer
Now that the symbology work is done, the labeling will start. This will give you even more measurement indicators for performance.
VERBOSE Nov 17, 2013, 11:29:17 AM Symbol Drawing Parcels.MapServer
It draws the font symbol as described in the layer description which can be found in the layer properties.
VERBOSE Nov 17, 2013, 11:29:17 AM Number of features drawn: 10 Parcels.MapServer
The preceding line indicates that the features have been labeled successfully.
VERBOSE Nov 17, 2013, 11:29:17 AM End of labeling phase (labeling and label draw) Parcels.MapServer
The preceding line marks the end of the labeling phase.
FINE Nov 17, 2013, 11:29:17 AM End ExportMapImage Parcels.MapServer
The map image has been exported successfully; we will attempt to deliver it to the client after this.
FINE Nov 17, 2013, 11:29:17 AM REST request successfully processed. Response size is 6364 characters. Parcels.MapServer
The last message describes the response map, which is a 6K map image. My Server is so fast that the whole thing happened in the same second. This is not much by way of a log analysis. However, in the next topic we will attempt to analyze a much richer log and will try to answer some questions.
Exercise – finding the bottleneck
A client is suffering from severe performance with their new GIS web application. The client has provided you with a detailed verbose log of the default extent, hoping you will find what is wrong with the application. There are three services: Pole, Powercable, andServicePoint. The application points to the three services and displays them using JavaScript API. You can find the logfile in the support files under 7364EN_08_Files\AGSA\Log.
The logfile
The following logs were generated on Nov 17, 2013 between 11:31:00 and 11:31:59. They were generated during the last minute of the request duration.
FINE Nov 17, 2013, 11:31:29 AM REST request successfullyprocessed. Response size is 10976 characters. PowerCable.MapServer
FINE Nov 17, 2013, 11:31:29 AM End ExportMapImage PowerCable.MapServer
VERBOSE Nov 17, 2013, 11:31:29 AM End of labeling phase (labeling and label draw) PowerCable.MapServer
VERBOSE Nov 17, 2013, 11:31:19 AM Number of features drawn: 35 PowerCable.MapServer
VERBOSE Nov 17, 2013, 11:31:19 AM Symbol Drawing PowerCable.MapServer
VERBOSE Nov 17, 2013, 11:31:19 AM Beginning of labeling phase (labeling and label draw) PowerCable.MapServer
VERBOSE Nov 17, 2013, 11:31:19 AM End of layer draw: PowerCablePowerCable.MapServer
VERBOSE Nov 17, 2013, 11:31:19 AM Number of features drawn: 35 PowerCable.MapServer
VERBOSE Nov 17, 2013, 11:31:19 AM Symbol Drawing PowerCable.MapServer
VERBOSE Nov 17, 2013, 11:31:19 AM Data Access PowerCable.MapServer
VERBOSE Nov 17, 2013, 11:31:19 AM Symbolizing PowerCable.MapServer
VERBOSE Nov 17, 2013, 11:31:19 AM Execute Query PowerCable.MapServer
VERBOSE Nov 17, 2013, 11:31:19 AM Beginning of layer draw: PowerCable PowerCable.MapServer
FINE Nov 17, 2013, 11:31:19 AM Extent:1467314.863829,2191233.084700,2574598.328396,2702665.79038;Size:1574,727; Scale:2658831.00PowerCable.MapServer
VERBOSE Nov 17, 2013, 11:31:19 AM End of preparation. PowerCable.MapServer
VERBOSE Nov 17, 2013, 11:31:19 AM Begining of preparation. PowerCable.MapServer
FINE Nov 17, 2013, 11:31:19 AM Begin ExportMapImage PowerCable.MapServer
FINE Nov 17, 2013, 11:31:19 AM REST request received. Request size is 178 characters. PowerCable.MapServer
INFO Nov 17, 2013, 11:31:19 AM Request user: Anonymous user, Service: PowerCable/MapServer Rest
FINE Nov 17, 2013, 11:31:19 AM REST request successfully processed. Response size is 5764 characters. ServicePoint.MapServer
FINE Nov 17, 2013, 11:31:19 AM End ExportMapImage ServicePoint.MapServer
VERBOSE Nov 17, 2013, 11:31:15 AM End of labeling phase (labeling and label draw) ServicePoint.MapServer
VERBOSE Nov 17, 2013, 11:31:15 AM Number of features drawn: 10 ServicePoint.MapServer
VERBOSE Nov 17, 2013, 11:31:15 AM Symbol Drawing ServicePoint.MapServer
VERBOSE Nov 17, 2013, 11:31:15 AM Beginning of labeling phase (labeling and label draw) ServicePoint.MapServer
VERBOSE Nov 17, 2013, 11:31:15 AM End of layer draw: ServicePoint ServicePoint.MapServer
VERBOSE Nov 17, 2013, 11:31:15 AM Number of features drawn: 10 ServicePoint.MapServer
VERBOSE Nov 17, 2013, 11:31:01 AM Symbol Drawing ServicePoint.MapServer
VERBOSE Nov 17, 2013, 11:31:01 AM Data Access ServicePoint.MapServer
VERBOSE Nov 17, 2013, 11:31:01 AM Symbolizing ServicePoint.MapServer
VERBOSE Nov 17, 2013, 11:31:01 AM Execute Query ServicePoint.MapServer
VERBOSE Nov 17, 2013, 11:31:01 AM Beginning of layer draw: ServicePoint ServicePoint.MapServer
FINE Nov 17, 2013, 11:31:01 AM Extent:1467314.863829,2191233.084700,2574598.328396,2702665.79038; Size:1574,727; Scale:2658831.00ServicePoint.MapServer
VERBOSE Nov 17, 2013, 11:31:01 AM End of preparation. ServicePoint.MapServer
VERBOSE Nov 17, 2013, 11:31:01 AM Begining of preparation. ServicePoint.MapServer
FINE Nov 17, 2013, 11:31:01 AM Begin ExportMapImage ServicePoint.MapServer
FINE Nov 17, 2013, 11:31:01 AM REST request received. Request size is 993 characters. ServicePoint.MapServer
INFO Nov 17, 2013, 11:31:01 AM Request user: Anonymous user, Service: ServicePoint/MapServer Rest
FINE Nov 17, 2013, 11:31:01 AM REST request successfully processed. Response size is 96478 characters. Pole.MapServer
FINE Nov 17, 2013, 11:31:01 AM End ExportMapImage Pole.MapServer
VERBOSE Nov 17, 2013, 11:31:01 AM End of labeling phase (labeling and label draw) Pole.MapServer
VERBOSE Nov 17, 2013, 11:31:01 AM Number of features drawn: 6241 Pole.MapServer
The following logs were generated between 11:29:00 and 11:29:45. They were generated during the first minute of the request duration.
VERBOSE Nov 17, 2013, 11:29:45 AM Symbol Drawing Pole.MapServer
VERBOSE Nov 17, 2013, 11:29:45 AM Beginning of labeling phase (labeling and label draw) Pole.MapServer
VERBOSE Nov 17, 2013, 11:29:45 AM End of layer draw: Pole Pole.MapServer
VERBOSE Nov 17, 2013, 11:29:45 AM Number of features drawn: 6241 Pole.MapServer
VERBOSE Nov 17, 2013, 11:29:17 AM Symbol Drawing Pole.MapServer
VERBOSE Nov 17, 2013, 11:29:17 AM Data Access Pole.MapServer
VERBOSE Nov 17, 2013, 11:29:17 AM Symbolizing Pole.MapServer
VERBOSE Nov 17, 2013, 11:29:01 AM Execute Query Pole.MapServer
VERBOSE Nov 17, 2013, 11:29:00 AM Beginning of layer draw: Pole Pole.MapServer
FINE Nov 17, 2013, 11:29:00 AM Extent:1467314.863829,2191233.084700,2574598.328396,2702665.79038; Size:1574,727; Scale:2658831.00Pole.MapServer
VERBOSE Nov 17, 2013, 11:29:00 AM End of preparation. Pole.MapServer
VERBOSE Nov 17, 2013, 11:29:00 AM Begining of preparation. Pole.MapServer
FINE Nov 17, 2013, 11:29:00 AM Begin ExportMapImage Pole.MapServer
FINE Nov 17, 2013, 11:29:00 AM REST request received. Request size is 214 characters. Pole.MapServer
INFO Nov 17, 2013, 11:29:00 AM Request user: Anonymous user, Service: Pole/MapServer Rest
Analysis and findings
Let us start at the beginning, reading the logs from bottom to top; you will find that the first service to be requested is the Pole service at 11:29:00.
INFO Nov 17, 2013, 11:29:00 AM Request user: Anonymous user, Service: Pole/MapServer Rest
If you follow the log timeline, you will notice that the time stamp remains relatively the same up until the execution of the query, which takes a good 16 seconds to execute. A query that takes this long could mean one of two things: it is a complex query that takes a lot of time to parse and execute by the DBMS, or it is a simple query but returns a large set of results. Following are the two lines which marked the elapsed query:
VERBOSE Nov 17, 2013, 11:29:17 AM Symbolizing Pole.MapServer
VERBOSE Nov 17, 2013, 11:29:01 AM Execute Query Pole.MapServer
The query returns more than 6000 features. This is not normal for a simple request as 6000 features takes around half a minute to draw with symbology; plus, labeling this large set of features takes more than a minute.
VERBOSE Nov 17, 2013, 11:29:45 AM Number of features drawn: 6241 Pole.MapServer
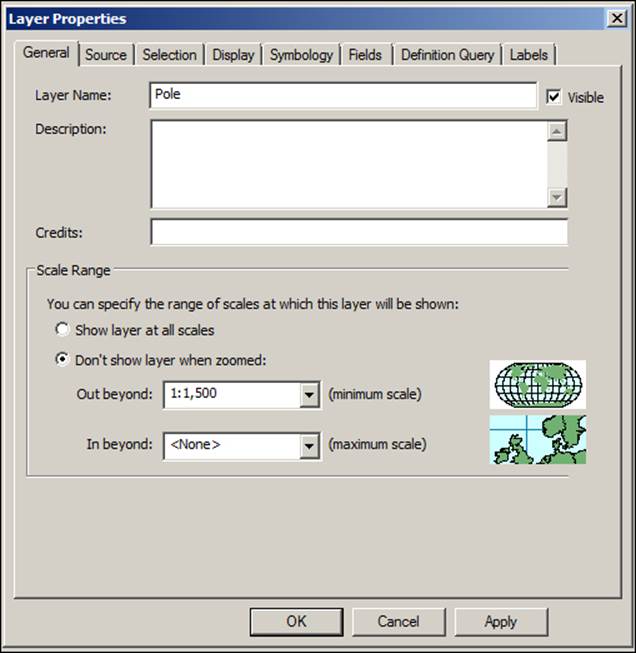
We managed to find the first bottleneck, and we now need to identify what caused it. The first thing we will investigate is the scale range of the pole layer. When we check the source document used to publish this service, we might find that this layer is set to draw at all scales. This is a problem because viewing the pole layer at a higher scale caused fetching the 6000 features, resulting in a performance penalty of 16 seconds. Look at the following screenshot, which describes how the pole layer is set to draw at all scales:

To solve this problem, we need to set a good scale for the pole layer. This should save around two minutes of both executing and drawing time. To set a scale for the pole layer, open Layer Properties in ArcMap. Then, select Don't Show layer when zoomed from the Scale Range box. Type 1500 in the Out beyond textbox, which makes this layer invisible beyond that scale.
If we continue reading the log, we will notice that the ServicePoint service doesn't take time to execute. However, it does take 14 seconds to draw only 10 features, which means that the symbology used for this layer is a complex one:
VERBOSE Nov 17, 2013, 11:31:15 AM Number of features drawn: 10 ServicePoint.MapServer
VERBOSE Nov 17, 2013, 11:31:01 AM Symbol Drawing ServicePoint.MapServer
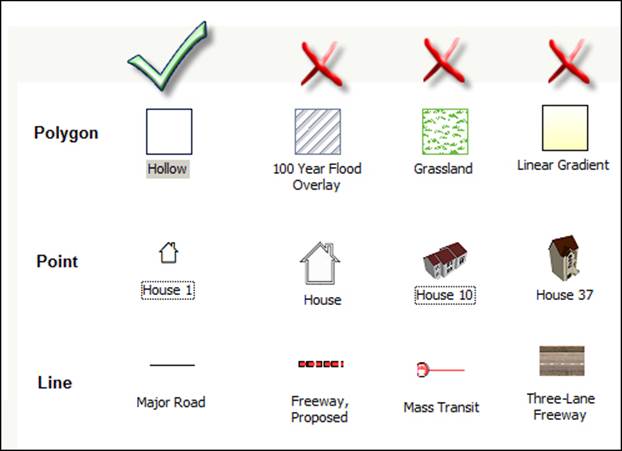
The following is an example of a complex symbology:

To fix this issue, we must use a much simpler symbology. Avoid using complex or multilayered symbols as they draw much slower. Use hollow symbols instead of filled or patterned ones. Hollow symbols do not need to be painted on the inside and significantly improve performance for larger sets of data. Also avoid using transparency in the symbols; this takes a lot of memory and graphics power to draw, thus slowing you down. If you have to use complex symbology, make sure to set a lower scale to the layer so you fetch fewer features. I have compiled the following diagram for general guidelines on the use of symbology:
Finally, we find that the PowerCable layer does execute and draw comfortably. However, it takes 10 seconds just to label a few features, and this means the labeling used for this layer is complex. This might be because of a special script labeling used to draw the labels concatenating multiple fields and values:
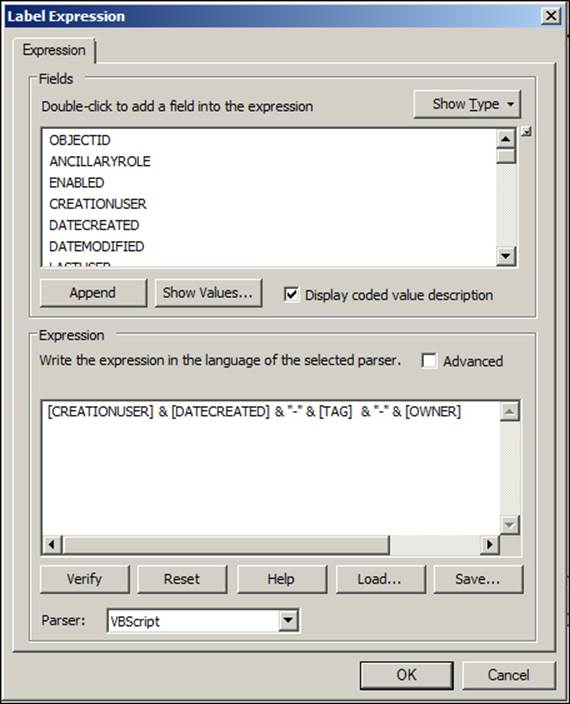
The simplest way to solve this is to use simple labeling or remove labeling all together. If labeling is essential on this layer, you might want to consider converting the layer to the annotation layer. This Esri resource describes how this can be done:http://bit.ly/1jvRIMx.
You have managed to identify and solve three problems that could potentially save three minutes of response time for the application, and this is all thanks to your skills at reading the logs.
Clearing Server logs
Clearing logs files is an important step that you need to carry out frequently on your Server. As logs pile up, Server struggles to update it. For instance, updating a 10-byte file is not like updating a 10-megabyte file. It takes I/O and latency, which affects the overall performance, especially if you are running on a fine level log. Here is how to clean the logs: from the ArcGIS for Server Manager window, activate the Logs tab and click on Delete Logs to clear all the logs from all GIS servers. You can also use the settings to set an expiry for the logs. However, it is recommended that you use severe mode in a production environment unless you are monitoring the system.
Summary
Server logs are a double-edged sword. You can use them to monitor your system effectively, but they can cause performance penalties if they pile up. In this chapter, you have learned the different levels of Server logs and how and which level you should configure your Server setup to. You also learned how to analyze the logs and extract useful information to optimize your services and detect a malfunction in one of your Server components, if any. In the coming appendix, you will learn some rules of thumb for selecting the right hardware for your ArcGIS for Server setup.
All materials on the site are licensed Creative Commons Attribution-Sharealike 3.0 Unported CC BY-SA 3.0 & GNU Free Documentation License (GFDL)
If you are the copyright holder of any material contained on our site and intend to remove it, please contact our site administrator for approval.
© 2016-2026 All site design rights belong to S.Y.A.