Big Data Bootcamp: What Managers Need to Know to Profit from the Big Data Revolution (2014)
Chapter 7. Doing a Big Data Project
Start with the End in Mind
When it comes to Big Data, it’s best, as the old saying goes, to start with the end in mind. With Big Data, it’s easy to get lost in the data or the implementation. The outcome you want to achieve and the business questions you want to answer are what matter most. So the best place to start in Big Data is not with the data itself, but rather with your business objectives and questions.
When setting up your Big Data project, you’ll want to:
· Define the outcome
· Identify the questions to answer
· Create policies around what data you use and how you use it
· Measure the value
· Identify the resources, including the people, data, hardware, and software, that you need to answer those questions
· Visualize the results
Define the Outcome
It’s all too easy to get lost in technology and data in the world of Big Data. That’s why it’s critical to define your desired business outcome at the start of any Big Data project. The most well-defined outcomes are highly measurable in terms of business value. Here are a few examples:
· Increase the Net Promoter Score (NPS), which is a frequently used measure of customer satisfaction, by three points within six months and then maintain that NPS score going forward.
· Increase sales of Product X by 10% in one week through higher advertising conversion rates.
· Reduce customer churn by 2% in two months by improving customer satisfaction.
· Increase high school graduation rates by 10% in three years.
· Decrease emergency responder response times by 30 seconds per response in one year.
· Achieve sub-second web site response time for initial application login in three months, and then continue to deliver sub-second response time at least 98% of the time.
· Gain sufficient funding for a new project by analyzing key sources of data and demonstrating a clear market need.
· Reach 100,000 active users for a new application within three months of launch.
· Increase user engagement on a web site by two minutes per day over the course of a six-month period, and then maintain that increased engagement rate for at least 75% of all active users.
Notice that many of these objectives define both an initial target and then an on-going target. This is important because a one-time improvement may be a lot easier than a sustainable improvement. Unless both objectives are identified, those responsible for the implementation might choose a short-term fix (such as adding memory to a single server) over a long-term fix (such as redesigning an application so that it can run on multiple servers).
If you’re not sure of the exact business metrics you want to achieve, but you know that you have a need, you might start with more general objectives, like the following:
· Create a real-time visualization of security attacks on corporate assets (both online and physical).
· Enable technicians to see attacks as they happen.
· Improve the speed with which technicians respond to security attacks.
A refined version of this objective would put specific numbers on the percentage of attacks successfully displayed in visual format, how long such data takes to appear in visual form, and how quickly technicians are able to respond. Such numbers would come after an analysis of current security attack rates and response times.
These are just a few of the many potential business objectives you could identify for your Big Data project. The more specific you can make your business objective, the easier it is to stay focused and achieve that objective in a timely manner. When you can put a value on the objective you want to achieve, it becomes that much easier to obtain necessary resources such as funding, people, and access to data sources.
Identify the Questions to Answer
Much like defining your outcome, you should also prepare a list of questions you want to answer. If you don’t have baseline metrics readily available, your first set of questions might involve some basic data gathering. For example:
· What is the average web page load time for the checkout page of our e-commerce web site?
· What is the best time? What is the worst time?
· What are the industry norms or best practices for web site response times?
· Are we above or below those numbers?
· If we achieve sub-second web site response time for the checkout page of our site, what increase in sales should we expect?
Once you have a baseline set of data, you then iterate on your question set, as follows:
· What products can we add to the mix of products on our home page in order to increase sales?
· Do certain product descriptions or images result in higher conversion rates?
· What kinds of recommendations to the customer are most effective in increasing basket size (the size of their ultimate purchase)?
These kinds of questions can only be answered through an iterative process of experimentation. By testing different approaches, featured products, product images, and other aspects of a site, you can learn what works best in producing the most relevant product offers for your potential customers—and the most sales for your business.
This approach applies to other Big Data areas as well. You might run comparison experiments to evaluate the impact on customer satisfaction of human responses to customer services inquiries versus automated email responses. There are lots of different ways to put Big Data to work, from building entirely new applications to visualizing what’s going on so you can make better decisions. The key is to take an explorative, discovery-oriented approach to your Big Data project. The faster you can iterate, the faster you can ask new questions based on what you learn from answering your previous set of questions.
Create Data Policies
It has been said that with great power comes great responsibility. Data provides enormous power and thus brings with it enormous responsibility.
When undertaking your Big Data project, it’s critical to define policies for your data use. Consider the value exchange between data collected and value delivered. If you give your customers better product recommendations and deals based on your data analytics, your customers are likely to thank you. But if you market baby products to your potential customers before they even know they’re pregnant, as one major retailer did, you will very likely find yourself on the wrong side of the data-value equation.
One good rule of thumb is to ask yourself two simple questions. First, would you want your own data used in the way you plan to use it? Second, is the way you’re planning to use the data you collect good for your customers? At a minimum, asking such questions at the outset of a Big Data project will start an important discussion about data use and policy.
In addition to data policy, you’ll want to consider the security of your data—both in motion and at rest. Data in motion is data that is moving from one location to another. When you enter your credit card number into a web page and your web browser sends that number to a server somewhere on the other side of the country, your important, personal financial data is set in motion.
While it’s traveling from your computer to the destination (such as an e-commerce site where you’re placing an order for that new set of headphones you’ve had your eye on), your credit card information is at risk. Hackers can potentially access it and use it for their own purposes. Now consider this risk multiplied millions of times—the movement of personal data from one place to another or the movement of medical records from one doctor’s office to another. If you’re working with data on a large scale, especially if that data contains personal information, considering both the policies around the use of that data and the approaches to securing that data is critically important.
Once the data arrives at its destination, the data is “at rest.” Such data is typically on-disk, stored in a server’s file system or a database, or in the memory of the computer that’s processing it. Which data needs to be encrypted and what approaches should be used for doing so are also important questions to answer. On the surface it seems like you might want to encrypt all data. In practice, encrypting and decrypting data is both time consuming and consumptive of valuable computer resources. As a result, the vast majority of data is not encrypted. These kinds of considerations become more and more important the larger the scale of data you’re working with and the bigger your company brand becomes. The company with the biggest brand is often the one most likely to suffer the consequences if a data breach occurs—just consider the recent exposure of tens of millions of credit card records from retailer Target. While there were other partners and vendors involved, Target itself suffered the most visible consequences.
Measure the Value
Business value can be measured in multiple ways. There is financial impact, of course, such as the amount of money saved by making a business process more efficient or the additional revenue generated from a successful marketing campaign. But you can measure the value of Big Data in other ways, such as its ability to promote innovation or support risk-taking in the development of new projects.
Assuming you’ve identified the key objectives for your project at the outset, it is then simply a matter of measuring those key metrics as your project proceeds and tying those metrics back to revenue or cost savings. For example, you can:
· Measure web site response time and see if there is a corresponding increase in sales, and if so, by how much.
· Compare one version of your home page with another version of it and determine which produces the best results. You can then look at the percentage or dollar value increase in sales and measure the impact of your changes.
· Evaluate the customer satisfaction levels of your customers, reduce the amount of time it takes to respond to service requests, and then re-evaluate customer satisfaction levels. If you know how much a certain increase in customer satisfaction reduces customer churn, and what an average customer is worth to you, you can measure the business value of reducing customer support response times.
The keys to measuring the value are incorporating on-going measurement tools and having financial or other metrics you can tie those measurements back to. On-going measurement is critical because any measurement you take only once might not actually be representative of what’s really going on. Bad decisions could result. By taking regular measurements, you can see how the results change over time—which makes it easier to recognize any potentially invalid data as well as to make sure you’re headed in the right direction.
Identify Resources
Beyond human capital, you need three kinds of resources for your Big Data project:
· Sensors for collecting the data
· The data itself
· The necessary tools to analyze the data and gain actionable insights
Many kinds of hardware and software generate and collect data. Global Positioning System (GPS) watches record location and elevation data, and by connecting to other devices, they also collect heart rate and cadence information. Airplane engines generate data about fuel consumption and engine performance, which is collected using software. Meanwhile, mobile phones generate many data points every second, from call signal strength to power consumption.
Mobile phones don’t just generate data about themselves, they can also gather data, such as a user’s location. With the right software and hardware, they can also monitor heart rate, sleep patterns, and a wide variety of other health information, such as EKG data and blood sugar levels. This can help people improve their day-to-day health and also provide lower-cost measurement alternatives for diabetics and other patients.
In many cases, you don’t need to search far to find the data you need. Lots of data already exists, such as call center, billing, customer service, and product usage data. Marketing companies have data about marketing spend, sales, and margins. Human resource organizations have data in the form of resumes, retention length, employee ratings, and compensation.
The data you want to work with often isn’t in the form you need it. For example, call centers or sales department may record calls for quality assurance or training purposes, but making sense of that data is hard when it remains in audio form. By converting these recordings into text form, organizations can then analyze the text and discover trends and insights to which they would not otherwise have had access.
![]() Note Data comes in many forms. It can be data from your server logs or email inquiries, or it might be data picked up by sensors—think of a heart monitor or a new car’s ability to monitor and store all manner of electrical, mechanical, or driver data. The common need, however, is the ability to capture data from such sources and use it to spot trends or uncover insights about customers that lead to new products or better service.
Note Data comes in many forms. It can be data from your server logs or email inquiries, or it might be data picked up by sensors—think of a heart monitor or a new car’s ability to monitor and store all manner of electrical, mechanical, or driver data. The common need, however, is the ability to capture data from such sources and use it to spot trends or uncover insights about customers that lead to new products or better service.
Similarly, web applications may have lots of data, but that data can be difficult to unlock without the right tools. For example, if your web site is performing slowly, you want to find the root cause of that performance slowdown. The right software can log a stream of data points about web site performance as well as about sources of potential underlying performance bottlenecks such as databases and servers.
A frequent stumbling block for organizations brainstorming new Big Data projects is the question of how to get the data. Quite often, projects that might otherwise lead to meaningful insights are stopped before they start. For example, a mobile application developer might want to build an application to reduce food waste by alerting people to grocery purchases that they consume—and those that are thrown away unused.
The financial savings from such an application have the potential to be enormous while the societal impact could be profoundly positive, with less food being wasted and more going to those in need. Yet how would the application developer get access to the necessary consumer grocery purchase data and to data about which products the consumer uses versus throws away?
It would be all too easy to get stopped by such questions. But the value to be gained may more than justify the investment required to access and analyze such data and to build a compelling mobile application that consumers would love to adopt. By starting with a focus on the business value rather than on the data itself, it becomes far easier to achieve your Big Data project goals.
Regardless of what data you choose to work with, you’ll need to store that data somewhere so that you can analyze it, either locally or in the cloud. If your company has existing Information Technology (IT) resources, you may be able to get the servers, storage, and processing capabilities you need internally. However, IT departments are often busy with other tasks. In such cases, or if you’re not sure up-front how much data you’ll need to store or how much analytics processing you’ll be doing, storing and analyzing your data in the cloud makes more sense.
Your choice of technology also depends on whether you’re working with structured or unstructured data. Traditional databases may be more than adequate for storing contact information, billing records, and other well-structured information. Although unstructured data, like web pages and text files, can be stored directly on-disk, when it comes to working with such data at scale, more sophisticated technologies are required. This is where technologies like Hadoop and MapReduce come into play.
No matter how much data you crunch, at the end of the day, you’ll need to make your analysis accessible and actionable. This is where visualization products come in. Offerings from companies like Tableau Software and QlikTech make it easy to take vast amounts of data and create compelling interactive visualizations.
Visualize the Results
Putting your analysis into visual form is one of the most effective ways to make your Big Data project actionable. Often when people think about Big Data, they think about indecipherable spreadsheets or the streams of 1s and 0s flowing down the screen in The Matrix. Visualization turns all those 1s and 0s into a clear picture that anyone can understand. It makes the unapproachable approachable.
It may seem like a lot of different capabilities are required to work with Big Data. Yet working with Big Data really comes down to just three things: sensors, data, and software.
To make things even simpler, new Big Data Applications (BDAs) are emerging that take all of the pieces—collecting the data, storing the data and presenting the data—and put them together into easy-to-use applications. In many cases, these BDAs run in the cloud and are delivered over the Internet, meaning you don’t need to buy any hardware or install any software to get your Big Data project started. The Big Data Landscape (http://www.bigdatalandscape.com/) highlights some of the companies whose offerings you may want to look at depending on your area. Examples include cloud-based Big Data offerings from companies like AppDynamics, CartoDB, and New Relic, to name just a few.
In many cases, even if you have what may seem like a custom Big Data problem on your hands, it is well worth looking for a Big Data Application before deciding to build your own. There are BDAs that do everything from web site performance analysis to fleet management, many of which can be customized to meet your specific requirements.
Case Study: Churn Reduction
Over the next seven years, the market for Big Data technology in the telecommunications sector is expected to grow some 400%, according to industry analyst Ari Banerjee at Heavy Reading. That’s1 not surprising given the tremendous amount of data that telecommunications companies work with. From mobile phones to Internet connections, from call centers to data centers, telecommunications companies work with a lot of data. Network data, service data, and subscriber data are just a few of the many data sources that telecommunications companies work with.
The Big Data use cases in telecommunications are numerous. They include:
· Churn management
· Customer experience management
· Handset analysis
· Roaming management
· Revenue management
· Interconnect billing verification
· Content settlement assurance
· Fleet routing management
· E-commerce
Each of these areas presents a tremendous Big Data opportunity for today’s telecommunications companies, an opportunity not just to analyze data for data’s sake but to serve their customers better.
For example, analysis of handset performance can lead to longer battery life and higher reliability. It can also enable call center operators to troubleshoot customer issues. With the right data, rather than relying on a customer to describe a perceived problem, a call center operator can easily determine whether a problem is in a customer’s handset or tablet, in one of the applications installed on the customer’s phone, or in the network itself.
Big Data Workflow
To analyze the data and determine which actions to take, I will use the following five-step workflow (see Figure 7-1), which includes creating a business hypothesis, setting up the necessary systems, transforming the data, analyzing and visualizing the data, and acting on the results.

Figure 7-1. The Big Data workflow
The example we’ll cover in detail here is churn management. Churn is a challenge for nearly every company. No matter the size of your business, losing a customer—having a customer “churn out”—is an expensive event. In most cases, it’s more cost effective to keep a customer than add a new one.
To reduce churn, it’s important to predict which customers are going to churn and execute proactive retention campaigns to keep them. In this example, we’ll use two technologies for the analysis—a data-cleansing tool and Hadoop MapReduce for storing and analyzing the data.
Step 1: Create a Hypothesis
One way to predict which users are going to churn is through behavioral analysis. With this approach, we try to find correlations between demographics, usage locations, call experience, and consumer behavior. By modeling which of these data points consistently occur together, we can predict customers who are likely to stay and those who are likely to churn out.
Our hypothesis is that subscribers who experience high rates of dropped calls are more likely to leave our service.
If our hypothesis proves to be true, we can then find all customers who experience high rates of dropped calls and take action to improve their experience.
For example, we could determine where large numbers of customers with dropped calls are geographically located. With that information, we could then investigate the root cause of the dropped calls. A high rate of dropped calls could be due to a faulty piece of network equipment that needs to be replaced. Or, our network might be overcapacity in certain areas and we could then add more towers or network bandwidth in those areas to reduce dropped call rates.
For customers who are experiencing a high volume of dropped calls but are not grouped with a large volume of other customers, we could determine if a different root cause is the issue, such as a problem with a particular customer’s mobile phone or installed applications that are causing that customer’s device to drop calls.
Step 2: Set Up the Systems
The first step is to gather the relevant data sources. In this example, we have two important data sources we need to work with: Call Detail Records (CDRs) and subscriber details. CDRs are typically stored in raw log files that are not cleanly structured for analysis.
Here is an example of a CDR, showing a user calling into a voicemail system2:
"""Console"" <2565551212>","2565551212","*98","UserServices","Console/dsp","",
"VoiceMailMain","@shifteight.org","2010-08-16 01:08:44","2010-08-16 01:08:44”,"2010-08-16 01:08:53","9","9","ANSWERED","DOCUMENTATION","","1281935324.0","",0
The challenge for the data analyst is that call records are raw log files that are not cleanly structured for visualization. When it comes to Big Data, this is a common problem. According to one source, 80% of the work in any Big Data project is cleaning the data.3
While we could easily analyze a few call records on a single computer, we need data from millions of call records to run our analysis. To do that, we’ll first set up a Hadoop cluster.
To set up a Hadoop cluster, we’ll need a set of servers—either existing or new—for the cluster and the necessary operating system and Hadoop software to run on those servers. We have two options for our Hadoop cluster: we can perform the setup and configuration on servers in an in-house, on-premise data center or we can use Hadoop resources available in a public cloud such as Amazon Elastic MapReduce (EMR).
In this case, because the data we want to work with is already in our on-premise data center, we’ll set up our own Hadoop cluster in-house. (For Big Data Applications where data is already stored in a public cloud, such a clickstream analysis for a web site, it makes more sense to perform the data processing jobs in the cloud.)
Setting up a Hadoop cluster simply means installing the necessary operating system software on the servers, typically some form of Linux. We’ll install the necessary Hadoop-related software and its Java dependencies. And we’ll use a standardized deployment tool (such as Puppet) to automate the installation and setup of these software pieces so that it’s easy to spin up additional servers as we need them.
Once we have this set up, we’ll load the call records into Hadoop (assuming they were not stored there originally) and we’ll be ready to run our data transformation.
Step 3: Transform the Data
Before we can analyze our data, we have to define and run a set of data transformations to get the data into a form we can analyze.
Transformations take the semi-structured data in the call records and turn them into a form that we can examine and make decisions about. Historically, data analysts have created such transformations by writing scripts in a painstaking, manual process. However, new tools are available that enable the analyst to view raw data in an easy-to-use interface and give the tools examples of the kinds of transformations that need to be done. In this case, we’ll use a tool that uses the examples that we provide, along with machine learning, to generate the necessary transformation scripts automatically. In this particular case, once users give the tool some initial examples of how to convert one data format into another, the tool can recognize similar types of data that need to be converted automatically. Over time, as the tool builds up more rules and more patterns it can recognize, it becomes easier for the software to make the necessary transformations without human intervention.
For example, one transformation involves removing data that is not relevant to our analysis. In telco systems, both text messages and calls typically result in call records. So in the case of call records, that means taking out the text messages so that we can analyze just the relevant data, that is, the records related to actual calls.
A second transformation involves combining the subscriber data with call record data so that we can view correlations between dropped calls and various subscriber attributes such as geographic location.
The Hadoop Distributed File System (HDFS) stores all of the relevant data while MapReduce executes the necessary transformations on the data. What makes MapReduce so powerful is that it takes huge volumes of data, in this case the call records, and splits that data into smaller chunks that can be processed in parallel. As a result, by adding more servers to the cluster, we can increase processing speed and reduce the amount of time it takes to transform the data into a form we can analyze.
Step 4: Analyze the Data
Once the data transformation step is done, we can analyze the data to see if our hypothesis is correct. In this example, we created a dashboard view of the data in a popular visualization tool called Tableau (see Figure 7-2). (Many other visualization tools are available, including software from companies like QlikTech and MicroStrategy.)
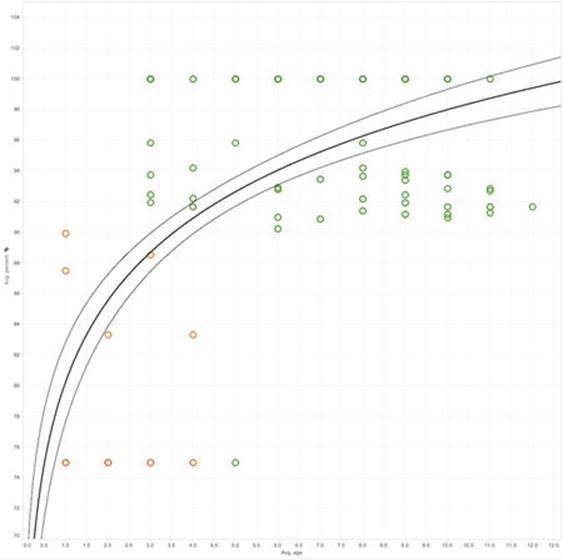
Figure 7-2. Visualizing the correlation between dropped calls and subscriber churn. (Courtesy of Tableau Software and Trifacta; used with permission)
Visualization is one of the most powerful ways to analyze data. Not only do our eyes provide the highest bandwidth data transfer to our brains of all of our senses, but data shown visually is simply easier to interpret than rows upon rows of spreadsheets or databases. Often, massive amounts of data can be converted into simple charts that make it easy to draw powerful conclusions.
![]() Note Our own eyes provide the highest-bandwidth data transfer to our brains compared to all our other senses. That’s why data visualization is such an important part of a Big Data project. It provides actionable information the fastest.
Note Our own eyes provide the highest-bandwidth data transfer to our brains compared to all our other senses. That’s why data visualization is such an important part of a Big Data project. It provides actionable information the fastest.
Figure 7-2 shows that customers with higher successful call completion rates remain subscribers longer than those with more dropped calls. As a result, we can conclude that there is a correlation between higher dropped call rates and higher subscriber churn.
It’s important to keep in mind that there could be other factors at work that are causing our customers to churn out that we haven’t yet evaluated. These factors could include unattractive pricing, poor customer service, or strong marketing campaigns from our competitors. We’ll want to explore these factors in future analyses. Our initial analysis also brings up additional questions. We’ll want to dig into the root cause of the dropped calls—is it an issue with the devices, the network, or something else altogether?
This is the compelling nature of Big Data. We start with an initial hypothesis and a set of questions to answer, analyze the data, and then develop new hypotheses and questions to answer. Because we can analyze large quantities of data quickly with tools like Hadoop and MapReduce, we can take a much more iterative and exploratory approach to our data.
Step 5: Act on the Data
Now that we’ve analyzed our data and reached some conclusions, it’s time to act on our conclusions. Here again a hypothesis-driven approach is the way to go. In this case, after exploring the root cause of dropped calls in particular areas, we discover that the cause is a dramatic increase in the number of callers in certain geographic areas, resulting in higher than expected network usage.
Our proposal to management is a two-pronged approach. The first step is to add call towers and network capacity in the affected areas. The second step is to implement a marketing program to let potential customers know about the improvements.
Part of our marketing program will be an email campaign targeting previous subscribers who churned out with an offer to come back and news about the increased network capacity in their area. The other part of our marketing program is a billboard-based campaign to tell potential new subscribers about the increased network capacity in their area.
In both cases, we can use data to implement the most effective campaigns possible. For example, in the case of the email campaign, we can try multiple different email campaigns, such as different wording and offers, to determine which campaign is most effective. Of course, we’ll use all the techniques we’ve learned so far about Big Data when we implement those campaigns. We’ll take a look at effective Big Data approaches to marketing analytics in the very next section.
Case Study: Marketing Analytics
So that we can explore other markets, we’ll continue our Big Data project by switching to the area of e-commerce. Regardless of the market, however, many of the same principles apply.
In this example, an e-commerce company wants to predict the performance of a new product launch they are about to do and ensure the highest conversion rates and sales possible once the launch is underway. Of course, the scenario could apply equally well to the launch of a new mobile device for a telecommunications company or a new web site service for a technology company. In this case, an online retailer is launching a new women’s clothing line for the summer.
The campaign is scheduled to launch in just one week and the retailer wants to test the marketing campaign and see which products will be best sellers. By doing so, they can better prepare and optimize inventory and distribution.
At the same time, the retailer wants to evaluate the effectiveness of different email campaigns. To do this, they send different emails to 10% of their customers over the week to see which emails produce the highest conversion rates; their challenge is monitoring the campaign results in real time.
Before starting the study, the retailer defines a set of key questions to answer. These include:
· Which products will be the top sellers?
· Which email campaigns resulted in the most sales?
· Can we optimize the web site to improve conversion rates?
The marketing team faces a number of challenges. The team has only one week to test the launch in its chosen test market. They want to iterate quickly, but existing Business Intelligence (BI) systems only provide daily reports. This speed is not fast enough for the marketing team to make changes and test the results given the time they have available before the full launch. The team wants to be able to iterate several times a day to make the most of the time available.
With Big Data, these challenges are easily overcome. Unlike the on-premise Hadoop-based solution that we looked at in the case of churn reduction, in this case we’re going to look at a leading edge cloud-based Big Data approach that requires no hardware or software setup. That means that team doesn’t need to purchase or configure local servers, storage systems, or software. All the necessary capabilities are available over the Internet via the cloud.
What’s more, with this approach, there’s no batch-driven processing as in the Hadoop-based approach. With this cloud-based Big Data approach, the retailer can get real-time reports, immediate insight into the correlation between different email campaigns and consumer purchase behavior, and the ability to test the effectiveness of web site changes and a variety of different banner ads.
Big Data Meets the Cloud
How does this work? A variety of marketing analytics products are available. In this case study, we explore the use of New Relic Insights, a relatively new offering for analyzing streams of online marketing data and getting real-time insights.
By way of context, products such as New Relic, AppDynamics, and others have traditionally focused on the Application Performance Monitoring (APM) market. That is the on-going measurement and analysis of bottlenecks in web site and enterprise application performance.
These products are the cloud-based alternatives to products historically offered by enterprise vendors such as Computer Associates, BMC, and others. More recently, these cloud-based solutions have expanded their platforms to offer a broader set of Big Data capabilities, such as marketing analytics. They leverage the same core capabilities that have allowed them to stream in, store, and analyze immense quantities of web site performance data to provide insight into other business areas.
This cloud-based approach to computing was pioneered by the “no software” company Salesforce.com. Salesforce.com took a cloud-based approach to Customer Relationship Management (CRM), which had traditionally only been available as part of expensive, custom on-premise software implementations from vendors like Siebel Systems (now Oracle).
There are some tradeoffs with this approach. In particular, your data is stored on a vendor’s computer systems rather than on your own. But in reality, vendors like Salesforce.com have architected their systems to manage the data of thousands and thousands of customers reliably and securely. And because their services are available in the cloud, there’s no expensive up-front investment or time-consuming setup. The vendor handles all the software configuration and maintenance so that you can focus on getting the results you need.
With the cloud-based approach to Big Data there are just three steps in the workflow (see Figure 7-3).

Figure 7-3. The Big Data cloud workflow
Step 1: Gather the Data
To accomplish its goals, the marketing team in this case study simply needs to add a few lines of JavaScript to the company’s existing web pages, and the data to analyze campaign performance is uploaded to the third-party, cloud-based application. From there, members of the marketing and merchandizing teams can all log in and see the results.
The cloud vendor deals with the complexities of infrastructure, data capture, and report generation, while the retailer can stay focused on delivering the best results possible from its new product launch.
Step 2: Analyze the Results
In this example, the retailer is trying three different email campaigns to see which one is most effective. Each email campaign has different messaging and offers. The retailer can view product purchases by email campaign in real time using easy-to-create web-based dashboards, as shown inFigure 7-4.
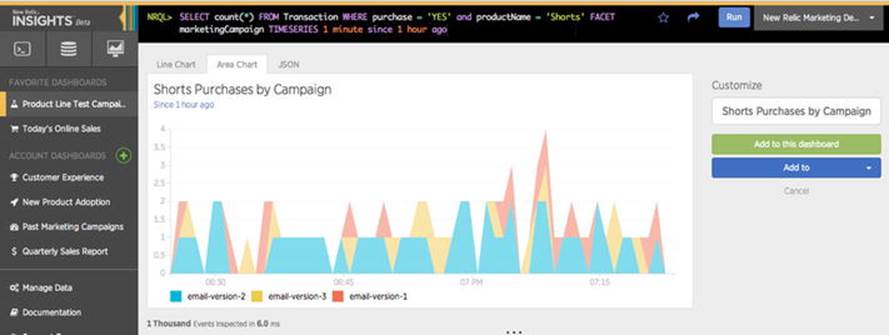
Figure 7-4. Purchase behavior based on different email campaigns. (Courtesy of New Relic; used with permission)
The retailer can also create more advanced, custom queries. Traditionally, only database administrators and data analysts have had the knowledge and skills to create queries directly on data and turn the results of those queries into meaningful reports.
New tools provide easy-to-access query capabilities that allow marketers to query data directly and turn those results into actionable charts easily. In Figure 7-5, marketers at the e-commerce site have entered SQL-like queries directly into the web interface to evaluate the performance of different banner ads.
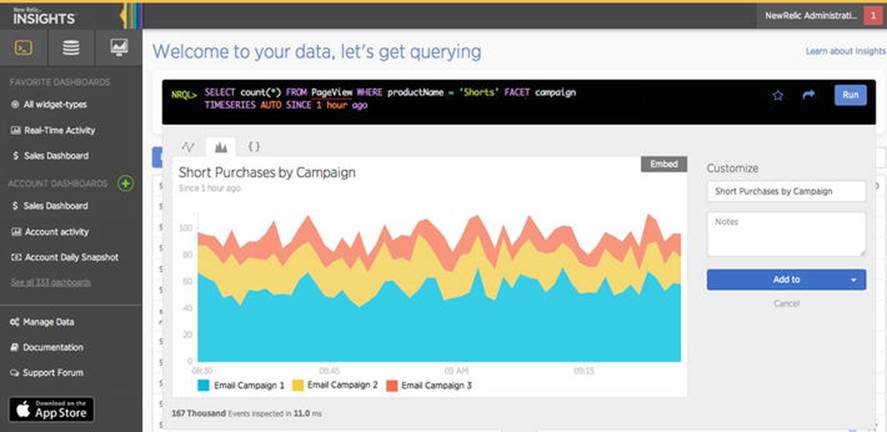
Figure 7-5. Visualizing the impact of different banner ads on product purchase behavior. (Courtesy of New Relic; used with permission)
In this instance, the retailer is comparing the purchase behavior of consumers in response to two different banner ad approaches.
Step 3: Iterate
Once the test phase is complete, the retailer can continue to iterate and optimize the actual launch. For example, the retailer can test and optimize specific parts of its web site to improve engagement and conversion rates in real time using A/B testing.
With A/B testing, the different combinations of buttons, colors, fonts, and other web sites elements are shown to each visitor to the site. The optimization software automatically figures out which combination produces the highest conversion rates based on pre-defined goals, such as visitors clicking on a “register now” link or completing a purchase.
In this case, the retailer can use web-based Big Data tools such as Optimizely or Google Site Analyzer to try different versions of key pages on its web site to see which combination of content, products, offers, fonts, and colors produce the best conversion results.
But the changes don’t stop there. The retailer can even build functionality directly into its web site that uses the output of the cloud-based analytics tool to change application behavior. For example, the site could be designed to promote particular products on the home page that are not selling as well as they should be. The site could also kick off email campaigns to promote certain products automatically or provide special offers at checkout.
A cloud-based approach to your Big Data project can make a lot of sense, especially for sales and marketing-related analytics. There’s no expensive up-front investment required and no on-going maintenance. Continuous iteration is fast and easy.
Case Study: The Connected Car
We’ll conclude this chapter on Big Data projects by looking at the way one company opened up access to a valuable yet previously closed data source—car data.
Cars may not seem like a huge source of data, but they are. In fact, our cars generate immense amounts of data not just about themselves but also about us as drivers. Ford wanted to understand the differences in driving behavior between drivers of gas and electric powered vehicles.
However, there were a number of challenges the company had to overcome to make analysis of car data possible. In particular, car data is typically difficult to access. A car may have a lot of data, but unlike a phone or a computer, there typically aren’t any well-defined interfaces for software developers and business analysts to access that data.
Imagine that you wanted to build a mobile application to analyze your driving habits and help you drive most efficiently to conserve fuel/power while still getting you to your destination in time. How would you connect the app you built for your phone to your car?
Could you get the data in real time from the vehicle or would you need to download chunks of data after your drive? And how much data does a car generate? Is it so much that it would swamp the processing and storage capabilities of a mobile phone? If so, you might need to first send the data to a set of cloud servers for storage and analysis, and then download the results to your mobile application.
Yet if you could overcome these challenges, the benefits would be enormous. Car companies could improve engine efficiency by better understanding consumer driving habits, while drivers could change their driving habits to save gas while still getting where they want to go. What’s more, if a manufacturer made it easy to access car data, software developers could create innovative applications for cars that no one has even thought of yet.
The single biggest challenge in the case of the connected car, however, was making it possible for developers to access the data. Ford developed the OpenXC interface, which is essentially an application programming interface (API) for car data. OpenXC makes it possible for developers to access car data in a standardized, well-defined way.
So instead of the application developers having to focus on how to get the data, they can focus on building innovative applications. Ford benefits because it gains insight into driver behavior as well as exciting new applications built for its cars. Consumers benefit because they can learn more about their own driving habits and take advantage of applications that can save them money or shorten their drive time.
Figure 7-6 shows one example of the kind of data that the OpenXC interface made available for a driving test, in this case a comparison of the driving habits of three different drivers. This is just one of the many kinds of data available via the OpenXC interface.
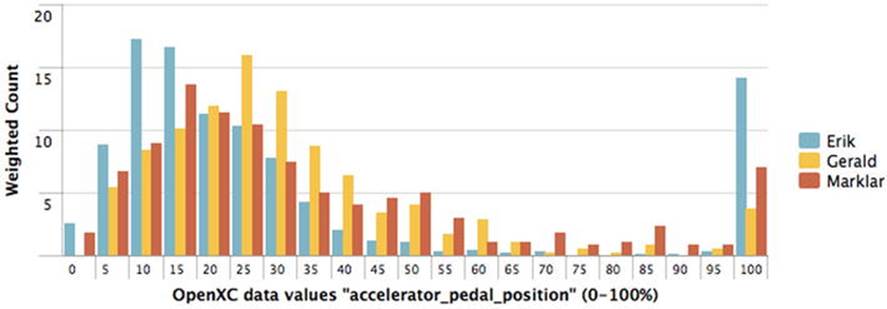
Figure 7-6. A comparison of the driving habits of multiple drivers. (Courtesy of Splunk; used with permission)
The key takeaway from the Connected Car example is that by opening up data access to their platforms, companies can create powerful ecosystems for innovation. In the case of the connected car, that means new applications that can help both consumers and manufacturers. Many other industries can also benefit from providing standardized interfaces to the data their systems produce.
Providing standardized access does not mean that anyone can access anyone else’s data. Rather, it makes it much easier for developers to build innovative applications that can analyze data from all different kinds of systems, from medical devices to weather reporting stations.
In Short . . .
By combining the right tools, resources, and policies, you have the opportunity to gain incredible insights and unlock significant customer value using Big Data. Getting a Big Data project started need not be time-consuming or expensive. It can be a rapid, highly iterative undertaking that has the potential to deliver happier customers and unlock incredible value as a result.
____________________
1http://www.lightreading.com/spit-(service-provider-it)/analytics-big-data/telco-big-data-market-to-thrive/d/d-id/707393
2http://www.asteriskdocs.org/en/3rd_Edition/asterisk-book-html-chunk/asterisk-SysAdmin-SECT-1.html
3http://radar.oreilly.com/2012/07/data-jujitsu.html
All materials on the site are licensed Creative Commons Attribution-Sharealike 3.0 Unported CC BY-SA 3.0 & GNU Free Documentation License (GFDL)
If you are the copyright holder of any material contained on our site and intend to remove it, please contact our site administrator for approval.
© 2016-2026 All site design rights belong to S.Y.A.