Megan Squire (2015)
Chapter 9. Stack Overflow Project
This is the first of two full, chapter-length projects where we will put everything we have learned about data cleaning into practice. We can think of each project as a dinner party where we show off our best skills from our data science kitchen. To host a successful dinner party, we should of course have our menu and guest list planned in advance. However, the mark of a true expert is how we react when things do not go exactly according to plan. We have all had that moment when we forget to buy an important ingredient, despite our carefully prepared recipes and shopping lists. Will we be able to adjust our plan to meet the new challenges we meet along the way?
In this chapter, we will tackle some data cleaning using the publicly-released Stack Overflow database dump. Stack Overflow is part of the Stack Exchange family of question-and-answer websites. On these sites, writing good questions and answers can earn a user points and badges that accumulate over time. To practice our data cleaning skills, we will use the same six-step method we introduced back in Chapter 1, Why Do You Need Clean Data?.
· Decide what kind of problem we are trying to solve — why are we looking at this data?
· Collect and store our data, which consists of downloading and extracting the data dump provided by Stack Overflow, creating a MySQL database to hold the data, and writing scripts to import the data into the MySQL database. Because the Stack Overflow dataset is so massive, we will also create some smaller test tables, filled with randomly selected rows.
· Perform some trial cleaning tasks on the test tables before attempting to clean the entire dataset.
· Analyze the data. Do we need to perform any calculations? Should we write some aggregate functions to count or sum the data? Do we need to transform the data in some way?
· Provide visualizations of the data, if possible.
· Resolve the problem we set out to investigate. Did our process work? Were we successful?
That is a lot of work, but the more we prepare in advance and the earlier we start, the more likely we will be able to call our data science dinner party a success.
Step one – posing a question about Stack Overflow
To start our project, we need to pose a reasonably interesting question that requires some simple data analysis to answer. Where should we begin? First, let's review what we know about Stack Overflow. We know that it is a question-and-answer website for programmers, and we can assume that programmers probably use a lot of source code, error logs, and configuration files in the questions they are asking and answering. Furthermore, we know that sometimes posting these kinds of long text dumps on a web-based platform like Stack Overflow can be awkward because of line lengths, formatting, and other readability issues.
Seeing so many questions and answers with frustratingly large amounts of text made me wonder whether programmers on Stack Overflow ever link to their code or log files through an external paste site such as Pastebin or JSFiddle, for example http://www.Pastebin.com is a website where you can paste in large amounts of text, such as source code or a log file, and the site gives you back a short URL that you can share with others. Most paste sites also allow for source code syntax highlighting, which Stack Overflow does not do by default.
Using paste sites is very common on IRC and e-mail, but what about on Stack Overflow? On one hand, just like in IRC or e-mail, providing a link could make a question or an answer shorter, and therefore the rest of the question is much easier to read. But on the other hand, depending on the paste site being used, the URL is not guaranteed to be functional forever. This means that a question or an answer could lose its value over time due to link rot.
Tools like JSFiddle complicate this issue in one additional way. On an interactive paste site like JSFiddle, not only can you paste in your source code and get a URL for it, but you can also allow others to edit and run the code right in the browser. This could be extremely helpful in a question-and-answer scenario on Stack Overflow, especially in a browser-based language like JavaScript. However, the issue of link rot still exists. Additionally, JSFiddle is a little trickier to use for beginners than a simple code dump site like Pastebin.
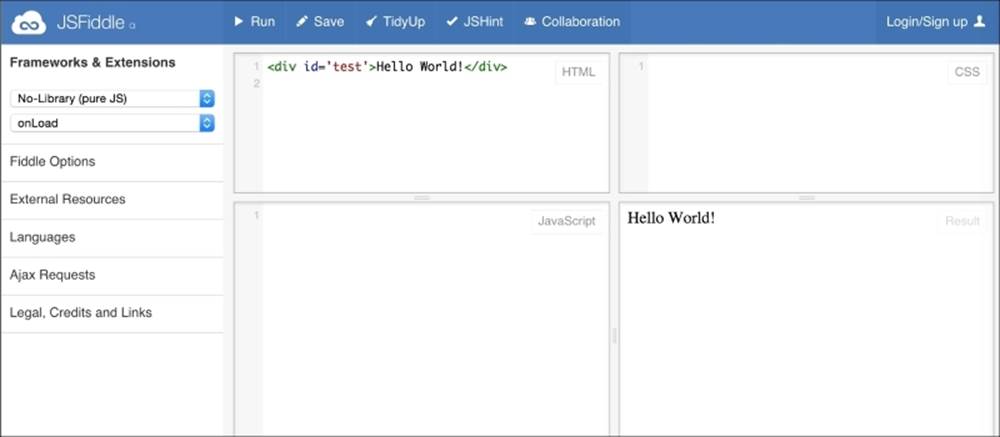
JSFiddle has four windows, one each for HTML, CSS, JavaScript, and the result.
Note
In the community discussion area for Stack Overflow, there has been quite a bit of debate about whether paste sites should be used at all, and what the policy should be for questions or answers that include paste site links and no actual code. In general, even though people tend to agree that a paste site can be useful, they also recognize that it is important to protect the longevity and utility of Stack Overflow itself. The community has decided that posting questions or answers with only links and no code should be avoided. A good place to start if you want to recap that discussion is this link: http://meta.stackexchange.com/questions/149890/.
For our purposes here, we do not need to choose sides in this debate. Instead, we can just ask some simple data-driven questions like:
1. How frequently do people use tools like Pastebin and JSFiddle (and other similar paste sites) on Stack Overflow?
2. Do they use paste sites more in questions or in answers?
3. Do posts that reference a paste site URL tend to also include source code; if so, how much?
We can use these questions for our motivation as we collect, store, and clean our Stack Overflow data. Even if it turns out that some of these questions are too hard or impossible to answer, remembering what our overall purpose is will help direct the type of cleaning we need to do. Keeping our questions in the forefront of our minds will stop us from getting too far off track or performing tasks that will turn out to be pointless or a waste of time.
Step two – collecting and storing the Stack Overflow data
At the time of writing, Stack Exchange provides the data for their entire family of websites—including Stack Overflow—as XML files free for anyone to download. In this section, we will download the Stack Overflow files, and import the data into a database on our MySQL server. Finally, we will create a few smaller versions of these tables for testing purposes.
Downloading the Stack Overflow data dump
All the data available from Stack Exchange can be downloaded at the Internet Archive. The September 2014 dump is the latest one available at the time of writing. Each Stack Exchange site has one or more files for it, each of which is linked to this details page:https://archive.org/details/stackexchange.
We are only interested in the eight Stack Overflow files that appear alphabetically as shown in the following list:
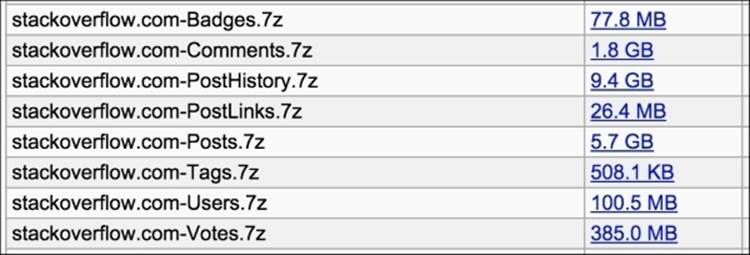
Archive.org listing showing the eight Stack Overflow files we are interested in.
For each file in the list, right-click the link and direct your browser to save the file to disk.
Unarchiving the files
Notice that each file has a .7z extension. This is a compressed archive format. It can be uncompressed and unarchived using the matching 7-Zip software, or another compatible software package. 7-Zip was not one of the more common file archivers that we discussed in Chapter 2,Fundamentals – Formats, Types, and Encodings and you may not already have a compatible unarchiver installed on your computer, so we can consider this our first small wrinkle that we need to work around. Try double-clicking on the file to open it, but if you have no installed software associated with the .7z extension, you will need to install an appropriate 7-Zip unarchiver.
· For Windows, you can download the 7-Zip software from their website: http://www.7-zip.org
· For Mac OS X, you can download and install The Unarchiver, a no-cost utility available at http://unarchiver.c3.cx
Once you have the software installed, unpack each file in turn. The uncompressed files are quite large, so make sure you have disk space that is large enough to hold them.
Tip
On my system right now, comparing the compressed to uncompressed file sizes shows that the uncompressed versions are about ten times larger than the compressed versions. These files also take several minutes each to unarchive, depending on the specifications of the system you are working on, so set aside time for this step.
Creating MySQL tables and loading data
We now have eight .xml files, each of which will map to one table in the database we are about to build. To create the database and tables, we could either point and click our way through it using phpMyAdmin or some other graphical tool, or we can run the following simple SQL written by Georgios Gousios and available at https://gist.github.com/gousiosg/7600626. This code includes CREATE and LOAD INFILE statements for the first six tables, but since this script was written, the database dump has had two additional tables added to it.
To build the new table structure, we can run the head command in our Terminal window or shell in order to inspect the first few lines of this file. From Terminal, run it on the smallest of the XML files, PostLinks.xml, as follows:
head PostLinks.xml
The first four lines from the results are shown here:
<?xml version="1.0" encoding="utf-8"?>
<postlinks>
<row Id="19" CreationDate="2010-04-26T02:59:48.130" PostId="109" RelatedPostId="32412" LinkTypeId="1" />
<row Id="37" CreationDate="2010-04-26T02:59:48.600" PostId="1970" RelatedPostId="617600" LinkTypeId="1" />
Each row in our new database table should correspond to one of the XML <row> lines, and each attribute shown in the row line represents one column in the database table. We can perform the same head command on the Tags.xml file to see what its columns should be. The following SQL code will handle the CREATE statements and the LOAD statements for the two additional tables:
CREATE TABLE post_links (
Id INT NOT NULL PRIMARY KEY,
CreationDate DATETIME DEFAULT NULL,
PostId INT NOT NULL,
RelatedPostId INT NOT NULL,
LinkTypeId INT DEFAULT NULL
);
CREATE TABLE tags (
Id INT NOT NULL PRIMARY KEY,
TagName VARCHAR(50) DEFAULT NULL,
Count INT DEFAULT NULL,
ExcerptPostId INT DEFAULT NULL,
WikiPostId INT DEFAULT NULL
);
LOAD XML LOCAL INFILE 'PostLinks.xml'
INTO TABLE post_links
ROWS IDENTIFIED BY '<row>';
LOAD XML LOCAL INFILE 'Tags.xml'
INTO TABLE tags
ROWS IDENTIFIED BY '<row>';
Note
Note that the LOAD XML syntax is slightly changed, so that we can keep our files locally. If your .xml files are on your local machine rather than on the database server itself, simply add the word LOCAL to the LOAD XML statements, as shown in the preceding code, and you can reference the full path to your file.
More information about the MySQL LOAD XML syntax is described in the MySQL documentation here: http://dev.mysql.com/doc/refman/5.5/en/load-xml.html.
At this point, we have a fully functional MySQL database comprised of eight tables, each of which is filled with data. However, these tables are very large. There are over 190 million rows in only eight tables. One thing we will notice as we start to clean the data and prepare it for analysis, is that if we make a mistake on a very large table like posts, comments, votes, or post_history, rebuilding the table will take a long time. In the next step, we learn how to create test tables, so that we contain the damage if one of our programs or queries goes awry.
Building test tables
In this section, we will build eight smaller versions of our original tables, each randomly populated with data from the original tables.
Our first step is to re-run the CREATE statements, but this time prefix each table name with test_, as shown with one table here:
DROP TABLE IF EXISTS test_post_links;
CREATE TABLE test_post_links (
Id INT NOT NULL PRIMARY KEY,
CreationDate INT,
PostId INT,
RelatedPostId INT,
LinkTypeId INT
);
Other than the addition of test_ to the front of the table name, these eight test tables will be identical to the others we made earlier.
Next, we need to populate our new test tables with data. We could simply select the first 1,000 rows from each table and load those into our test tables. However, the downside of doing that is that the rows are in order based on when they were inserted into the Stack Overflow database, so we will not have a good sample of rows from different dates and time in our subset if we just ask for the first 1,000 rows. We would like the rows we select to be of a fairly random distribution. How can we select a set of rows randomly? We have not had to tackle this question before in this book, so here is another case where we have to be ready to try new things in order to have our data science dinner party go off without a hitch.
There are a few possibilities for selecting random rows, some of which are more efficient than others. Efficiency will be important to us in this project, since the tables we are working with are quite large. One thing that makes our random row selection a little trickier than expected, is that while our tables do have a numeric primary key as the Id column, these Id numbers are not sequential. There are many holes, for example, in the post_links table, the first few values in the Id column are 19, 37, 42, and 48.
Holes in the data are problematic because a simple randomizer operates like this:
1. Construct a PHP script that asks for the lowest and highest Id values in the table, like this:
2. SELECT min(Id) FROM post_links;
SELECT max(Id) FROM post_links;
3. Then, still in the script, generate some random number between the min and the max value, and request the row with that random value:
SELECT * FROM post_links WHERE Id = [random value];
4. Repeat step 2 for as many rows as you need.
Unfortunately, doing this in the Stack Overflow database tables, for example, on our post_links table, will result in many failed queries, since our data has so many holes in the Id column, for example, what if step 2 in the preceding example generated the number 38? There is no Id of 38 in our post_links table. This means we will need to detect this error and try again with a new random value.
Note
At this point, someone who knows a little SQL — but not a lot — will usually suggest that we just ask MySQL to ORDER BY rand() on the column with the Id in it, and then perform a LIMIT command to skim off the number of records we want. The problem with this idea is that even if the column we are ordering is an indexed column, ORDER BY rand() has to read every row in order to assign a new random number to it. So, on a very large table, like the tables we have in the Stack Overflow database, this does not scale at all. We will be waiting way too long for an ORDER BY rand() query to finish. ORDER BY rand() is a tolerable solution for small tables, but not for the sizes we are working with here.
The following PHP script shows how our final random row selection process will work to build eight test tables, each with exactly 1,000 rows. Each table will be populated by row values that are selected as randomly as possible with as little effort as possible, and without us over-engineering this simple problem:
<?php //randomizer.php
// how many rows should be in each of the test tables?
$table_target_size = 1000;
// connect to db, set up query, run the query
$dbc = mysqli_connect('localhost','username','password','stackoverflow')
or die('Error connecting to database!' . mysqli_error());
$dbc->set_charset("utf8");
$tables = array("badges",
"comments",
"posts",
"post_history",
"post_links",
"tags",
"users",
"votes");
foreach ($tables as $table)
{
echo "\n=== Now working on $table ===\n";
$select_table_info = "SELECT count(Id) as c, min(Id) as mn, max(Id) as mx FROM $table";
$table_info = mysqli_query($dbc, $select_table_info);
$table_stuff = mysqli_fetch_object($table_info);
$table_count = $table_stuff->c;
$table_min = $table_stuff->mn;
$table_max = $table_stuff->mx;
// set up loop to grab a random row and insert into new table
$i=0;
while($i < $table_target_size)
{
$r = rand($table_min, $table_max);
echo "\nIteration $i: $r";
$insert_rowx = "INSERT IGNORE INTO test_$table (SELECT * FROM $table WHERE Id = $r)";
$current_row = mysqli_query($dbc, $insert_rowx);
$select_current_count = "SELECT count(*) as rc FROM test_$table";
$current_count= mysqli_query($dbc, $select_current_count);
$row_count = mysqli_fetch_object($current_count)->rc;
$i = $row_count;
}
}
?>
After running that code, we can see we have a nice selection of eight test tables to work with if we need them. Testing with these smaller tables ensures that our cleaning exercises will go more smoothly and mistakes can be contained. If we find that we need more rows in our random tables, we can simply raise the $table_target_size command and run this again.
Building test tables is a great habit to get into, once you know how easy it is to create them in a simple and useful way.
Step three – cleaning the data
Remembering that our goal is to begin analyzing how frequently certain URLs are referenced in questions, answers, and comments, it makes sense to begin in the text of the Stack Overflow posts and comments tables. However, since those tables are so large, we will use the test_posts andtest_comments tables that we just created instead. Then, once we are confident that the queries work perfectly, we can re-run them on the larger tables.
This cleaning task is very similar to the way we stored the URLs extracted from tweets in Chapter 7, RDBMS Cleaning Techniques. However, this project has its own set of specific rules:
· Since posts and comments are different entities to begin with, we should make separate tables for the URLs that come from posts (including questions and answers) and the URLs that come from comments.
· Each question, answer, or comment can have multiple URLs inside it. We should store all of the URLs, and we should also track the unique identifier for which post or comment that URL came from.
· Each question and answer can also have formatted source code in it. The <code> tag is used to delimit source code in the Stack Overflow posts. Separating code from posts will help us answer questions about the co-existence of paste site URLs and source code. How much code will typically accompany such a link, if any?
Note
Technically, posts can be created without the <code> tags, but usually someone will quickly edit the errant post to include these useful tags, and will get the Stack Overflow points for doing so. For brevity's sake, in this project, we will assume that code is included in the <code> tags.
· According to the Stack Overflow database dump documentation (available at http://meta.stackexchange.com/questions/2677/), there are actually eight types of posts, of which questions and answers are just two types. So, we will need to limit our queries to posts that have postTypeId=1for questions and postTypeId=2 for answers.
· To ensure that we are only extracting URLs from comments made to questions or answers, and not other types of posts, we will need to do a join back to the posts table and limit our results to postTypeId=1 or postTypeId=2.
Creating the new tables
The SQL query to create the database tables we need to store these URLs is as follows:
CREATE TABLE clean_comments_urls (
id INT NOT NULL AUTO_INCREMENT PRIMARY KEY,
commentId INT NOT NULL,
url VARCHAR(255) NOT NULL
) ENGINE=MyISAM DEFAULT CHARSET=utf8;
CREATE TABLE IF NOT EXISTS clean_posts_urls (
id INT NOT NULL AUTO_INCREMENT PRIMARY KEY,
postId INT NOT NULL,
url VARCHAR(255) NOT NULL
) ENGINE=MyISAM DEFAULT CHARSET=utf8;
We also need to create a table that can hold the code we stripped out of the posts:
CREATE TABLE clean_posts_code (
id INT NOT NULL AUTO_INCREMENT PRIMARY KEY,
postId INT NOT NULL,
code TEXT NOT NULL
) ENGINE=MyISAM DEFAULT CHARSET=utf8;
At this point, we have three new tables that will store our cleaned URLs and cleaned source code. In the next section, we will extract URLs and code and fill up these new tables.
Extracting URLs and populating the new tables
We can modify the scripts we wrote earlier in Chapter 7, RDBMS Cleaning Techniques, to extract URLs in this new Stack Overflow environment as follows:
<?php // urlExtractor.php
// connect to db
$dbc = mysqli_connect('localhost', 'username', 'password', 'stackoverflow')
or die('Error connecting to database!' . mysqli_error());
$dbc->set_charset("utf8");
// pull out the text for posts with
// postTypeId=1 (questions)
// or postTypeId=2 (answers)
$post_query = "SELECT Id, Body
FROM test_posts
WHERE postTypeId=1 OR postTypeId=2";
$comment_query = "SELECT tc.Id, tc.Text
FROM test_comments tc
INNER JOIN posts p ON tc.postId = p.Id
WHERE p.postTypeId=1 OR p.postTypeId=2";
$post_result = mysqli_query($dbc, $post_query);
// die if the query failed
if (!$post_result)
die ("post SELECT failed! [$post_query]" . mysqli_error());
// pull out the URLS, if any
$urls = array();
$pattern = '#\b(([\w]+://?|www[.])[^\s()<>]+(?:\([\w\d]+\)|([^[:punct:]\s]|/)))#';
while($row = mysqli_fetch_array($post_result))
{
echo "\nworking on post: " . $row["id"];
if (preg_match_all(
$pattern,
$row["Body"],
$urls
))
{
foreach ($urls[0] as $url)
{
$url = mysqli_escape_string($dbc, $url);
echo "\n----url: ".$url;
$post_insert = "INSERT INTO clean_posts_urls (id, postid, url)
VALUES (NULL," . $row["Id"] . ",'$url')";
echo "\n$post_insert";
$post_insert_result = mysqli_query($dbc, $post_insert);
}
}
}
$comment_result = mysqli_query($dbc, $comment_query);
// die if the query failed
if (!$comment_result)
die ("comment SELECT failed! [$comment_query]" . mysqli_error());
while($row = mysqli_fetch_array($comment_result))
{
echo "\nworking on comment: " . $row["id"];
if (preg_match_all(
$pattern,
$row["Text"],
$urls
))
{
foreach ($urls[0] as $url)
{
echo "\n----url: ".$url;
$comment_insert = "INSERT INTO clean_comments_urls (id, commentid, url)
VALUES (NULL," . $row["Id"] . ",'$url')";
echo "\n$comment_insert";
$comment_insert_result = mysqli_query($dbc, $comment_insert);
}
}
}
?>
We now have fully populated clean_post_urls and clean_comment_urls tables. For my randomly filled test tables, running this script only yields around 100 comment URLs and 700 post URLs. Still, that is enough to test out our ideas before running them on the full dataset.
Extracting code and populating new tables
To extract the text embedded in <code> tags and populate our new clean_posts_code table, we can run the following script. It is similar to the URL extractor, except that it does not need to search comments, because those do not have code delimited with a <code> tag.
In my version of the randomly selected test table, the initial SELECT yields about 800 rows out of 1,000 total rows in the test_post table. However, each post can have multiple code snippets in it, so the final table ends up having over 2,000 rows in it. The following PHP code extracts the text embedded in the <code> tag:
<?php // codeExtractor.php
// connect to db
$dbc = mysqli_connect('localhost', 'username, 'password', 'stackoverflow')
or die('Error connecting to database!' . mysqli_error());
$dbc->set_charset("utf8");
// pull out the text for posts with
// postTypeId=1 (questions)
// or postTypeId=2 (answers)
$code_query = "SELECT Id, Body
FROM test_posts
WHERE postTypeId=1 OR postTypeId=2
AND Body LIKE '%<code>%'";
$code_result = mysqli_query($dbc, $code_query);
// die if the query failed
if (!$code_result)
die ("SELECT failed! [$code_query]" . mysqli_error());
// pull out the code snippets from each post
$codesnippets = array();
$pattern = '/<code>(.*?)<\/code>/';
while($row = mysqli_fetch_array($code_result))
{
echo "\nworking on post: " . $row["Id"];
if (preg_match_all(
$pattern,
$row["Body"],
$codesnippets
))
{
$i=0;
foreach ($codesnippets[0] as $code)
{
$code = mysqli_escape_string($dbc, $code);
$code_insert = "INSERT INTO clean_posts_code (id, postid, code)
VALUES (NULL," . $row["Id"] . ",'$code')";
$code_insert_result = mysqli_query($dbc, $code_insert);
if (!$code_insert_result)
die ("INSERT failed! [$code_insert]" . mysqli_error());
$i++;
}
if($i>0)
{
echo "\n Found $i snippets";
}
}
}
?>
We now have a list of all the code that has been printed in each post, and we have stored that in the clean_post_code table.
Step four – analyzing the data
In this section, we write some code to answer our three questions from the beginning of this chapter. We were interested in finding:
· The counts of different paste sites mentioned by URLs in posts and comments
· The counts of paste site URLs in questions compared to answers
· Statistics about <code> prevalence in posts with a paste site URL
Which paste sites are most popular?
To answer this first question, we will generate a JSON representation of the paste site URLs and counts using the clean_posts_urls and clean_comments_urls tables. This simple analysis will help us find out which pastebin websites are popular in this Stack Overflow data dump. The following PHP queries the database for the paste sites we have prelisted in the $pastebins array and then performs a count of the matching URLs from the posts and comments. It uses the test tables, so the numbers are much smaller than they would be if we used the real tables:
<?php // q1.php
// connect to db
$dbc = mysqli_connect('localhost', 'username', 'password', 'stackoverflow')
or die('Error connecting to database!' . mysqli_error());
$dbc->set_charset("utf8");
// these are the web urls we want to look for and count
$pastebins = array("pastebin",
"jsfiddle",
"gists",
"jsbin",
"dpaste",
"pastie");
$pastebin_counts = array();
foreach ($pastebins as $pastebin)
{
$url_query = "SELECT count(id) AS cp,
(SELECT count(id)
FROM clean_comments_urls
WHERE url LIKE '%$pastebin%') AS cc
FROM clean_posts_urls
WHERE url LIKE '%$pastebin%'";
$query = mysqli_query($dbc, $url_query);
if (!$query)
die ("SELECT failed! [$url_query]" . mysqli_error());
$result = mysqli_fetch_object($query);
$countp = $result->cp;
$countc = $result->cc;
$sum = $countp + $countc;
array_push($pastebin_counts, array('bin' => $pastebin,
'count' => $sum));
}
// sort the final list before json encoding it
// put them in order by count, high to low
foreach ($pastebin_counts as $key => $row)
{
$first[$key] = $row['bin'];
$second[$key] = $row['count'];
}
array_multisort($second, SORT_DESC, $pastebin_counts);
echo json_encode($pastebin_counts);
?>
We can view the JSON output from this script when run against the test tables by looking at the output of the script. My random rows produced the following counts:
[{"bin":"jsfiddle","count":44},{"bin":"jsbin","count":4},{"bin":"pastebin","count":3},{"bin":"dpaste","count":0},{"bin":"gists","count":0},{"bin":"pastie","count":0}]
Note
Remember that your values may be different since you have a different set of randomly selected URLs.
When we move to the Step 5 – visualizing the data section of this chapter, we will use this JSON code to build a bar graph. But first, let's answer the other two questions we posed earlier.
Which paste sites are popular in questions and which are popular in answers?
Our second question was whether the pastebin URLs are more prevalent in question posts or answer posts. To start to develop this answer, we will run a series of SQL queries. The first query simply asks how many posts are in the clean_posts_urls table of each type, both questions and answers:
SELECT tp.postTypeId, COUNT(cpu.id)
FROM test_posts tp
INNER JOIN clean_posts_urls cpu ON tp.Id = cpu.postid
GROUP BY 1;
The results show that in my randomly selected test set, I have 237 questions and 440 answers:
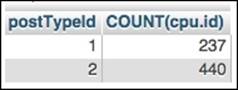
phpMyAdmin shows the count of question URLs and answer URLs.
Now, we would want to know the answer to this question: of those 677 URLs, divided by questions and answers, how many reference specifically one of the six pastebin URLs? We can run the following SQL code to find out:
SELECT tp.postTypeId, count(cpu.id)
FROM test_posts tp
INNER JOIN clean_posts_urls cpu ON tp.Id = cpu.postId
WHERE cpu.url LIKE '%jsfiddle%'
OR cpu.url LIKE '%jsbin%'
OR cpu.url LIKE '%pastebin%'
OR cpu.url LIKE '%dpaste%'
OR cpu.url LIKE '%gist%'
OR cpu.url LIKE '%pastie%'
GROUP BY 1;
The results look like the following table. A total of 18 questions reference one of the paste sites, whereas 24 answers reference one of the paste sites.
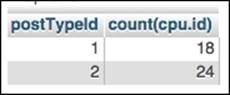
phpMyAdmin shows the count of question and answer URLs referencing a pastebin.
One thing to keep in mind about these queries is that they count individual URLs. So, if a particular postId referenced five URLs, those get counted five times. If I am interested in how many posts used a paste site URL once or more, I need to modify the first line of both queries as follows. This query counts distinct postings in the URLs table:
SELECT tp.postTypeId, COUNT(DISTINCT cpu.postId)
FROM test_posts tp
INNER JOIN clean_posts_urls cpu ON tp.Id = cpu.postId
GROUP BY 1;
The following screenshot shows how many questions and answers include a URL:
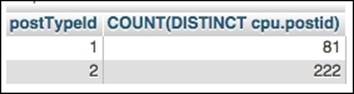
phpMyAdmin shows how many questions and answers include any URL.
This query counts the particular posts in the URLs table that mention a paste site:
SELECT tp.postTypeId, count(DISTINCT cpu.postId)
FROM test_posts tp
INNER JOIN clean_posts_urls cpu ON tp.Id = cpu.postId
WHERE cpu.url LIKE '%jsfiddle%'
OR cpu.url LIKE '%jsbin%'
OR cpu.url LIKE '%pastebin%'
OR cpu.url LIKE '%dpaste%'
OR cpu.url LIKE '%gist%'
OR cpu.url LIKE '%pastie%'
GROUP BY 1;
The results for this paste site query are as follows, and, as expected, the numbers are smaller. In our test set, 11 questions used at least one pastebin URL, and so did 16 answers. Combined, 37 posts reference a pastebin URL at least once.
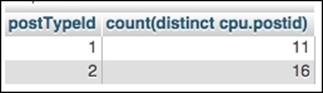
PhpMyAdmin shows how many questions and answers include any paste site URL.
Even though these results seem to show that people reference paste site URLs more in answers than questions, we need to compare them in terms of the overall number of questions and answers. We should report our result values as a percentage of the total for that post type, question or answer. Taking the totals into account, we can now say something like this: "Considering only the questions and answers that used any kind of URL at least once, 11 questions out of 81 used at least one paste site URL (13.6 percent), and 16 answers out of 222 used at least one paste site URL (7.2 percent)." With that in mind, it appears that the questions actually outstripped answers in referencing a paste site, almost two to one.
At this point in any data analysis project, you must have a flood of questions, like:
· How has the usage of paste site URLs in questions and answers changed over time?
· How do questions with paste site URLs fare on voting and favorites?
· What are the characteristics of users who post questions with paste site URLs?
But since this is a book about data cleaning, and since we still have not even visualized this data, I will restrain myself and not answer these for the time being. We still have one of our original three questions to answer, and then we will move on to visualizing some of our results.
Do posts contain both URLs to paste sites and source code?
Answering our third question requires us to compare the amount of code in the Stack Overflow questions to the amount in the Stack Overflow answers, paying particular attention to the posts that include some sort of source code, delimited by the <code> tags. In the Step three – cleaning the data section, we extracted all code from the posts in our test tables, and created a new table to hold these code snippets. Now, a simple query to figure out how many code-containing posts there are is as follows:
SELECT count(DISTINCT postid)
FROM clean_posts_code;
In my sample set, this yields 664 code-containing posts, out of the total 1,000 test posts. Another way to put this is: 664 out of 1,000 posts contain at least one <code> tag.
To figure out how many of these code-containing posts also contained any URL, we can run the following SQL query:
SELECT count(DISTINCT cpc.postid)
FROM clean_posts_code cpc
INNER JOIN clean_posts_urls cpu
ON cpu.postId = cpc.postId;
My sample set yields 175 rows for this. We can interpret that by saying that 17.5 percent of the original test set of 1,000 posts contains code and a URL.
Now, to figure out how many of the code-containing posts also contained a paste site URL, we will narrow down the SQL query even further:
SELECT count(DISTINCT cpc.postid)
FROM clean_posts_code cpc
INNER JOIN clean_posts_urls cpu
ON cpu.postId = cpc.postId
WHERE cpu.url LIKE '%jsfiddle%'
OR cpu.url LIKE '%jsbin%'
OR cpu.url LIKE '%pastebin%'
OR cpu.url LIKE '%dpaste%'
OR cpu.url LIKE '%gist%'
OR cpu.url LIKE '%pastie%';
From these results, we can see that only a tiny set of 25 posts contained both source code and a paste site URL. From the second question, we know that 37 distinct posts (both questions and answers) used some sort of paste site URL at least once. So, 25 out of 37 is about 68 percent. It will be interesting to run these queries on the larger dataset to see how those values come out.
In the meantime, we will carry out some simple visualizations of at least one of our questions so that we can close the loop on one complete round of the data science six-step process.
Step five – visualizing the data
The visualization step is sort of like the dessert course in our dinner party. Everyone loves a rich graphic and they look so nice. However, since our focus in this book is on cleaning rather than analysis and visualization, our graphics here will be very simple. In the code that follows, we will use the JavaScript D3 visualization libraries to display the results of the first question graphically. This visualization will be much simpler than the D3 visualization we did in Chapter 4, Speaking the Lingua Franca – Data Conversions. In that chapter, you will recall that we built a fairly complicated network diagram, but here, a simple bar graph will suffice since all we have to display is just a few labels and counts.
The HTML and JavaScript/D3 code is as follows. This code extends the Let's Build a Bar Graph tutorial by Mike Bostock, available at http://bl.ocks.org/mbostock/3885304. One of the ways that I extended this code was to make it read the JSON file we generated earlier in our q1.php script. Our JSON file printed really nicely, and was already sorted high to low, so building a little bar graph from that will be easy:
<!DOCTYPE html>
<meta charset="utf-8">
<!--
this code is modeled on mbostock's
"Let's Make a Bar Chart" D3 tutorial
available at http://bl.ocks.org/mbostock/3885304
My modifications:
* formatting for space
* colors
* y axis labels
* changed variable names to match our data
* loads data via JSON rather than .tsv file
-->
<style>
.bar {fill: lightgrey;}
.bar:hover {fill: lightblue;}
.axis {font: 10px sans-serif;}
.axis path, .axis line {
fill: none;
stroke: #000;
shape-rendering: crispEdges;
}
.x.axis path {display: none;}
</style>
<body>
<script src="d3.min.js"></script>
<script>
var margin = {top: 20, right: 20, bottom: 30, left: 40},
width = 960 - margin.left - margin.right,
height = 500 - margin.top - margin.bottom;
var x = d3.scale.ordinal()
.rangeRoundBands([0, width], .1);
var y = d3.scale.linear()
.range([height, 0]);
var xAxis = d3.svg.axis()
.scale(x)
.orient("bottom");
var yAxis = d3.svg.axis()
.scale(y)
.orient("left");
var svg = d3.select("body").append("svg")
.attr("width", width + margin.left + margin.right)
.attr("height", height + margin.top + margin.bottom)
.append("g")
.attr("transform", "translate(" + margin.left + "," + margin.top + ")");
d3.json("bincounter.php", function(error, json)
{
data = json;
draw(data);
});
function draw(data)
{
x.domain(data.map(function(d) { return d.bin; }));
y.domain([0, d3.max(data, function(d) { return d.count; })]);
svg.append("g")
.attr("class", "x axis")
.attr("transform", "translate(0," + height + ")")
.call(xAxis);
svg.append("g")
.attr("class", "y axis")
.call(yAxis)
.append("text")
.attr("transform", "rotate(-90)")
.attr("y", 6)
.attr("dy", ".71em")
.style("text-anchor", "end")
.text("Frequency");
svg.selectAll(".bar")
.data(data)
.enter().append("rect")
.attr("class", "bar")
.attr("x", function(d) { return x(d.bin) ; })
.attr("width", x.rangeBand())
.attr("y", function(d) { return y(d.count); })
.attr("height", function(d) { return height - y(d.count); });
}
</script>
</body>
</html>
We can save this as q1chart.html, and view it in the browser. The code calls our q1.php script, which generates the JSON file that D3 then uses to build this chart, the left-hand-side of which is shown here:
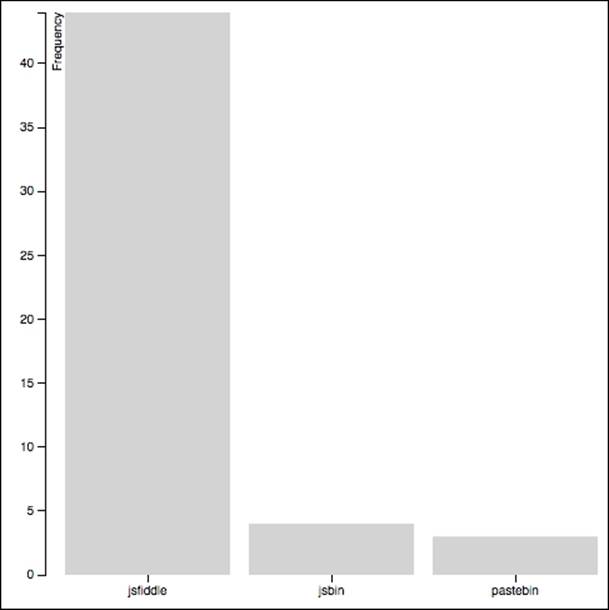
D3 visualization of the JSON produced from a count of three URLs.
The bar graph shows that the URLs pointing to JSFiddle seem to be the most common, at least in my version of the randomly selected test dataset. We knew that just from looking at the JSON output from q1.php, but it is nice to see it graphically as well. In the next section, we will summarize the results and our procedure, and talk about where to go next with this project.
Step six – problem resolution
From the queries and visualizations we developed in the Step four – analyzing the data and Step five – visualizing the data sections, we can now attempt to answer each of the three questions that prompted this project in the first place.
With our first question, we wanted to find counts of the different paste sites mentioned by URL in posts and comments. The q1.php script and bar graph we made to visualize the data show that, at least in the test data, JSFiddle was the most commonly referenced of the six paste site URLs we looked at.
The second question was about whether paste site URLs were more prevalent in questions or answers. Our queries show that paste site URLs were about twice as likely to occur in questions as opposed to answers, but the numbers for both were very small, at least in our test set.
For the third question, we wanted to look for whether people were actually heeding the advice of Stack Overflow and posting code in addition to a paste site URL. In our test set, the queries show that 25 postings (out of 37) include both a paste site URL and the recommended accompanying source code. This is a rate of about 68 percent compliance.
There are many additional questions we could ask and answer at this point, and many exciting ways we could extend this simple study into something that could be even more interesting. For now though, we will focus on the storage and cleaning procedures needed to extend this project to use the full dataset.
Moving from test tables to full tables
At the beginning of this project, we made a set of test tables so that we could develop our project in a stress-free environment using tables with only 1,000 rows each. Using small tables with manageable numbers of rows is important in cases where we are not sure that our queries will work as we want them to, or where we want to experiment with tricky joins, subqueries, weird regular expressions, and so on. At this point, though, if we feel good about the queries and scripts we have written, it is time to rewrite our procedures to use the full-size tables.
Here are the steps we will follow to move the project over to full-size tables:
1. DROP the test tables:
2. DROP TABLE IF EXISTS test_badges;
3. DROP TABLE IF EXISTS test_comments;
4. DROP TABLE IF EXISTS test_posts;
5. DROP TABLE IF EXISTS test_post_history;
6. DROP TABLE IF EXISTS test_post_links;
7. DROP TABLE IF EXISTS test_tags;
8. DROP TABLE IF EXISTS test_users;
DROP TABLE IF EXISTS test_votes;
9. Empty the cleaned_posts_code, cleaned_posts_urls, and cleaned_comments_urls tables as follows:
10.TRUNCATE TABLE cleaned_posts_code;
11.TRUNCATE TABLE cleaned_posts_urls;
TRUNCATE TABLE cleaned_comments_urls;
12.Edit the urlExtractor.php and codeExtractor.php scripts to SELECT from the posts table rather than the test_posts table. These queries can be edited as follows:
SELECT Id, Body FROM posts
13.Re-run the urlExtractor.php and codeExtractor.php scripts so that they will repopulate the clean code and URL tables we emptied (truncated) earlier.
At this point, we have the cleaned code and URL tables ready to be analyzed and visualized. Take your time when performing these steps, and know that many of these queries and scripts will likely take a long time to finish. The posts table is quite large and many of the queries we are writing are selected against a text column using wildcards.
Summary
In this project, we posed a few questions about the prevalence of URLs on Stack Overflow, specifically those related to paste sites like http://www.Pastebin.com and http://www.JSFiddle.net. To get started answering these questions, we downloaded data from the Stack Overflow postings (and other Stack Overflow data as well) from the Stack Exchange public file release. We built a MySQL database and eight tables to hold this data. We then created smaller 1,000-row versions of each of those tables for testing purposes, populated with a randomly selected sample of the data. From these test tables, we extracted the URLs mentioned in each question, answer, and comment, and saved them to a new clean table. We also extracted the source code found in the questions and answers, and saved those snippets to a new table as well. Finally, we were able to build some simple queries and visualizations to help us answer the questions we posed at the beginning.
Despite its modest results, from a data cleaning perspective, our dinner party was a success. We were able to make a coherent plan, and take methodical steps to put the plan into action and alter it when needed. We are now ready for our final project, and a completely different dinner party menu.
In the next chapter, we will collect and clean our own version of a famous Twitter dataset.