Megan Squire (2015)
Chapter 10. Twitter Project
As with the project we completed in Chapter 9, Stack Overflow Project, our next full-length chapter dinner party is designed to show off our data cleaning skills in particular, while still completing each stage of the overall data science process. Our previous project used Stack Overflow data, a combination of MySQL and PHP to clean it, and JavaScript D3 to visualize it. In this chapter, we will use Twitter data, MySQL and Python to collect and clean it, and JavaScript and D3 to visualize it. As with our previous project, in this project, the data science process is still the same:
1. Decide what kind of problem we are trying to solve — why do we need to examine this data?
2. Collect and store our data, which consists of downloading and extracting a publicly-available set of tweet identification numbers, and then using a program to redownload the original tweets. This step also includes creating smaller sets of data for testing purposes.
3. Clean data by extracting and storing only the parts that we need. In this step, we write a quick Python program to load in the data, pull out the fields we want, and write those to a small set of database tables.
4. Analyze the data. Do we need to perform any calculations on the data? Should we write some aggregate functions to count or sum the data? Do we need to transform the data in some way?
5. Provide visualizations of the data, if possible.
6. Resolve the problem we set out to investigate. Did our process work? Were we successful?
As with our previous project, the bulk of the work will be in the collection, storage, and cleaning tasks. In this project, we will notice that we store different versions of our data several times, first as a text file, then as a hydrated JSON file, then as a MySQL database. Each of these different formats results from a different collection or cleaning process and feeds into the next. In this way, we start to see how the collection, storage, and cleaning steps can be iterative — feeding back to one another — rather than just linear.
Step one – posing a question about an archive of tweets
Twitter is a popular microblogging platform used by millions of people around the world to share their thoughts or communicate about current events. Because of Twitter's relative ease of access for both posting and reading, especially from mobile devices, it has emerged as an important platform for sharing information during public events, such as political crises and protests, or to track the emergence of an issue in the public consciousness. Saved tweets become a sort of time capsule, providing a wealth of insight into public sentiment at the time of the event. Frozen in time, the tweets themselves are unaffected by memory lapses or subsequent reversals in public opinion. Scholars and media experts can collect and study these topical tweet archives to attempt to learn more about what the public opinion was at the time, or about how information traveled, or even about what happened in an event, when it happened, and why.
Many people have now started making their tweet collections public. Some of the tweet archives that are now available for public download include:
· Tweets that are in reference to protest and unrest following events in Ferguson, Missouri, USA, between August 10 and August 27, 2014. These are available at https://archive.org/details/ferguson-tweet-ids.
· Tweets from a number of countries during the Arab Spring events of 2011, including Libya, Bahrain, Egypt, and others. These are available at http://dfreelon.org/2012/02/11/arab-spring-twitter-data-now-available-sort-of/.
· Tweets that mention #YesAllWomen hashtag and the related hashtag #NotAllMen, between May and June 2014. These are available at http://digital.library.unt.edu/ark:/67531/metadc304853/.
In the next step, we will need to choose one of these to download and begin to work with. Since the Ferguson tweets are the newest and the most complete of those three example data sets, I have designed the rest of this chapter around it. However, no matter what set you use, the concepts and basic procedures here will apply.
The basic question we want to ask in this chapter is quite simple: when people tweeted about Ferguson, which Internet domains did they tweet about most? Compared to our set of questions in Chapter 9, Stack Overflow Project, this is a very simple question, but the data collection process is somewhat different here, so a simple question is enough to motivate our data science dinner party.
Step two – collecting the data
Unlike the small sentiment tweet archive that we studied in Chapter 7, RDBMS Cleaning Techniques, the newer tweet archives, like those mentioned, no longer contain the actual text of the tweets themselves. Twitter's Terms of Service (ToS) have changed as of 2014, and distributing other people's tweets is now a violation of this ToS. Instead, what you will find in a newer tweet archive is actually just the tweet identification (ID) numbers. Using these numbers, we will have to collect the actual tweets individually. At that point, we can store and analyze the tweets ourselves. Note that at any point during or after this process, we cannot redistribute the tweet text or their metadata, only the tweet identification numbers.
Note
Even though it is inconvenient for the researcher who wants to collect the tweets, the stated reason for Twitter's change to their ToS is to honor the notion of copyright by the original person who posted the tweet. This is especially important in terms of deleting a tweet. If a tweet has been copied and redistributed all around the Web and stored in data files by third parties, the tweet cannot really be deleted. By asking that researchers copy only the tweet ID, Twitter attempts to protect the user's ability to delete his or her own content. A request for a deleted tweet ID will return no result.
Download and extract the Ferguson file
The Ferguson-related tweets are available at the Internet Archive as a set of archived, compressed text files. Point your browser to https://archive.org/details/ferguson-tweet-ids and download the 147 MB ZIP file.
We can extract the files as follows:
unzip ferguson-tweet-ids.zip
The ls command shows that a directory is created called ferguson-tweet-ids, and there are two zipped files inside that directory as well: ferguson-indictment-tweet-ids.zip and ferguson-tweet-ids.zip. We really only need to unzip one of these to perform this project, so I chose this one:
unzip ferguson-tweet-ids.zip
Unzipping this file exposes several manifest text files, as well as a data folder. Inside the data folder is a gzipped file. Unzip it as follows:
gunzip ids.txt.gz
This yields a file called ids.txt. This is the file we are actually after. Let's explore this file.
To see the size of the file, we can run the wc command. When run from the command prompt as shown here, wc shows how many lines, words, and characters are in the file, in that order:
megan$ wc ids.txt
13238863 13238863 251538397 ids.txt
The first number indicates how many lines are in the ids.txt file, just over 13 million. Next, we can peek inside the file with the head command:
megan$ head ids.txt
501064188211765249
501064196642340864
501064197632167936
501064196931330049
501064198005481472
501064198009655296
501064198059597824
501064198513000450
501064180468682752
501064199142117378
The head command shows the first ten lines of the file so we can see that each line is comprised of an 18-digit tweet ID.
Create a test version of the file
In this stage, we will create a small test file to work with for the remainder of this project. The reasons we want to do this are the same reasons why we worked with test tables in the Chapter 9, Stack Overflow Project. Because the original files are extremely large, we want to work with a subset of the data in case we make a mistake. We also want to be able to test our code without taking too long to complete each step.
Unlike in previous exercises, it probably does not matter if we select our test data lines randomly in this case. Just by looking at the result of the head command we ran earlier, we can see that the lines are not really in low-to-high order. In fact, we have no information about what order the original set of lines are in. Therefore, let's just grab the first 1,000 tweet IDs and save them to a file. This will become our test set:
head -1000 ids.txt > ids_1000.txt
Hydrate the tweet IDs
We will now use this test set of 1,000 tweet IDs to test our procedure for collecting the original tweets based on their identification number. This process is called hydrating the tweets. To do this, we will use a handy Python tool called twarc, which was written by Ed Summers, the same person who archived all the Ferguson tweets. It works by taking a list of tweet IDs and fetching each original tweet from the Twitter API one by one. To do anything with the Twitter API, we must have a Twitter developer account already set up. Let's make our Twitter account first, and then we can install twarc and use it.
Setting up a Twitter developer account
To set up a Twitter developer account, go to https://apps.twitter.com and log in with your Twitter account. If you do not already have a Twitter account, you will need to make one of those in order to complete the rest of these steps.
Once you are logged in with your Twitter account, from the http://apps.twitter.com page, click on Create New App. Fill in the required details to create your application (give it a name, perhaps something like My Tweet Test; a short description; and a URL, which does not have to be permanent). My filled-in app creation form is shown here for your reference:
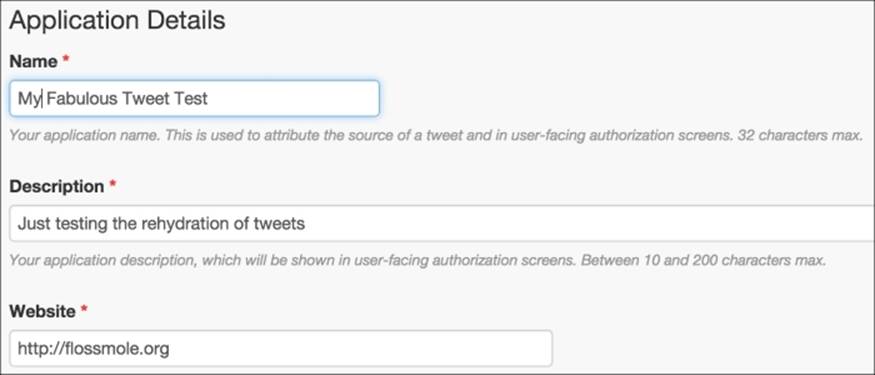
Twitter's Create New App form, filled in with sample data
Click on the checkbox indicating that you agree to the developer agreement, and you will be returned to the screen listing all your Twitter apps, with your new app at the top of the list.
Next, to use this app, we will need to get a few key pieces of information that are required for it to work. Click on the app you just created, and you will see four tabs across the top of the next screen. We are interested in the one that says Keys and Access Tokens. It looks like this:
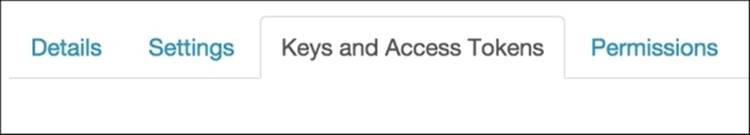
The tab interface within your newly created Twitter app.
There are a lot of numbers and secret codes on this screen, but there are four items that we need to pay particular attention to:
· CONSUMER_KEY
· CONSUMER_SECRET
· ACCESS_TOKEN
· ACCESS_TOKEN_SECRET
No matter what kind of Twitter API programming you are doing, at least for the time being, you will always need these same four items. This is true whether you are using twarc or some other tool. These credentials are how Twitter authenticates you and makes sure that you have the access rights needed to see whatever it is that you are requesting.
Note
These API credentials are also how Twitter limits how many requests you can send and how quickly you can make your requests. The twarc tool handles all of this on our behalf, so we do not have to worry too much about exceeding our rate limits. For more information on Twitter's rate limits, check out their developer documentation at https://dev.twitter.com/rest/public/rate-limiting.
Installing twarc
Now that we have access to our Twitter credentials, we can install twarc.
The twarc download page is available on GitHub at https://github.com/edsu/twarc. On that page, there is documentation about how to use the tool and what options are available.
To install twarc in your Canopy Python environment, start up Canopy and then choose Canopy Command Prompt from the Tools menu.
At the command prompt, type in:
pip install twarc
This command will install twarc and make it available to be called as a command-line program, or from within your own Python programs.
Running twarc
We can now use twarc from the command line to hydrate the ids_1000.txt file that we created earlier. The command line for this is very long, since we have to pass in those four long secret tokens that we created earlier on the Twitter site. To save myself from making errors, I used my text editor, Text Wrangler, to create the command line first, and then I pasted it into my Command Prompt. Your final command line will look like the one that follows, except everywhere that it says abcd, you should instead fill in your appropriate secret token or secret key:
twarc.py --consumer_key abcd --consumer_secret abcd --access_token abcd --access_token_secret abcd --hydrate ids_1000.txt > tweets_1000.json
Note that this command line will redirect its output to a JSON file called tweets_1000.json. Inside that file is a JSON representation of each tweet that we only had the ID for previously. Let's check how long the new file is:
wc tweets_1000.json
The wc utility indicates that my file is 894 lines long, which indicates that some of the tweets were unable to be found (since I originally had 1,000 tweets in my dataset). If tweets have been deleted in the time since I have written this, your file might be even smaller.
Next, we can also peek inside the file:
less tweets_1000.json
We could also open it in a text editor to view it.
Each line in the JSON file represents a single tweet, each of which looks like the example that follows. However, this example tweet is not from the Ferguson dataset, since I do not have the rights to distribute those tweets. Instead, I used one of the tweets I created back in Chapter 2,Fundamentals – Formats, Types, and Encodings, for our discussion on UTF-8 encoding. Since this tweet was created just for this book, and I own the content, I can show you the JSON format without violating Twitter's ToS. Here is what my tweet looked like through the Twitter web interface:
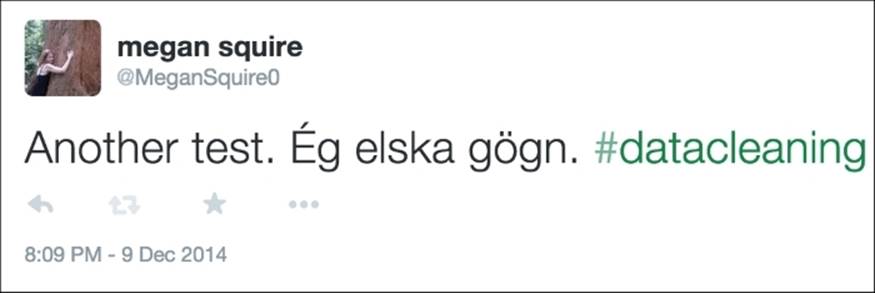
An example of a tweet, as shown in Twitter's web interface.
The following is what the tweet looks like in its JSON representation after twarc hydrates it. I have added newlines in between each JSON element so we can see what attributes are available in each tweet more easily:
{"contributors": null,
"truncated": false,
"text": "Another test. \u00c9g elska g\u00f6gn. #datacleaning",
"in_reply_to_status_id": null,
"id": 542486101047275520,
"favorite_count": 0,
"source": "<a href=\"http://twitter.com\" rel=\"nofollow\">Twitter Web Client</a>",
"retweeted": false,
"coordinates": null,
"entities":
{"symbols": [],
"user_mentions": [],
"hashtags":
[{"indices": [29, 42],
"text": "datacleaning"}],
"urls": []},
"in_reply_to_screen_name": null,
"id_str": "542486101047275520",
"retweet_count": 0,
"in_reply_to_user_id": null,
"favorited": false,
"user":
{"follow_request_sent": false,
"profile_use_background_image": false,
"profile_text_color": "333333",
"default_profile_image": false,
"id": 986601,
"profile_background_image_url_https": "https://pbs.twimg.com/profile_background_images/772436819/b7f7b083e42c9150529fb13971a52528.png",
"verified": false,
"profile_location": null,
"profile_image_url_https": "https://pbs.twimg.com/profile_images/3677035734/d8853be8c304729610991194846c49ba_normal.jpeg",
"profile_sidebar_fill_color": "F6F6F6",
"entities":
{"url":
{"urls":
[{"url": "http://t.co/dBQNKhR6jY",
"indices": [0, 22],
"expanded_url": "http://about.me/megansquire",
"display_url": "about.me/megansquire"}]},
"description": {"urls": []}},
"followers_count": 138,
"profile_sidebar_border_color": "FFFFFF",
"id_str": "986601",
"profile_background_color": "000000",
"listed_count": 6,
"is_translation_enabled": false,
"utc_offset": -14400,
"statuses_count": 376,
"description": "Open source data hound. Leader of the FLOSSmole project. Professor of Computing Sciences at Elon University.",
"friends_count": 82,
"location": "Elon, NC",
"profile_link_color": "038543",
"profile_image_url": "http://pbs.twimg.com/profile_images/3677035734/d8853be8c304729610991194846c49ba_normal.jpeg",
"following": false,
"geo_enabled": false,
"profile_banner_url": "https://pbs.twimg.com/profile_banners/986601/1368894408",
"profile_background_image_url": "http://pbs.twimg.com/profile_background_images/772436819/b7f7b083e42c9150529fb13971a52528.png",
"name": "megan squire",
"lang": "en",
"profile_background_tile": false,
"favourites_count": 64,
"screen_name": "MeganSquire0",
"notifications": false,
"url": "http://t.co/dBQNKhR6jY",
"created_at": "Mon Mar 12 05:01:55 +0000 2007",
"contributors_enabled": false,
"time_zone": "Eastern Time (US & Canada)",
"protected": false,
"default_profile": false,
"is_translator": false},
"geo": null,
"in_reply_to_user_id_str": null,
"lang": "is",
"created_at": "Wed Dec 10 01:09:00 +0000 2014",
"in_reply_to_status_id_str": null,
"place": null}
Not only does each JSON object include facts about the tweet itself, for example, the text, the date, and the time that it was sent out, it also includes a wealth of information about the person who tweeted it.
Tip
The hydration process results in a lot of information about a single individual tweet — and this is a dataset with 13 million tweets in all. Keep this in mind when you get ready to hydrate the entire Ferguson dataset at the end of this chapter.
Step three – data cleaning
At this point, we are ready to begin cleaning the JSON file, extracting the details of each tweet that we want to keep in our long-term storage.
Creating database tables
Since our motivating question only asks about URLs, we really only need to extract those, along with the tweet IDs. However, for the sake of practice in cleaning, and so that we can compare this exercise to what we did earlier in Chapter 7, RDBMS Cleaning Techniques, with thesentiment140 data set, let's design a small set of database tables as follows:
· A tweet table, which only holds information about the tweets
· A hashtag table, which holds information about which tweets referenced which hashtags
· A URL table, which holds information about which tweets referenced which URLs
· A mentions table, which holds information about which tweets mentioned which users
This is similar to the structure we designed in Chapter 7, RDBMS Cleaning Techniques, except in that case we had to parse out our own list of hashtags and URLs and user mentions from the tweet text. The twarc tool has definitely saved us some effort as we complete this project in this chapter.
The CREATE statements to make our four tables are as follows:
CREATE TABLE IF NOT EXISTS ferguson_tweets (
tid bigint(20) NOT NULL,
ttext varchar(200) DEFAULT NULL,
tcreated_at varchar(50) DEFAULT NULL,
tuser bigint(20) DEFAULT NULL,
PRIMARY KEY (tid)
) ENGINE=MyISAM DEFAULT CHARSET=utf8mb4;
CREATE TABLE IF NOT EXISTS ferguson_tweets_hashtags (
tid bigint(20) NOT NULL,
ttag varchar(200) NOT NULL,
PRIMARY KEY (tid, ttag)
) ENGINE=MyISAM DEFAULT CHARSET=utf8;
CREATE TABLE IF NOT EXISTS ferguson_tweets_mentions (
tid bigint(20) NOT NULL,
tuserid bigint(20) NOT NULL,
tscreen varchar(100) DEFAULT NULL,
tname varchar(100) DEFAULT NULL,
PRIMARY KEY (tid,tuserid)
) ENGINE=MyISAM DEFAULT CHARSET=utf8;
CREATE TABLE IF NOT EXISTS ferguson_tweets_urls (
tid bigint(20) NOT NULL,
turl varchar(200) NOT NULL,
texpanded varchar(255) DEFAULT NULL,
tdisplay varchar(200) DEFAULT NULL,
PRIMARY KEY (tid,turl)
) ENGINE=MyISAM DEFAULT CHARSET=utf8;
One thing to note about the tweets table is that it was created with the utf8mb4 collation. This is because the tweets themselves may include characters that are very high in the UTF-8 range. In fact, some characters in these tweets will require more space than the 3-byte limit that the native MySQL UTF-8 character set can hold. Therefore, we designed the main tweet table to hold data in MySQL's utf8mb4 collation, which is included in MySQL 5.5 or higher. If you are working on a MySQL version older than that, or for some other reason, you do not have access to the utf8mb4 collation, you can use MySQL's older UTF-8-general collation, but be aware that you may generate encoding errors with an emoji here or there. If you do run into this error, MySQL will likely yield a message about Error 1366 and incorrect string value when you are trying toINSERT the record.
Now that each table is created, we can begin to select and load the data in.
Populating the new tables in Python
The Python script that follows will load in the JSON file, extract the values from the fields we are interested in, and populate the four tables described previously. There are a few additional, important notes about this script, which I will go through now.
This script does require the MySQLdb Python modules to be installed. As a Canopy Python user, these modules are easy to install through the package manager. Simply run a search for MySQLdb in the Package Manager and click to install:
#jsonTweetCleaner.py
import json
import MySQLdb
# Open database connection
db = MySQLdb.connect(host="localhost",\
user="username", \
passwd="password", \
db="ferguson", \
use_unicode=True, \
charset="utf8")
cursor = db.cursor()
cursor.execute('SET NAMES utf8mb4')
cursor.execute('SET CHARACTER SET utf8mb4')
cursor.execute('SET character_set_connection=utf8mb4')
# open the file full of json-encoded tweets
with open('tweets_1000.json') as f:
for line in f:
# read each tweet into a dictionary
tweetdict = json.loads(line)
# access each tweet and write it to our db table
tid = int(tweetdict['id'])
ttext = tweetdict['text']
uttext = ttext.encode('utf8')
tcreated_at = tweetdict['created_at']
tuser = int(tweetdict['user']['id'])
try:
cursor.execute(u"INSERT INTO ferguson_tweets(tid,
ttext, tcreated_at, tuser) VALUES (%s, %s, %s, %s)", \
(tid,uttext,tcreated_at,tuser))
db.commit() # with MySQLdb you must commit each change
except MySQLdb.Error as error:
print(error)
db.rollback()
# access each hashtag mentioned in tweet
hashdict = tweetdict['entities']['hashtags']
for hash in hashdict:
ttag = hash['text']
try:
cursor.execute(u"INSERT IGNORE INTO
ferguson_tweets_hashtags(tid, ttag) VALUES (%s, %s)",(tid,ttag))
db.commit()
except MySQLdb.Error as error:
print(error)
db.rollback()
# access each URL mentioned in tweet
urldict = tweetdict['entities']['urls']
for url in urldict:
turl = url['url']
texpanded = url['expanded_url']
tdisplay = url['display_url']
try:
cursor.execute(u"INSERT IGNORE INTO ferguson_tweets_urls(tid, turl, texpanded, tdisplay)
VALUES (%s, %s, %s, %s)", (tid,turl,texpanded,tdisplay))
db.commit()
except MySQLdb.Error as error:
print(error)
db.rollback()
# access each user mentioned in tweet
userdict = tweetdict['entities']['user_mentions']
for mention in userdict:
tuserid = mention['id']
tscreen = mention['screen_name']
tname = mention['name']
try:
cursor.execute(u"INSERT IGNORE INTO
ferguson_tweets_mentions(tid, tuserid, tscreen, tname)
VALUES (%s, %s, %s, %s)", (tid,tuserid,tscreen,tname))
db.commit()
except MySQLdb.Error as error:
print(error)
# disconnect from server
db.close()
Tip
For more information on each of the fields provided in the JSON representation of a tweet, the Twitter API documentation is very helpful. The sections on Users, Entities, and Entities in Tweets are particularly instructive when planning which fields to extract from the JSON tweet. You can get started with the documentation at https://dev.twitter.com/overview/api/.
Once this script is run, the four tables are populated with data. On my MySQL instance, after running the preceding script against my ids_1000.txt file, I ended up with 893 rows in the tweets table; 1,048 rows in the hashtags table; 896 rows in the user mentions table; and 371 rows in the URLs table. If you have fewer rows here or there, check to see whether it is because tweets have been deleted.
Step four – simple data analysis
Suppose we want to learn which web domains were linked the most in the Ferguson dataset. We can answer this question by extracting just the domain portion of the URL stored in the tdisplay column in our ferguson_tweets_urls table. For our purposes, we will consider everything before the first slash (/) as the interesting part of the URL.
The following SQL query gives us the domain and count of posts that reference that domain:
SELECT left(tdisplay,locate('/',tdisplay)-1) as url,
count(tid) as num
FROM ferguson_tweets_urls
GROUP BY 1 ORDER BY 2 DESC;
The result of this query is a dataset that looks something like the following (run on the sample set of 1,000 rows):
|
url |
num |
|
bit.ly |
47 |
|
wp.me |
32 |
|
dlvr.it |
18 |
|
huff.to |
13 |
|
usat.ly |
9 |
|
ijreview.com |
8 |
|
latimes.com |
7 |
|
gu.com |
7 |
|
ift.tt |
7 |
This snippet of the dataset shows just the first few rows, but we can already see some of the more popular results are URL-shortening services, such as bit.ly. We can also see that we are able to remove all those shortened URLs created by Twitter's own shortener, t.co, simply by using the display column rather than the main URL column.
In the next section, we can use these counts to build a bar graph, in a similar manner to the way we built a simple graph in Chapter 9, Stack Overflow Project.
Step five – visualizing the data
To build a little D3-enabled graph, we could follow the same procedure we used in Chapter 9, Stack Overflow Project, in which we made a PHP script that queries the database, and then our JavaScript uses the results as the live input to a bar graph. Alternatively, we could generate a CSV file with Python and let D3 generate its graph from those results. Since we already performed the PHP method in the previous chapter, let's use the CSV file method here, just for variety. This is also a good excuse to continue on with Python in this chapter, since this is already the language we have been using.
The following script connects to the database, selects out the top 15 most-used URLs and their counts, and writes the entire thing to a CSV file:
import csv
import MySQLdb
# Open database connection
db = MySQLdb.connect(host="localhost",
user="username",
passwd="password",
db="ferguson",
use_unicode=True,
charset="utf8")
cursor = db.cursor()
cursor.execute('SELECT left(tdisplay, LOCATE(\'/\',
tdisplay)-1) as url, COUNT(tid) as num
FROM ferguson_tweets_urls
GROUP BY 1 ORDER BY 2 DESC LIMIT 15')
with open('fergusonURLcounts.tsv', 'wb') as fout:
writer = csv.writer(fout)
writer.writerow([ i[0] for i in cursor.description ])
writer.writerows(cursor.fetchall())
Once we have this CSV file, we can feed it into a stock D3 bar graph template, just to see what it looks like. The following can be called buildBarGraph.html or the like:
Note
Make sure you have the D3 libraries in your local folder, just as you did in previous chapters, along with the CSV file you just made.
<!DOCTYPE html>
<meta charset="utf-8">
<!--
this code is modeled on mbostock's
"Let's Make a Bar Chart" D3 tutorial
available at http://bl.ocks.org/mbostock/3885304
My modifications:
* formatting for space
* colors
* y axis label moved
* changed variable names to match our data
* loads data via CSV rather than TSV file
-->
<style>
.bar {fill: lightgrey;}
.bar:hover {fill: lightblue;}
.axis {font: 10px sans-serif;}
.axis path, .axis line {
fill: none;
stroke: #000;
shape-rendering: crispEdges;
}
.x.axis path {display: none;}
</style>
<body>
<script src="d3.min.js"></script>
<script>
var margin = {top: 20, right: 20, bottom: 30, left: 40},
width = 960 - margin.left - margin.right,
height = 500 - margin.top - margin.bottom;
var x = d3.scale.ordinal()
.rangeRoundBands([0, width], .1);
var y = d3.scale.linear()
.range([height, 0]);
var xAxis = d3.svg.axis()
.scale(x)
.orient("bottom");
var yAxis = d3.svg.axis()
.scale(y)
.orient("left");
var svg = d3.select("body").append("svg")
.attr("width", width + margin.left + margin.right)
.attr("height", height + margin.top + margin.bottom)
.append("g")
.attr("transform", "translate(" + margin.left + "," + margin.top + ")");
d3.csv("fergusonURLcounts.csv", type, function(error, data) {
x.domain(data.map(function(d) { return d.url; }));
y.domain([0, d3.max(data, function(d) { return d.num; })]);
svg.append("g")
.attr("class", "x axis")
.attr("transform", "translate(0," + height + ")")
.call(xAxis);
svg.append("g")
.attr("class", "y axis")
.call(yAxis)
.append("text")
.attr("transform", "rotate(-90)")
.attr("y", 6)
.attr("dy", "-3em")
.style("text-anchor", "end")
.text("Frequency");
svg.selectAll(".bar")
.data(data)
.enter().append("rect")
.attr("class", "bar")
.attr("x", function(d) { return x(d.url) ; })
.attr("width", x.rangeBand())
.attr("y", function(d) { return y(d.num); })
.attr("height", function(d) { return height - y(d.num); });
});
function type(d) {
d.num = +d.num;
return d;
}
</script>
</body>
</html>
The resulting bar graph looks like the one shown here. Again, remember that we are using the test dataset so the numbers are quite small:
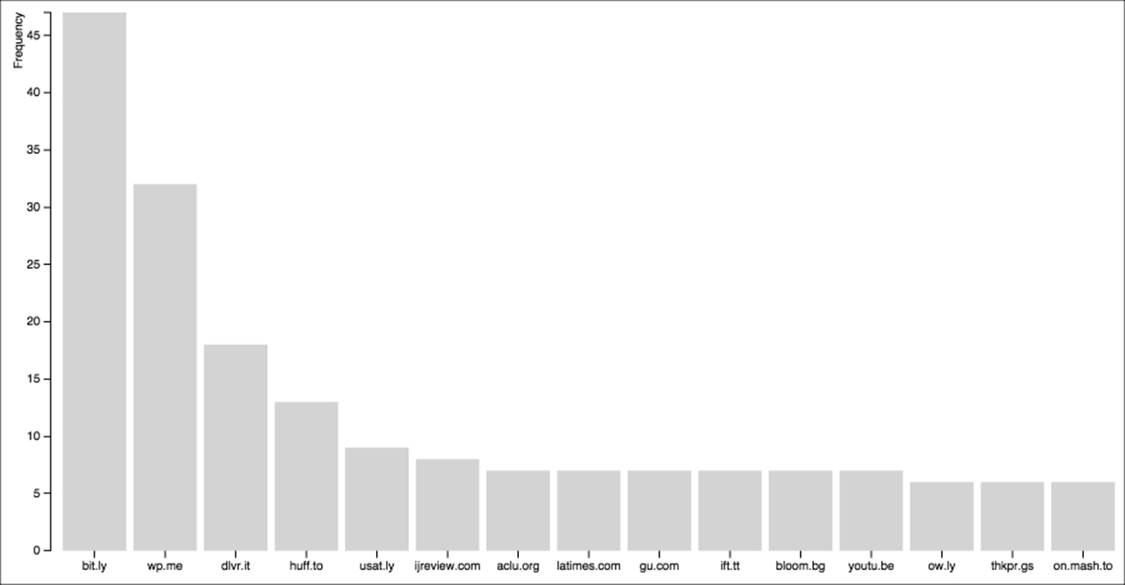
A simple bar graph drawn in D3 using our CSV file.
Step six – problem resolution
Since data visualization is not the main purpose of this book, we are not overly concerned with how sophisticated the diagram from the section is, and suffice it to say that there are many, many more interesting patterns to be uncovered in the Ferguson data set than just which URLs were pointed to the most. Now that you know how to easily download and clean this massive data set, perhaps you can let your imagination work to uncover some of these patterns. Remember that when you release your findings to your adoring public, you must not release the tweets themselves or their metadata. But you can release the tweet IDs, or a subset of them, if that is what your question required.
Moving this process into full (non-test) tables
Just like in Chapter 9, Stack Overflow Project, we made test tables so that we could develop our project in a stress-free environment with a manageable number of tweets to collect. When you are ready to collect the full list of tweets, be ready to spend some time doing so. Twitter's rate limits will kick in, and twarc will take a long time to run. Ed Summers indicates on this blog post that it will take about one week to run the Ferguson tweets: http://inkdroid.org/journal/2014/11/18/on-forgetting/. Of course, if you are careful, you will only have to run it once.
Another thing you could do to speed up the time it takes to hydrate the tweet IDs is to work as a team with someone else. You can divide the tweet ID file in half and each work on your portion of the tweets. During the data cleaning process, make sure you INSERT both into the same final database table.
Here are the steps we will follow to change our project to collect the full set of tweets rather than the 1,000-tweet sample:
1. Empty the ferguson_tweets, ferguson_tweets_hashtags, ferguson_tweets_mentions, and ferguson_tweets_urls tables as follows:
2. TRUNCATE TABLE ferguson_tweets;
3. TRUNCATE TABLE ferguson_tweets_hashtags;
4. TRUNCATE TABLE ferguson_tweets_mentions;
TRUNCATE TABLE ferguson_tweets_urls;
5. Run twarc on the full ids.txt file rather than the ids_1000.txt file as follows:
6. twarc.py --consumer_key abcd --consumer_secret abcd --access_token abcd --access_token_secret abcd --hydrate ids.txt > tweets.json
7. Re-run the jsonTweetCleaner.py Python script.
At this point, you will have a cleaned database full of tweets, hashtags, mentions, and URLs, ready for analysis and visualization. Since there are so many more rows now in each table, be aware that each of the visualization steps could take much longer to run, depending on what kind of queries you are running.
Summary
In this project, we learned how to reconstruct a list of tweets based on their identification numbers. First, we located high-quality archived tweet data that conforms to Twitter's latest ToS. We learned how to split it into a set small enough for testing purposes. Then, we learned how to hydrate each tweet into a full JSON representation of itself, using the Twitter API and the twarc command-line tool. Next, we learned how to extract pieces of the JSON entities in Python, saving the fields to a new set of tables in our MySQL database. We then ran some simple queries to count the most common URLs, and we drew a bar graph using D3.
In this book, we have learned how to perform a variety of data cleaning tasks, both simple and complex. We used a variety of languages, tools, and techniques to get the job done, and along the way, I hope you were able to perfect your existing skills while learning many new ones.
At this point, our final dinner party is complete, and you are now ready to begin your own cleaning projects in your fully stocked — and very clean — data science kitchen. Where should you begin?
· Do you like contests and prizes? Kaggle hosts frequent data analysis competitions at their website, http://kaggle.com. You can work alone or as part of a team. Many teams need clean data, so that is a fantastic way to pitch in.
· If you are more of a public service kind of person, may I suggest School of Data? Their website is at http://schoolofdata.org, and they host courses and Data Expeditions where experts and amateurs from around the world get together and solve real-world problems using data.
· To extend your data cleaning practice, I highly recommend getting your hands dirty with some of the many publicly-available data sets out there. KDnuggets has a nice list of them here, including some lists of lists: http://www.kdnuggets.com/datasets/.
· Did you like the Stack Overflow examples in Chapter 9, Stack Overflow Project? The Meta Stack Exchange, available at http://meta.stackexchange.com, is a site just for discussing the way StackExchange sites work. Users discuss hundreds of amazing ideas for how to query Stack Overflow data and what to do with what they find. Or, you can always contribute to the large body of questions on Stack Overflow itself that are related to data cleaning. Finally, there are several other Stack Exchange sites that are also related to data cleaning. One useful site is the Open Data Stack Exchange, available at http://opendata.stackexchange.com.
· Twitter data is extremely popular right now. If you liked working with Twitter data, consider taking our Chapter 10, Twitter Project, project to the next level by asking and answering your own questions about one of those publicly-available tweet collections. Or, how about collecting and curating a new set of tweet IDs of your own? If you build clean collections of tweet IDs on some topic of interest, you can distribute those and researchers and other data scientists will be extremely grateful.
Good luck in your data cleaning adventures, and bon apetit!
All materials on the site are licensed Creative Commons Attribution-Sharealike 3.0 Unported CC BY-SA 3.0 & GNU Free Documentation License (GFDL)
If you are the copyright holder of any material contained on our site and intend to remove it, please contact our site administrator for approval.
© 2016-2026 All site design rights belong to S.Y.A.