Learning Cypher (2014)
Chapter 4. Improving Performance
Using Neo4j has several advantages, including a very natural model that allows you to easily express complex schemas with a lot of relations as well as Atomicity, Consistency, Isolation, and Durability (ACID) transactions. It gives a great performance compared to relational databases.
Performance is a key feature in some scenarios and drives developers and architects to choose Neo4j. In this chapter, you will learn about:
· Several performance issues that you face while using Cypher and some possible solutions
· How to profile a Cypher query to estimate its computational cost and its cost in terms of number of times I/O is accessed
· How to use the schema to preserve the integrity of the database and take advantage of it to improve performance
Performance issues
We will focus on two common types of performance issues we face with Cypher. They are as follows:
· A long and complex query is executed too slow. The query can be a complex read-write query or a read-only query with aggregation, complex computations, and sorting.
· A small query is repeated many times, for example, in a loop cycle. The query itself does not underperform, but repeating it many times causes the whole operation to take a long time to finish.
Now, suppose that we have a huge database with a lot of nodes; for example, a database for a social network. In fact, if we are experiencing performance problems with small databases, we probably need to check the hardware, or the operating system, or the configuration of Neo4j because it's unusual to experience a very slow query with small datasets. In this chapter, we will see some configuration options of Neo4j that are useful when tuning the performance of the database.
To simulate performance issues, the example used in this chapter must have a lot of data. To fill our example database, we can create a number of nodes, with Neo4j Embedded, by writing some lines of the Java code in a loop. This is described in the following query:
for (int i = 0; i < 1000; i++) {
try (Transaction tx = graphDb.beginTx()) {
Node node = graphDb.createNode();
node.setProperty("email", "user" + i + "@learningcypher.com");
node.setProperty("userId", i);
node.addLabel(DynamicLabel.label("User"));
if(i % 100 == 0)
node.addLabel(DynamicLabel.label("Inactive"));
tx.success();
}
}
Each cycle, which is repeated 1000 times, creates a node, sets two properties (email and userId), and sets a label (User) to the node. The DynamicLabel.label("User") call allows us to specify a label without having to declare a statically-typed label implementation. Finally, after every 100 nodes, one node is set the Inactive label. Each step is executed in a transaction; this is a requirement as we are accessing the database. The problem here is that we have a lot of tiny transactions; every time we commit a transaction, Neo4j will access the disk to persist the data, leading to a performance overhead.
Alternatively, using any script language, you can generate a long Cypher query that joins a number of nodes to create then copy and paste the query in Neo4j Browser's prompt. This is described in the following query:
CREATE (:User {email: 'user0@learningcypher.com', userId: 0 }),
(:User {email: 'user1@learningcypher.com', userId: 1 }),
(:User {email: 'user2@learningcypher.com', userId: 2 }),
(:User {email: 'user3@learningcypher.com', userId: 3 }),
The preceding query will create the same data in a single transaction. Neo4j will save the data in the memory and will persist everything simultaneously at the end. The problem here is that the Cypher engine must parse and process a huge string to translate it into a real operation that will be performed on the database. In the next sections, we will see the performance issues we have found in these two approaches in detail and how to get rid of them.
In the code bundle, which can be downloaded for free from the Packt Publishing website (http://www.packtpub.com/support), you will find the whole script generated there as well as the Java project with the Neo4j embedded example code. We'll see these in the rest of the chapter so that you can set up the database that is used as an example in this chapter.
Tip
From Neo4j 2.1 onwards, bulk creations can be performed by reading from a comma-separated values (CSV) file with the following new clause:
LOAD CSV FROM "file.csv"
CREATE (:User{email: csvLine[0], userId: csvLine[1] })
Best practices and recommendations
You surely know the following famous quote from Donald Knuth, which is attributed to Tony Hoare:
"We should forget about small efficiencies, say about 97% of the time: premature optimization is the root of all evil. Yet we should not pass up our opportunities in that critical 3%."
The sense of the quote is that you should avoid writing obfuscated, unreadable, and error-prone code in order to gain an insignificant performance advantage, because the most important performance gain will be achieved only in 3 percent of your code. However, you should take precautions to not lose the opportunity to improve performance in that critical percentage.
In this section, we will talk about those precautions; we will see some general rules to avoid well-known performance issues with Cypher. If you follow all of them, you will reduce the probability of facing poor performances in your applications without affecting the readability of your Cypher queries.
Using parameterized queries
As you remember, in Chapter 1, Querying Neo4j Effectively with Pattern Matching, we introduced the usage of query parameters with Java. There we saw how query parameters can be useful to write readable and maintainable code. Yet, query parameters are a great ally to boost the performance of queries that are executed many times.
Consider, for example, the following simple query:
MATCH (n:User {email: 'user300@learningcypher.com'})
RETURN n
When you launch this query, the engine takes the query as a string literal. Now, it must parse the query, build an execution plan, and run it. An execution plan is a list of steps necessary to execute a query. In fact, as Cypher is a declarative language, when you write a query, you focus on results than on the operations needed to get them. However, this means that the Cypher engine must process the code and prepare a plan to achieve the result you want. Now, launch the same query with another e-mail ID, for example:
MATCH (n:User {email: 'user400@learningcypher.com'})
RETURN n
Then, the engine assumes that since the query is different, the plan could be different. So, the engine computes a new plan. However, this one will be the same as the previous query with only one difference: the e-mail ID of the user to be searched for.
Writing queries with parameters allows the engine to reuse the execution plan of a query because the engine can cache it. Instead, if you rewrite a new query multiple times, changing only some of the parameters each time, this period of time wasted becomes very important. If you are working with Neo4j embedded, you can use the parameters in a manner identical to the one explained in Chapter 1, Querying Neo4j Effectively with Pattern Matching. This is described in the following query:
import org.neo4j.cypher.javacompat.*;
import java.util.*;
ExecutionEngine engine = ...
Map<String,Object> params = new HashMap<>();
params.put("emailQuery", email);
ExecutionResult result = engine
.execute("MATCH(n:User {email: {emailQuery}}) RETURN n",
params);
You can estimate the performance gain of this code by launching it a number of times. In Java, one easy way to get the elapsed time is using the System.nanoTime() function. If you compare the time needed to run the previous query 2000 times with the time needed to run the same query without using parameters, you will have a result similar to the following on a common desktop machine:
MATCH(n:User {email: '" + email + "'}) RETURN n
duration: 11458.105746 ms
MATCH(n:User {email: {emailQuery}}) RETURN n
duration: 2014.814202 ms
The parameterized version is more than five times faster than the query with no parameters. It is more scalable as well. In fact, after running these queries 4000 times, you'll get a result that looks like the following:
MATCH(n:User {email: '" + email + "'}) RETURN n
duration: 20610.989327 ms
MATCH(n:User {email: {emailQuery}}) RETURN n
duration: 2450.090195 ms
Clearly, with the non-parameterized query, the time elapsed has almost doubled, while with the parameterized query, the time elapsed has raised only by 20 percent.
Parameterized queries with the REST API
Parameterized queries are also supported by the REST API, and, by using them, you will get a performance gain. In fact, the server will cache the execution plans of your queries and won't need to parse each of them, just as we saw in the previous section with queries in Neo4j embedded.
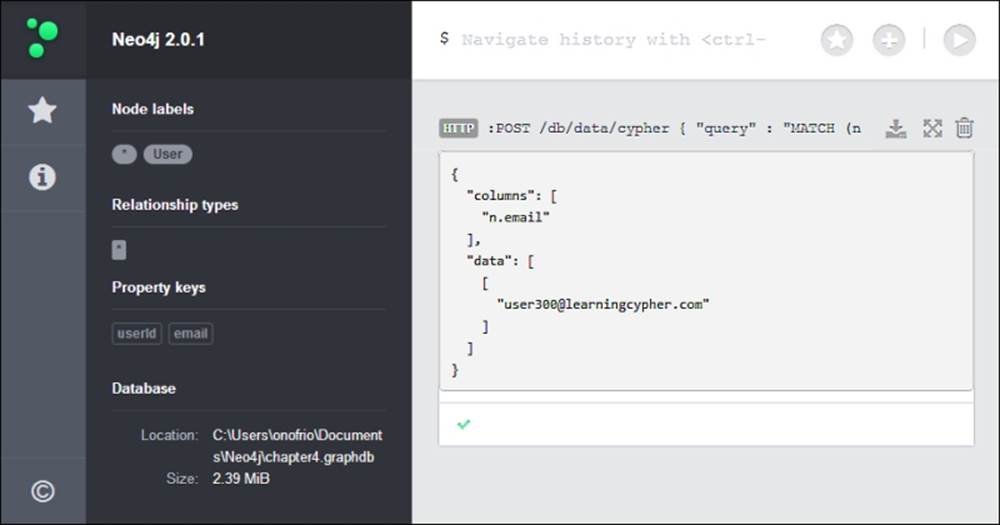
To use parameters with the REST API, just mention the values along with the query in the params member of the JSON code posted to the server, as described in the following query:
{
"query" : "MATCH (n {userId: {id}}) RETURN n.email",
"params" : {
"id" : 300
}
}
The preceding query searches the e-mail ID of a user in the database. The user ID (300) is passed in a parameter.
As usual, you can test it using any REST client or in Neo4j Browser, prepending the following command to the JSON code you want to send:
:POST /db/data/cypher
The result can be seen in the following screenshot:
Reusing ExecutionEngine
When you work with Neo4j Embedded, as execution plans of parameterized queries are cached by ExecutionEngine, it's crucial that you don't create a new engine for each query you launch. Rather, create one engine and use it as many times as possible.
You should avoid writing functions in the following manner:
public void dontWriteFunctionsLikeThis(String email) {
ExecutionEngine engine = new
ExecutionEngine(graphDatabaseService);
Map<String,Object> map = new HashMap<>();
map.put("email", email);
ExecutionResult result = engine
.execute("MATCH(n:User {email: {email} }) RETURN n", map);
// working with result
}
Instead, pass the engine in the constructor of the class and use it. This is described in the following query:
public class ReuseTheEngine {
private final GraphDatabaseService graphDatabaseService;
private final ExecutionEngine engine;
public ReuseTheEngine(
GraphDatabaseService graphDatabaseService,
ExecutionEngine engine) {
this.graphDatabaseService = graphDatabaseService;
this.engine = engine;
}
public ResourceIterator<Node> find(String email) {
Map<String,Object> map = new HashMap<>();
map.put("email", email);
ExecutionResult result = engine
.execute("MATCH(n:User {email: {email} }) RETURN n", map);
}
}
The class in the preceding code keeps the engine for the entire lifetime of the objects. It reuses the same engine every time the find method is invoked, ensuring that the engine caches execution plans.
Note that ExecutionEngine is thread safe, so you can create only one instance and share it among all the threads of your multithreaded applications as a singleton (otherwise, if you are using an inversion of control container, you can safely register the instance as a singleton in the container).
Finding the optimum transaction size
When you start a transaction and execute several operations within it, Neo4j does not persist the changes in the database but keeps them in memory. Neo4j will persist the changes only once you commit the transaction. This means that the more operations you put in a single transaction, the more memory Neo4j must allocate to keep them. This results, first of all, in a progressive decay in performance, but it can even cause the server to go out of memory.
If you experience a performance decay while executing a long transaction, you can monitor the heap usage to figure out whether the problem resides in the heap usage or not. One useful, visual, and free tool that you can use is Java VisualVM. It is provided with any Java Development Kit (JDK).
Tip
If you only have console access to the server that is hosting Neo4j, you can use jvmtop (https://code.google.com/p/jvmtop/), an open source console application to monitor all Java Virtual Machines (JVM) that are running on the machine.
To start the tool, launch the following code from the command-line interface:
# jvisualvm
Once the tool starts, a list of applications running on the JVM can be seen on the left-hand side of the window. When you select an application, you will see a set of statistical data on the right-hand side.
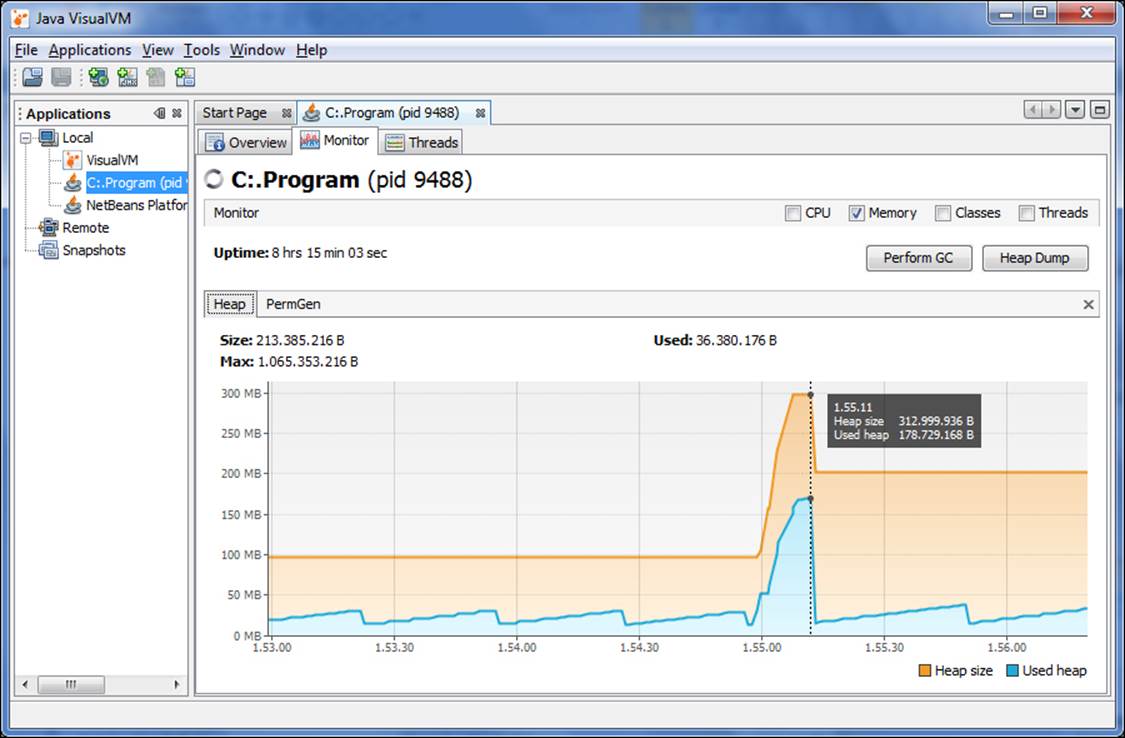
In the preceding screenshot, let's consider only the Memory usage, deselecting CPU, Classes, and Threads. Did you note the peak marked with a vertical dotted line? You will get that when you launch a big transaction by creating 4000 nodes and setting 8000 properties and 4000 labels. The heap usage has jumped from about 30 MB to about 180 MB, but it's still an acceptable load in that machine. Yet, when analyzing the statistics, you get to know that the heap usage is too much for your machine and is affecting the performance of your application, you have the following two options:
· You can increase the heap size reserved for JVM. In Neo4j Server, under Windows, you can edit the neo4j-community.vmoptions file and, for example, add the following line of code to set the heap size to 4 GB:
-Xmx4G
In Linux or Neo4j Server for Windows, you can edit the neo4j-wrapper.conf file in the Neo4j configuration folder. You will have to add the following line of code:
wrapper.java.initmemory=4096
It is noteworthy that increasing the Java heap size is an operation that should be performed with caution—you should be aware of the services that are running on the machine and of the hardware limitation. Increasing the JVM heap size, in fact, will affect the other running services, depriving them of the heap memory needed to run. In addition, while the heap size becomes increasingly larger, the garbage collector will take greater amounts of time to clean the heap. So, despite having infinite RAM at your disposal, there is an empiric limit to the heap size that will give you an effective performance gain. If you exceed this limit, you will have a decay in performance instead.
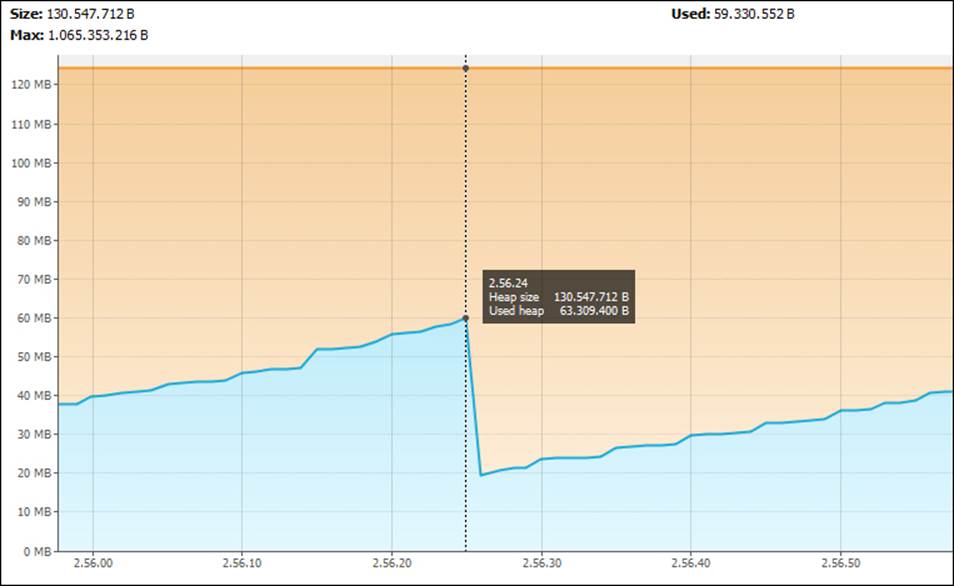
· You can split the transaction into smaller ones. Whether to split it or not and how to split it depends on the business logic of your application. Anyway, it is noteworthy that if you split the transaction described previously into 40 smaller transactions, you'll get the graph shown in the following screenshot in the same machine. This time, the heap reserved is less than half of the one used before, although you have done the same operations. You have just split it into more transactions.
Above all this, as changes are persisted into the disk only when the transaction is committed, writing too many smaller transactions will cause as many I/O writes, causing performance deterioration due to the disk being accessed too many times. This effect can be alleviated by having many disks installed on the machine and configuring RAID 0 or RAID 5, but generally speaking, merging a lot of tiny transactions is a more scalable solution.
Note that the REST API provides two ways to merge many operations in only one transaction. The following are the two ways:
· The first one is by opening a transaction across multiple HTTP requests.
1. To open a transaction, you have to post a payload to the /db/data/transaction endpoint. An example payload could be the following:
2. {
3. "statements": [ {
4. "statement": "CREATE(n:User{email: {email}}) ",
5. "parameters": { "props" : {
6. "email": "user1@learningcypher.com"
7. }
8. }
9. } ]
}
10. The server will return the JSON code answer with a property named commit that contains the endpoint to invoke to commit the transaction. The result will be as follows:
11.{
12. "commit" : "http://localhost:7474/db/data/transaction/32/commit",
13. "results" : [ {
...
14. By sending a statement payload, like the previous one, to the http://localhost:7474/db/data/transaction/32 endpoint, you'll perform queries in that transaction.
15. By sending a statement to the commit endpoint, you'll get the server to commit all changes made in that transaction.
· The second one is by using batch operations. Batch operations allow you to merge multiple REST API calls in only one call, which is executed atomically. You have to invoke the db/data/batch endpoint with a payload built with multiple REST API calls serialized in the JSON code. Every call must have an ID. This is described in the following code snippet:
· [ {
· "method" : "PUT",
· "to" : "/cypher",
· "body" : {
· "query" : "CREATE(n:User{email: {email}})"
· },
· "id" : 0
· },
...
Avoiding unnecessary clauses
Both DISTINCT and ORDER BY clauses can be very slow on large datasets because they scan the whole dataset and execute comparisons to sort or to distinguish unique values. You should avoid using them when it is not necessary. The ORDER BY clause in Cypher is optimized for performance so that only the final dataset (which is typically a lot smaller) is handled by the Cypher engine and ordered. The DISTINCT clause, on the other hand, can also be used in the middle of a query; so, it can act on large datasets. To clarify, let's see an example.
Suppose that the users of our social network can join groups, namely communities for users interested in certain topics. A group is a node with the Group label and has a name string property. This is shown in the following screenshot:
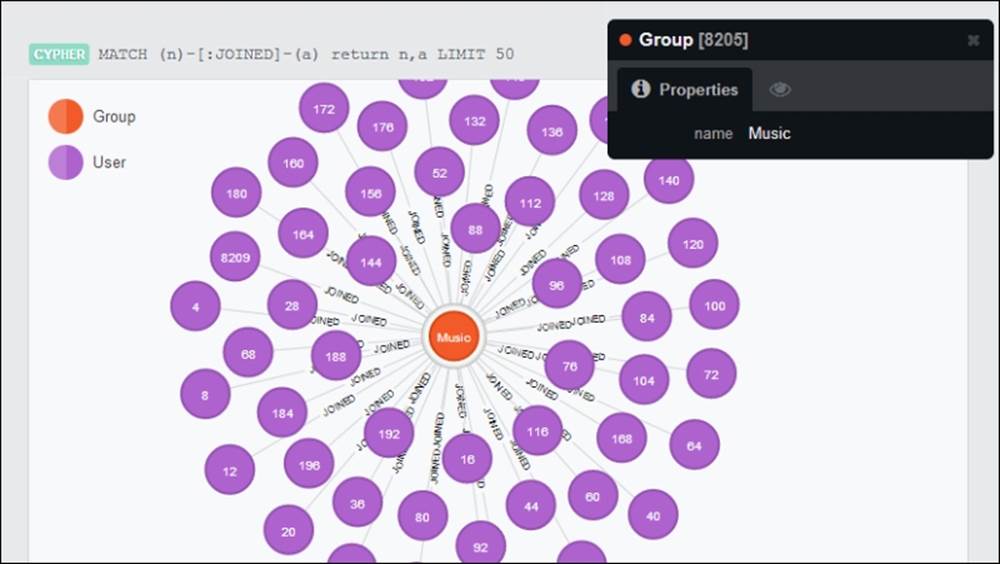
Graph visualization: some users (50) that joined the Music group
Now consider the following query:
MATCH (user:User) -[:JOINED]- (group:Group)
WITH DISTINCT user, group
RETURN group.name, COUNT(user)
This is a report about the size of each group according to the number of users who joined the group. It first looks for users related to any group, then takes the distinct user-group pairs, and finally counts the users per group name. For several reasons, this query can easily become very slow in a huge dataset. It is not scalable. Note the DISTINCT keyword in the middle of the code; maybe the person who wrote this query thought that it was necessary to consider only one user-group pair and not duplicated relationships. However, if in our application, a user can join a group only once, then the DISTINCT keyword is useless and is much expensive in terms of performance. This is because it forces the engine to run through the entire dataset and takes only distinct values. Therefore, it's important that you structure your queries so that the engine works with as little data as possible.
Specifying the direction of relationships and variable length paths
Another important point when making the graph is to ensure that data does not require expansive query operations, and then take advantage of the structure to avoid those expansive query operations. In fact, let's continue working on the same dataset and consider the following query:
MATCH (user:User) -[:JOINED*]- (group:Group)
WITH user, COUNT(group) as countG
RETURN avg(countG)
This is a report of the average number of groups joined per user. The query considers all users connected to any group through a variable length path of the JOINED type, then counts the number of groups per user, and finally returns the average of this number.
There are two improvements that can be done to this query to improve the performance, and they both are in the first row. The first issue is that the direction of the JOINED relationship is not specified. This means that the Cypher engine must traverse the graph to search both users that joined any group and groups that joined any user. However, clearly the latter does not make any sense and, in fact, the Cypher engine won't find any such groups. This is because in our application, users can join groups but never vice versa. So, we can improve the query by specifying the direction of the relationship, for example, MATCH (user:User) -[:JOINED*]-> (group:Group).
The second issue is the variable length path (*) in the relationship pattern. The variable length path mentioned here is useless in our application if the JOINED relationship can involve only users and groups, and its direction can be only from a user to a group. In fact, if you look at the preceding screenshot, you will see that every path between a user and a group with a relationship of the JOINED type will only have length of one. Therefore, we can safely remove the variable length path. This is described in the following query:
MATCH (user:User) -[:JOINED]-> (group:Group)
WITH user, COUNT(group) as countG
RETURN avg(countG)
This is a huge improvement because the variable length path searches can be really slow operations in huge datasets. This is because the Cypher engine must match the path with a complex pattern. By running each query 2000 times and comparing the time elapsed, you'll get a result as shown in the following output code (of course, the exact time duration depends on the speed and the state of your machine):
Group count average - naive
duration: 90109.287146 ms
Group count average - optimized
duration: 63804.844214 ms
The latter query is almost 30 percent faster. This doesn't mean that you shouldn't use variable length relationship patterns at all. However, while working with huge datasets, you must use them with caution to avoid performance issues.
Generally speaking, when you face a performance issue, what you can do is use your knowledge about the domain of your application and reduce the work for Cypher. This is one reason why profiling your queries is so important, and it is the topic of the next section.
Profiling queries
When we have users who complain of poor performance, the first step is profiling our application. Nowadays, every programming language can be profiled to look for the cause of poor performance. It's an important step because it lets us focus only on the correct cause of the performance decay that the users are experiencing. The risk, in fact, is to go on a wild goose chase, trying to optimize functions and queries that don't affect the whole performance of the application in a relevant way. Above all, we do not have an objective measure of the improvements that we get.
Therefore, suppose that we use a profiler, that is specific to our programming language (either Java, PHP, Ruby, or anything else), and we found that the code executing the following query is very slow:
MATCH(n:User {email:'user300@learningcypher.com'})
RETURN n
We need a way to profile this query to understand the operation made by the Cypher engine and its performance cost so that we can act to reduce the whole cost.
Profiling using the Java API
If we were working with Neo4j Embedded, we would have a code that looks like the following:
import org.neo4j.cypher.javacompat.ExecutionEngine;
import org.neo4j.cypher.javacompat.ExecutionResult;
// ... more code
String query = "MATCH(n:User {email: {emailQuery}}) RETURN n";
Map<String,Object> params = new HashMap<>();
params.put("emailQuery", "user300@learningcypher.com");
ExecutionResult result = engine.execute(query, params);
Neo4j provides a way to evaluate the performance of a query. The ExecutionEngine class has the profile method, which returns an ExecutionResult object with profiling statistics. Invoke it in the same way you call the execute object. This is described in the following code snippet:
ExecutionResult result = engine.profile(query, params);
The only difference is that we can now invoke the executionPlanDescription method of the ExecutionResult object. This method is always present in the ExecutionResult class but can be invoked only once the query is profiled, not when the query is merely executed; calling this method after an execute call will cause an exception to be thrown. Now, consider the following query:
result.dumpToString();
PlanDescription planDescription =
result.executionPlanDescription();
We called the dumpToString function before accessing the execution plan because it is available only after the result is enumerated. From Chapter 1, Querying Neo4j Effectively with Pattern Matching, you will remember that the ExecutionResult instance can be enumerated in three ways: via either the dumpToString or columnAs functions or an iterator function. Whichever you use is fine, you just need to enumerate the result before requesting the execution plan.
Inside the execution plan description
The execution plan informs us about the operations made by the execution engine to perform our query. We can dump the string representation of the plan. This is described in the following code snippet:
System.out.println(res.executionPlanDescription().toString());
For the MATCH(n:User {email: {emailQuery}}) RETURN n query, we get the following result:
Filter(pred="Property(n,email(0)) == {emailQuery}", _rows=1, _db_hits=1000)
NodeByLabel(identifier="n", _db_hits=0, _rows=1000, label="User", identifiers=["n"], producer="NodeByLabel")
What can we gather from this result? We have the following two steps:
· NodeByLabel: This step means that the Cypher engine selected all nodes using a label; the label of course is User and the identifier to match is n. This operation processed 1000 rows (all the users we have in our database). A very important information is the number of database hits. This represents the number of the potential disk accesses to perform this step; the greater the number, the worse is the performance of the query.
· Filter: This step represents the filtering operation on the set that was returned by the previous operation. This has 1000 database hits.
So, the problem in this query resides in the way we are filtering our dataset.
Profiling with Neo4j Shell
Neo4j Shell is a great tool to monitor and interact with a running Neo4j Server. It can be used for profiling by performing the following steps:
1. In Windows, to start the shell, you have to launch the Neo4jShell.bat file in the bin folder of the Installation folder, while in Linux, you have to launch the neo4-shell bash script.
Note
Neo4j Shell is not provided with the Windows installer of the Neo4j Community. To get it, you have to download the .zip binary from http://www.neo4j.org/download/other_versions.
2. Once it is started and ready, Neo4j Shell shows a command prompt. It supports many commands. You can get a list of them by typing help.
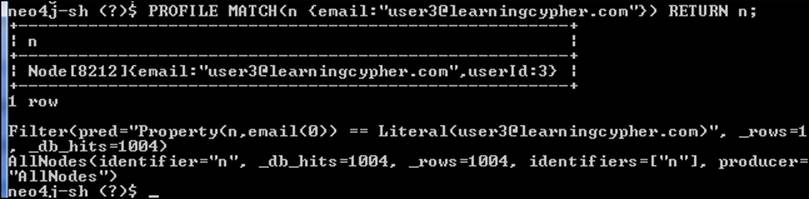
3. Using the profile command, you can instruct Neo4j Shell to perform a Cypher query, dump the result to the screen, and show the execution plan of the query. The syntax is simple: profile <query>;. For example, typing in the following command will give the result shown in the following screenshot. Note that you have to put the semicolon after the Cypher query to mark the end of the command:
profile MATCH(n{email:"user30@learningcypher.com"}) RETURN n;
Profiling with the REST API
To obtain the execution plan and statistics, the POST request that is made to the server must be changed. We need to enable the profile option by setting it to true in the request. Our new POST request is /db/data/cypher?profile=true.
You can try it in any REST client or in Neo4j Browser. In the prompt, type in the following code:
:POST /db/data/cypher?profile=true {
"query": "MATCH(n:User {email: {emailQuery}}) RETURN n.userId",
"params": {
"emailQuery": "user300@learningcypher.com"
}
}
The only difference between the preceding query and the query in the Profiling using the Java API section is that in the preceding query, only the userId property is returned. The intention is to reduce the length of the output and reduce the bandwidth occupied by the response. The following JSON code is the result:
{
"columns": ["n.userId"],
"data": [[300]],
"plan": {
"name": "ColumnFilter",
"args": {
"symKeys": ["n", "n.userId"],
"returnItemNames": ["n.userId"],
"_rows": 1,
"_db_hits": 0
},
"rows": 1,
"dbHits": 0,
"children": [{
"name": "Extract",
"args": {
"symKeys": ["n"],
"exprKeys": ["n.userId"],
"_rows": 1,
"_db_hits": 1
},
"rows": 1,
"dbHits": 1,
"children": [{
"name": "Filter",
"args": {
"pred": "Property(n,email(0)) == {emailQuery}",
"_rows": 1,
"_db_hits": 1000
},
"rows": 1,
"dbHits": 1000,
"children": [{
"name": "NodeByLabel",
"args": {
"identifier": "n",
"_db_hits": 0,
"_rows": 1000,
"label": "User",
"identifiers": ["n"],
"producer": "NodeByLabel"
},
"rows": 1000,
"dbHits": 0,
"children": []
}]
}]
}]
}
}
The first property (columns) contains the column names of the data returned as result. The second property (data) contains the result of the query, while the third property (plan) stores the execution plan.
You may have noticed that here we have the same steps as in the Java API and two more steps: Extract and ColumnFilter. They are related to the fact that we are returning only one property, not the whole node. Anyway, they are not important now because they generate a minimal number of database hits. The following screenshot shows how we can invoke the REST API:
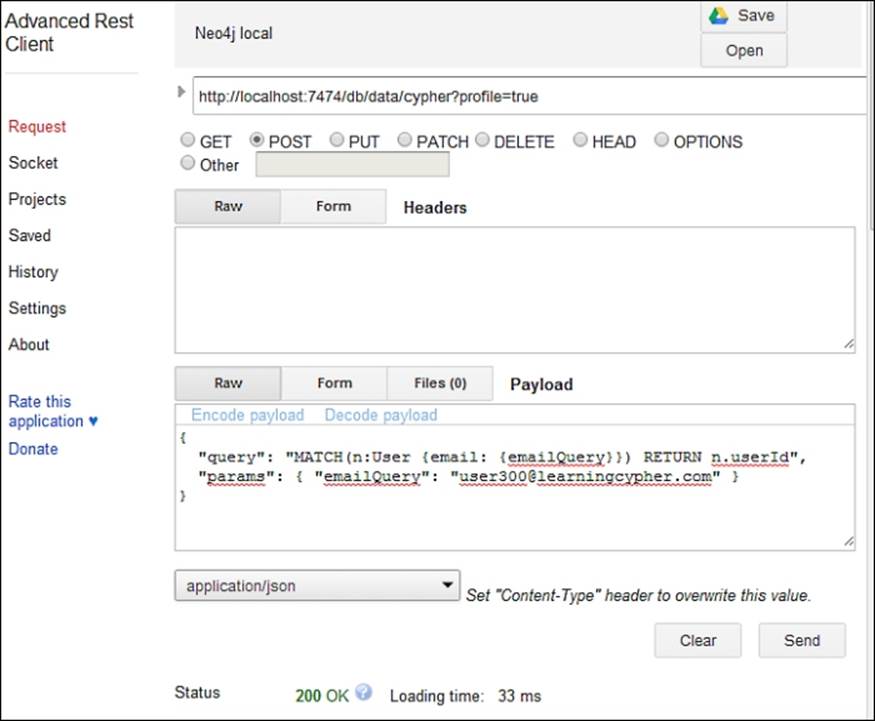
Invoking the REST API with Advanced REST client, a Chrome plugin
Indexes and constraints
Clearly, getting all nodes and filtering them is not the best way to find a node. Every worthy database, just like Neo4j, allows you to create indexes in order to find data quickly.
From Version 2.0, in Neo4j, there is a new and recommended type of index, that is, a label index. These are the only indexes supported by Cypher. Therefore, let's create an index for users based on the email property. We only need to execute the following query:
CREATE INDEX ON :User(email)
As this operation of creating an index is asynchronous, we must wait for the indexes to be built and go online. A timeout of one minute for 1000 items should be enough on any modern machine. This is described in the following query:
try (Transaction tx = graphDb.beginTx()) {
Schema schema = graphDb.schema();
schema.awaitIndexesOnline(1, TimeUnit.MINUTES);
}
Note
Waiting for an index to go online can be done only with either the Java API or Neo4j Shell at the moment. This means that if you are using the REST API, you have to wait a reasonable interval of time while the server builds the index. Clearly, if you create the index before inserting any data, the index creation will be immediate and data will be indexed automatically.
Once the index is online, we can run the profiler again and dump the plan. This time, we get only one row, as shown in the following output code:
SchemaIndex(identifier="n", _db_hits=0, _rows=1, label="User", query="{emailQuery}", identifiers=["n"], property="email", producer="SchemaIndex")
Now, we have only one operation: SchemaIndex. It has no database hits and only one row is processed instead of 1000 database hits. This is a big improvement!
Note
Deleting an index from the database can be done with the DROP INDEX command. The syntax is similar to the CREATE INDEX command, as illustrated in the following query:
DROP INDEX ON :User(email)
SCAN hints
Now, let's see another example that allows us to introduce a new keyword. Suppose that we have a certain number of inactive users in our social network; let's say 10. We express inactive users with the Inactive label. The query to get all the inactive users could be the following:
MATCH (n:User:Inactive)
RETURN n
The execution plan of this query is shown in the following code:
Filter(pred="hasLabel(n:Inactive(2))", _rows=10, _db_hits=0)
NodeByLabel(identifier="n", _db_hits=0, _rows=1000, label="User", identifiers=["n"], producer="NodeByLabel")
This means that the query is executed in two steps. They are as follows:
· In the first step, NodeByLabel, all nodes labeled User are read, which in this case is 1000 rows
· The inactive users are then filtered from the set of nodes
Note that if we invert the labels, we would read only 10 rows. The USING SCAN keyword allows you to specify the label to be scanned first. This is described in the following query:
MATCH (n:User:Inactive)
USING SCAN u:Inactive
RETURN n
The execution plan now becomes the following:
Filter(pred="(hasLabel(n:User(1)) AND hasLabel(n:Inactive(2)))", _rows=10, _db_hits=0)
NodeByLabel(identifier="n", _db_hits=0, _rows=10, label="Inactive", identifiers=["n"], producer="NodeByLabel")
As expected, now we are reading only 10 rows instead of 1000 rows.
Index hints
When you write a query, Cypher will use indexes, if possible, in order to maximize the performance of the query. Therefore, usually you won't need to specify whether or not and to use an index and which one to use. Anyway, you can specify the indexes to be used to make sure that the index is used in the query. Look at the following example query:
MATCH(n:User)
USING INDEX n:User(email)
WHERE n.email = {emailQuery}
RETURN n.userId
This query makes sure that the index on the email property is used for searching. If the index is not present or cannot be used in the query as is, an error will be returned. Note that the USING INDEX clause must be specified before the WHERE clause that is used to filter users.
To sum up, you can put the USING INDEX instruction in the query when you want a certain index to be used.
Constraints
Another interesting feature of Neo4j from Version 2.0 is the ability to create a uniqueness constraint on a specific property in a certain label. Consider the following query:
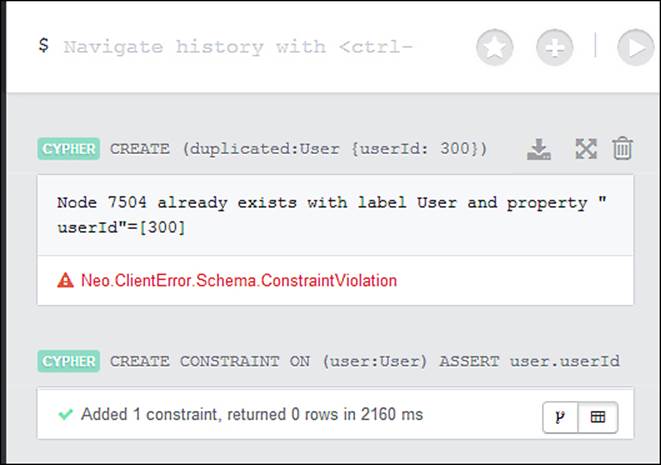
CREATE CONSTRAINT ON (user:User)
ASSERT user.userId IS UNIQUE
The preceding code ensures that there won't be two co-existing nodes that have the label User and the same user ID. If you try to create a User node with the same user ID of an existing node in the database, the database will generate an error, as shown in the following screenshot:
Of course, this feature is useful to guarantee the integrity of your data if your application identifies users by their user ID. You might wonder why we are talking about constraints in this chapter. The reason is because when you create a constraint, Neo4j automatically creates an index on the constrained property. In fact, try to create the index after you create the constraint with the following query:
CREATE INDEX ON :User(userId)
Now, you will get an error that informs you that the index already exists. The following result is shown:
Already constrained CONSTRAINT ON ( user:User ) ASSERT user.userId IS UNIQUE.
Clearly, you can delete the old index and create a new constraint instead.
All in all, if you have a property that must be unique in a labeled set of nodes, create a uniqueness constraint. Besides having your data integrity guaranteed by the database, you will gain a significant performance advantage due to the index that is created along with the constraint.
Summary
In this chapter, the focus was on Cypher performance. In the first section, we learned some best practices and several tips to avoid common performance pitfalls. Then, we learned how to read the execution plan of a Cypher query. Finally, we introduced a new feature of Neo4j 2.0: the schema. Although it is still work in progress, it can be very useful in our applications, both to preserve the integrity of our data and to assure good levels of performance.
At this point, you should know how to analyze an expensive query and how to profile it to recognize the reason of the performance decay. You should be able to change the query in order to improve its performance.
In the next chapter, we will learn, through a real-world application, how to migrate a relational database and its related SQL queries to Neo4j and Cypher.
All materials on the site are licensed Creative Commons Attribution-Sharealike 3.0 Unported CC BY-SA 3.0 & GNU Free Documentation License (GFDL)
If you are the copyright holder of any material contained on our site and intend to remove it, please contact our site administrator for approval.
© 2016-2026 All site design rights belong to S.Y.A.