Emerging Trends in Image Processing, Computer Vision, and Pattern Recognition, 1st Edition (2015)
Part I. Image and Signal Processing
Chapter 10. A study on the relationship between depth map quality and stereoscopic image quality using upsampled depth maps
Saeed Mahmoudpour; Manbae Kim, manbae@kangwon.ac.kr Department of Computer and Communications Engineering, Kangwon National University, Chunchon, Gangwon, Republic of Korea
Abstract
Recent advances in 3D technology have made the need for reliable quality evaluation of synthesized virtual views. Using RGB image and the corresponding depth map, a synthesized view can be constructed. Depth map upsampling has gained much interest following the release of time-of-flight cameras. As upsampling can yield artifacts on sharp edges like ringing artifacts and jagged edges near the depth map boundaries, it will degrade the final reconstructed stereoscopic image quality. In this article, several upsampling methods are applied to depth maps. Then, diverse full-reference and no-reference quality assessment tools are utilized to measure the quality of depth maps obtained from selected upsampling approaches. Furthermore, subjective test is performed to determine the quality of stereoscopic images reconstructed from upsampled depth maps. Finally, the relation between subjective assessment and each objective quality assessment is investigated using correlation coefficients. The evaluation results introduce the objective quality assessment tools that can correctly render human judgement.
Keywords
Correlation
Depth map
Stereoscopic image
Subjective assessment
Upsampling
1 Introduction
The attractive 3D video applications such as 3D television (3DTV) and free-view point-video (FVV) have led to numerous researches in 3D video display technologies. Using depth information of the scene, user can experience 3D perception on 3DTV and FVV enables users to choose the desired scene view point interactively. Despite of rapid advances in 3D technology, the quality evaluation of 3D contents without a full subjective test is still difficult and human viewers are needed to judge the quality of images or videos that is a costly and time consuming task. Objective quality assessment tools like peak signal-to-noise ratio (PSNR) and structural similarity index measure (SSIM) can evaluate the 2D image quality much faster without human interference and can be implemented in a machine. Therefore, a reliable objective quality assessment tool for 3D applications is desirable. However, besides visual quality that represents the image quality regardless of depth information, several other aspects like depth quality, naturalness, visual fatigue, and discomfort should be taken into account for 3D quality evaluation [1]. As these 3D aspects are still under investigation [2,3] and in the absence of a reliable 3D quality metric, different studies attempted to evaluate the 3D quality by considering depth map properties [4,5].
Bosc et al. [6] examined the reliability of 2D image metrics in 3D evaluation considering the artifacts of stereoscopic images generated from seven different depth image-based rendering (DIBR) algorithms. Considering the results, they proposed objective measurements based on analysis of shift of the contours and mean SSIM score. To investigate the correlation between depth map quality as a grayscale image and 3D video quality, different probable artifacts are applied to depth maps in Ref. [7]. In other similar research [8], the performance of three quality metrics including PSNR, SSIM, and video quality metric on coded stereoscopic images is compared with subjective test.
In this research, subjective quality assessment is utilized to measure the effect of artifacts generated from different depth map upsampling approaches on the final reconstructed stereoscopic image. Image upsampling is the method of increasing spatial resolution of images and depth map upsampling is of great importance in 3D applications. The high-speed time-of-flight cameras extract reliable depth maps. However, the spatial resolution of depth maps is relatively low in comparison with original images. Therefore, diverse depth map upsampling approaches are provided to obtain high-resolution depth maps. Also, it is important to evaluate the upsampling quality in order to realize upsampling performance on 3D content quality.
In this article, test depth maps are upsampled using seven well-known upsampling algorithms as each method can yield different artifacts. Then, the quality of each upsampled depth map is evaluated using different objective image quality assessment (IQA) tools. Also, the subjective quality assessment is used to evaluate the effect of depth map upsampling artifacts on the reconstructed stereoscopic image quality. Investigating the similarity between 2D quality evaluation and 3D perception, we will search for the most accurate IQA tool(s) for 3D quality evaluation. Using the proper automatic objective IQA tool will help to predict the quality of 3D image without using the expensive subjective test and even free of watching the stereoscopic image.
Since it is difficult to investigate all methods, seven approaches are selected to be utilized in this work. The bilinear upsampling uses average weighted of four neighboring pixels for interpolation to achieve upsampled depth map. A similar method called bicubic upsampling (BCU) is based on 16 neighboring pixels. The bilateral upsampling (BU) [9] is a prevalent approach that combines a spatial filter and a range filter to preserve the edge regions in upsampling process. Another upsampling method based on the BU is joint bilateral upsampling (JBU) [10] which utilizes both a color data and its low-resolution depth map. The variance-based upsampling (VBU) [11] avoids the usage of the constant variance by computing a variance for each pixel block. The disadvantage of the JBU is that it is sensitive to homogeneous regions and the weighting function can be assigned a wrong variance in nonedge regions. To solve this problem, an adaptive bilateral upsampling method (ABU) [12] has been proposed, where a large weight is assigned to color image at edge pixels and a large weight is assigned to depth data at nonedge pixels. To overcome the limitation in reducing blur at low-gradient edge regions in prior methods, a distance transform-based bilateral upsampling (DTBU) [13] has been proposed.
The Pearson, Spearman, and Kendall correlations are three proper approaches for similarity measurement between each objective assessment result and the subjective IQA. Comparing the objective and subjective scores, it will be inferred that which objective IQA tools show the most correspondence with human judgment and have superiority for 3D quality assessment. DIBR or 2D + Depth is used to generate a stereoscopic image. Figure 1 shows the overall framework that examines the relation between upsampling methods and 3D perception.
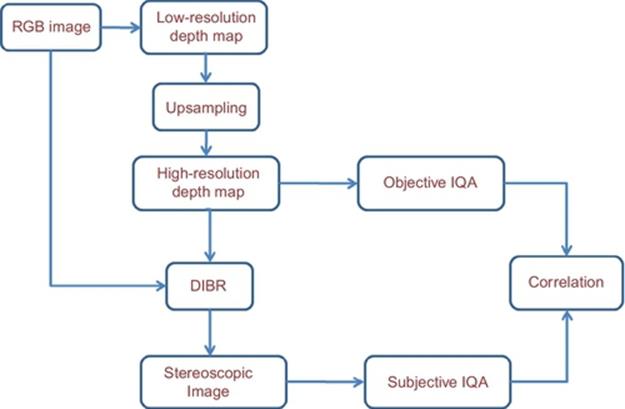
FIGURE 1 The flow diagram of experiment.
This article is organized as follows. In Section 2, different IQA tools considered in this work are described. Section 3 presents the subjective quality assessment methodology and the experimental results are provided in Section 4. Finally, we summarize our work in Section 5.
2 Objective quality assessment tools
Full-reference image quality assessment (FR IQA) compares test and reference images, therefore, both ground-truth and upsampled depth map are needed. The no-reference/blind image quality assessment (NR IQA) refers to quality assessment of images by an algorithm where only the distorted image is accessible and no information about the reference image is available. In this article, several FR IQA and NR IQA tools are used to evaluate the performance of different upsampling methods. The quality metrics are introduced in the following section:
2.1 FR IQA Tools
2.1.1 Peak signal-to-noise ratio
PSNR is one of the most prevalent tools for image quality evaluation defined by the following equation:
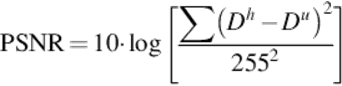 (1)
(1)
where Dh and Du are ground-truth and upsampled depth maps, respectively.
2.1.2 Structural similarity index measure
A sophisticated tool for image quality evaluation is SSIM [14] that measures the similarity between two images and considered to be correlated with the quality perception of the human visual system (HVS). SSIM principle is based on the modeling any image distortion as a combination of luminance distortion, contrast distortion, and loss of correlation. SSIM value for two images f and g is expressed by
![]() (2)
(2)

where l(f,g), c(f,g), and s(f,g) are luminance, contrast, and structure comparison functions, respectively. σf and σg denote standard deviations, μf and μg are mean values and σfg is covariance. C1, C2, and C3 are positive constants added to avoid a null denominator. The SSIM is a value between 0 and 1 that higher value shows more similarity.
2.1.3 Visual information fidelity
Visual information fidelity (VIF) [15] is a full-reference image quality metric that uses information theoretic criterion for image fidelity measurement. In an information-theoretic framework, the information that could ideally be extracted by the brain from the reference image and the loss of this information to the distortion are quantified in VIF method using natural scene statistics (NSS), HVS, and an image distortion (channel) model. The VIF is derived from a quantification of two mutual information quantities: the mutual information between the input and the output of the HVS channel when no distortion channel is present (called the reference image information) and the mutual information between the input of the distortion channel and the output of the HVS channel for the test image. Similar to SSIM, the assessment result is represented using a value between 0 and 1.
2.2 NR IQA Tools
2.2.1 Sharpness degree
Sharpness degree [16] is used to represent the extent of sharpness of the image and is defined by the following equation:
 (3)
(3)
where
![]()
2.2.2 Blur metric
Another tool for measuring blur attempts to obtain the spread of the edges. First, an edge detector (e.g., a Sobel edge detector) is applied to a grayscale image. We scan each row of the image for pixels corresponding to an edge location. The start and end positions of the edge are defined as the locations of the local extrema closest to the edge. The spread of the edge is then given by the distance between the end and start positions and is identified as the local blur measure for this edge location. The global blur measure for the whole image is obtained by averaging the local depth values over all edges found [17]:
![]() (4)
(4)
2.2.3 Blind image quality index
Blind image quality index (BIQI) [18] identifies the likeliest distortion in the image and then quantifies this distortion using an NSS-based approach. Given a distorted image, the algorithm first estimates the presence of a set of distortions in the image that consists of JPEG, JPEG2000, white noise, Gaussian Blur, and Fast fading. The amount or probability of each distortion in the image is denoted as pi {i = 1,2,…,5}. The method performs quality assessment in two stages. This first stage is a classification and the second stage attempts to evaluate the quality of the image along each of these distortions. The quality of the image is then expressed as a probability-weighted summation:
 (5)
(5)
where qi {i = 1,2,…,5} represents the quality scores from each of the five quality assessment algorithms (corresponding to the five distortions).
2.2.4 Natural image quality evaluator
Natural image quality evaluator (NIQE) [19] is a completely blind image quality analyzer that only uses measurable deviations from statistical regularities observed in natural images, without training on human-rated distorted images. Unlike current general purpose NR IQA algorithms which require knowledge about anticipated distortions in the form of training examples and corresponding human opinion scores, NIQE uses a quality aware collection of statistical features based on the simple and successful space domain, the NSS model. These features are derived from a corpus of natural, undistorted images.
The quality scores for both BIQI and NIQE are expressed by a value between 0 and 100 (0 represents the best and 100 the worst quality).
3 3D Subjective Quality Assessment
During the subjective quality evaluation, the quality of each reconstructed stereoscopic image is rated by observers according to double stimulus continuous quality scale subjective test, as described in the International telecommunication union’s recommendation on subjective quality assessment [20]. Fifteen nonexpert observers are participated in this experiment. In the first stage, original stereoscopic images were displayed to each participant for 10 s and another stereoscopic image made by an upsampled depth map for the same period of time. For each image data, similar viewing was carried out in order to examine the 3D perception. Depth perception is subjectively judged based on scales of 1 (bad), 2 (poor), 3 (fair), 4 (good), and 5 (excellent) in terms of 3D perception.
To detect outliers, a rejection analysis was performed on subjective results. An observer rating is considered as outlier if the correlation between Mean Opinion Score (MOS) and subject’s rating results for all images is less than 0.7. According to correlations, there were no outliers among subjects.
4 Experimental results
The quality performance of the 7 upsampling methods is evaluated using 10 test depth maps from Middlebury stereo dataset [21]. The test RGB images and related depth maps are shown in Figure 2. In order to obtain low-resolution depth maps, the original data are downsampled to lower resolution first and then the high-resolution depth maps are constructed using seven upsampling methods (Figure 3).
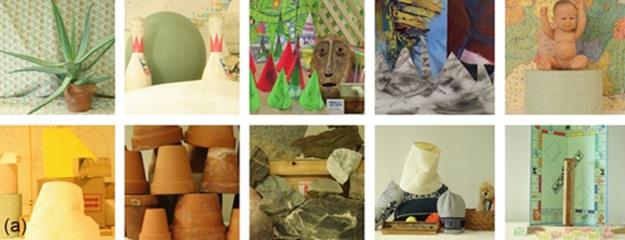
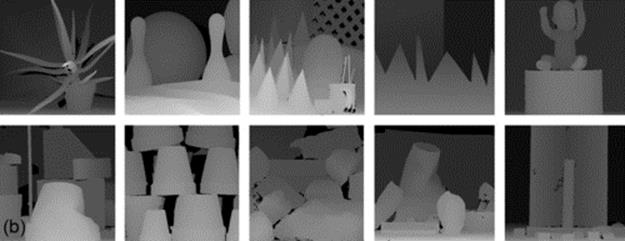
FIGURE 2 (a) Test RGB and (b) depth maps provided by Middlebury.
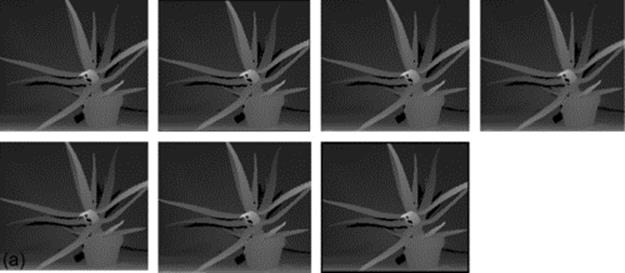
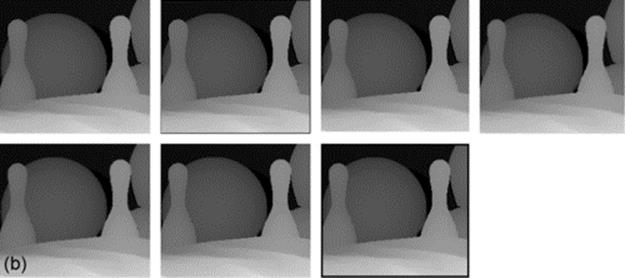
FIGURE 3 Upsampled depth maps of aloe (a) and bowling (b) obtained by BLU, BCU, BU, DTBU, JBF, ABU, and VBU in the scan order.
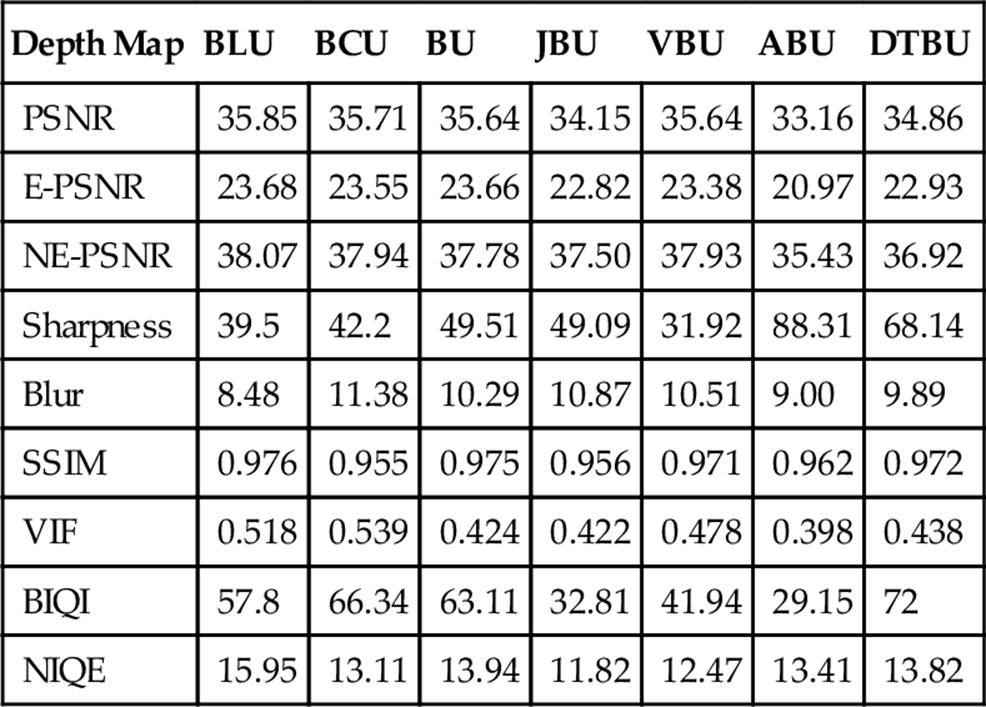
Table 1 represents the average subjective quality score of each upsampling method and Table 2 shows the mean scores of different objective quality metrics on upsampled depth maps. The results are derived from averaging the quality scores of the collection of 10 images. As upsampling artifacts are important in edge locations, edge PSNR (E-PSNR) and nonedge PSNR (NE-PSNR) are also computed.
Table 1
Average Subjective Measurement Data of Upsampled Depth Maps
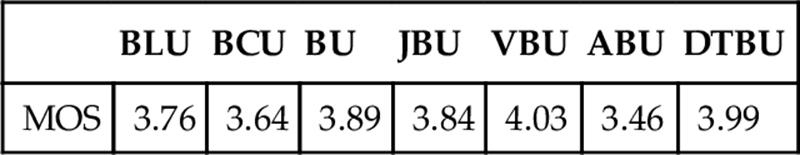
Table 2
Average Objective Measurement Data of Upsampled Depth Maps (PSNR unit: dB)
The 3D perception grades of upsampling methods in Table 1 are based on 3D visual discomfort.
Quality scores of upsampled depth maps obtained from each IQA metric are considered as a group of seven samples. All values are normalized by scaling between 0 and 1 and the similarity of samples distribution in each IQA group is compared with subjective evaluation samples group using Pearson, Spearman, and Kendall correlation coefficients. Table 3 shows the correlation results.
Table 3
Pearson, Spearman, and Kendall Correlation Coefficients Between Subjective and Objective Measurements
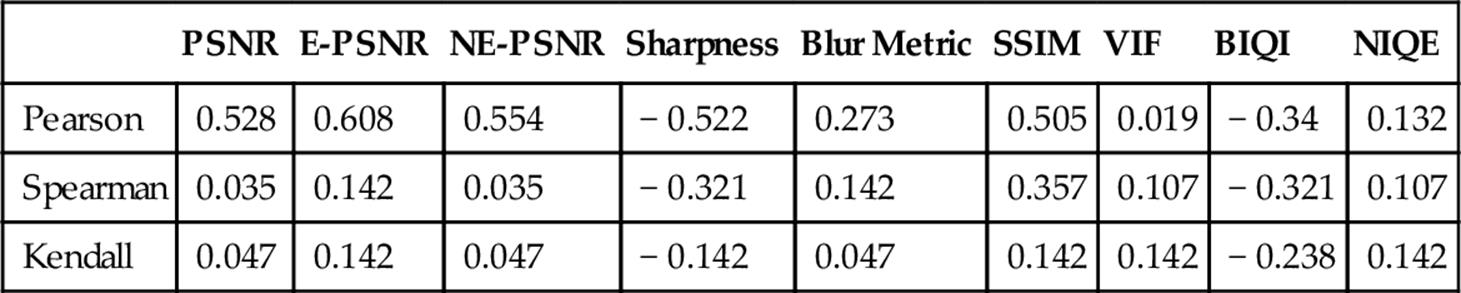
Before evaluating the strength of correlation using different correlation coefficients, it is worth mentioning that Pearson’s correlation coefficient takes into account both the number and degree of concordances and discordances, whereas Kendall’s tau correlation coefficient shows only the number of concordances and discordances. Spearman’s correlation is in between of the Pearson’s and Kendall’s, reflecting the degree of concordances and discordances on the rank scale. The disadvantage of Pearson is the sensitivity to outliers (an observation that is numerically distant from the rest of the data). In this case, Spearman and Kendall are less sensitive to outliers and preferable.
According to Table 3, edge PSNR shows higher value of correlation compare to common PSNR and nonedge PSNR. Also, Pearson coefficient is much higher than Spearman result which indicates the distribution is nonlinear. In this case, Spearman and Kendall results are more reliable.
Sharpness degree and blur metric show negative and positive correlation values, respectively. These two results confirm the fact that image with high spatial frequency (sharper) reveals much noticeable visual discomfort than that with low frequency [22].
SSIM uses luminance, contrast, and structure features to measure quality. Similar to PSNR, Pearson coefficient is higher than two other correlation coefficients in this metric. SSIM has the highest Spearman value among other metrics. Thus, it is the most similar metric to visual fatigue in the case of samples order.
VIF results are based on NSS, HVS, and an image distortion (channel) model in wavelet domain and shows a positive but low correlation to visual fatigue.
BIQI and NIQE are two NR IQA metrics that are expected to show lower correlation in comparison to FR IQA metrics. JPEG, JPEG2000, white noise, Gaussian Blur, and Fast fading are five distortions that are considered in BIQI method for quality measurements. Similar to negative results of sharpness degree, BIQI is not correlated with subjective results.
NIQE metric delivers a positive correlation using Pearson coefficient. Also, Spearman and Kendall correlation results are comparative to some results derived from FR IQA methods. NIQE results are close to VIF, therefore, it can be inferred that NIQE is an acceptable quality assessment tool when there is no access to reference image. Figure 4 shows correlation values for different quality metrics in column diagram mode.
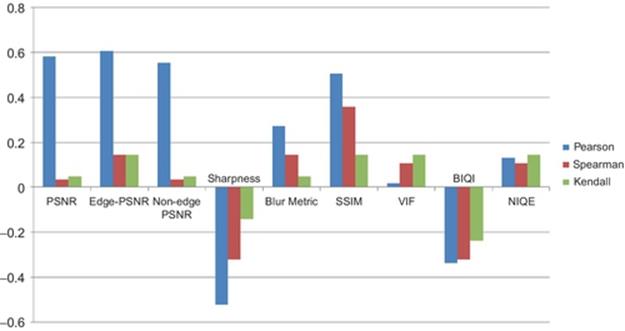
FIGURE 4 Column diagram of correlation between image quality metrics and subjective evaluation in descending order using Pearson, Spearman, and Kendall.
5 Conclusion
In this article, the performance of 2D objective quality tools for 3D quality evaluation is studied. Seven upsampling algorithms that yield different artifacts are implemented to construct high-resolution depth maps. Comparing the quality evaluation results of upsampled depth maps with subjective ratings of reconstructed stereoscopic images, we successfully achieved a reasonable relation between objective IQA results and subjective assessment. As a result, PSNR and SSIM show the highest Pearson correlation coefficients. Sharpness degree has a negative correlation which indicates that the sharp edge is a reason for visual discomfort. Also, VIF is not an appropriate tool due to small correlation coefficient.
References
[1] Urvoy M, Barkowsky M, Le Callet P. How visual fatigue and discomfort impact 3D-TV quality of experience: a comprehensive review of technological, psychophysical, and psychological factors. Ann Telecommun. 2013;68(11–12):641–655.
[2] Banks MS, Akeley K, Hoffman DM, Girshick AR. Consequences of incorrect focus cues in stereo displays. J Soc Inf Disp. 2008;24(7):7.
[3] Tam WJ. Human stereoscopic vision: research applications for 3D-TV. SID International Symposium Digest of Technical Papers. 2007;1(38):1216–1219.
[4] Mahmoudpour S, Kim M. Optimum image quality assessment for 3D perception of stereoscopic image generated from upsampled depth map. In: Proceedings of the international conference on image processing and computer vision; 2014.
[5] Yasakethu S, Hewage C, Fernando W, Worrall S, Kondoz A. Quality analysis for 3D video using 2D video quality models. IEEE Trans Consumer Electron. 2008;54(4):1969–1976.
[6] Bosc E, Pepion R, Le Callet P, Koppel M, Ndjiki-Nya P, Pressigout M, et al. Towards a new quality metric for 3D synthesized view assessment. IEEE Trans Selected Topics Signal Process. 2011;5(7):1332–1343.
[7] Banitalebi-Dehkordi A, Pourazad MT, Nasiopoulos P. A study on the relationship between depth map quality and the overall 3D video quality of experience. In: Proceedings of the IEEE international conference on 3DTV: the true vision-capture, transmission and display of 3D video; 2013:1–4.
[8] Hewage C, Worrall S, Dogan S, Kondoz A. Prediction of stereoscopic video quality using objective quality models of 2-D video. IET Electron Lett. 2008;44(16):963–965.
[9] Tomasi C, Manduchi R. Bilateral filtering for gray and color image. In: Proceedings of the IEEE international conference on computer vision; 1998:836–846.
[10] Kopf J, Cohen MF, Lischinski D, Uyttendaele M. Joint bilateral upsampling. ACM Trans Graphics. 2007;26(3):1–6.
[11] Jang S, Lee D, Kim S, Choi H, Kim M. Depth map upsampling with improved sharpness. Broadcast Eng. 2012;17(6):933–944.
[12] Pham C, Ha S, Jeon J. A local variance-based bilateral filtering for artifact-free detail and edge-preserving smoothing. In: Proceedings of the international conference on advances in image and video technology, South Korea; 2011:60–70.
[13] Yeo D, Haq E, Kim J, Baig M, Shin H. Adaptive bilateral filtering for noise removal in depth upsampling. In: Proceedings. Conference on SoC design incheon, South Korea; 2010:36–39.
[14] Wang Z, Bovik AC, Sheikh HR, Simoncelli EP. Image quality assessment: from error visibility to structural similarity. IEEE Trans Image Process. 2004;13(4):600–612.
[15] Sheikh H, Bovik A. Image information and image quality. IEEE Trans Image Process. 2006;12(2):430–444.
[16] Tsai C, Liu H, Tasi M. Design of a scan converter using the cubic convolution interpolation with canny edge detection. In: Proceedings of the international conference on electric information and control engineering; 2011:5813–5816.
[17] Marziliano P, Dufaux F, Winkler S, Ebrahimi T. Perceptual blur and ringing metrics: application to JPEG2000. In: Proceedings of the International Workshop on Multimedia, Signal Processing; 2008:403–408.
[18] Moorthy AK, Bovik A. A two-step framework for constructing blind image quality assessment. IEEE Trans Signal Process Lett. 2010;17(5):513–516.
[19] Mittal A, Soundararajan R, Bovik AC. Making a ‘completely blind’ image quality analyzer. IEEE Trans Signal Process Lett. 2013;20(3):209–212.
[20] Methodology for the subjective assessment of the quality of television pictures, International Telecommunications Union/ITU Radio Communication Sector, ITU-R BT.500–11; January 2002.
[21] Scharstein D, Szeliski R. A taxonomy and evaluation of dense two-frame stereo correspondence algorithms. Comput Vis. 2002;47(1–3):7–42.
[22] Kim D, Sohn K. Visual fatigue prediction for stereoscopic image. IEEE Trans Circuits Syst video Technol. 2011;21(3):231–236.
![]() IPCV paper title: Optimum Image Quality Assessment for 3D Perception of Stereoscopic Image Generated from Upsampled Depth Map
IPCV paper title: Optimum Image Quality Assessment for 3D Perception of Stereoscopic Image Generated from Upsampled Depth Map
All materials on the site are licensed Creative Commons Attribution-Sharealike 3.0 Unported CC BY-SA 3.0 & GNU Free Documentation License (GFDL)
If you are the copyright holder of any material contained on our site and intend to remove it, please contact our site administrator for approval.
© 2016-2026 All site design rights belong to S.Y.A.