Emerging Trends in Image Processing, Computer Vision, and Pattern Recognition, 1st Edition (2015)
Part I. Image and Signal Processing
Chapter 12. DT-Binarize
A decision tree based binarization for protein crystal images
İmren Dinç1; Semih Dinç1; Madhav Sigdel1; Madhu S. Sigdel1; Ramazan S. Aygün1; Marc L. Pusey2 1 DataMedia Research Lab, Computer Science Department, University of Alabama Huntsville, Huntsville, AL, USA
2 iXpressGenes Inc., Huntsville, AL, USA
Abstract
In image thresholding problems, there are some cases that single thresholding technique may not generate good binary images for all samples. Using multiple methods may help to overcome this limitation, but this idea brings another problem. It is not a trivial task to select proper thresholding method for each image in the dataset. In this study, we propose a generic framework for image thresholding that utilizes a tree based structure to determine the best thresholding approach for a particular case. We call our method “DT-Binarize,” and apply our method to the protein crystallization image dataset. In our experiments, we compare the results with the reference binary images that are manually generated by our research group. In order to provide more reliable and objective comparison, numerical results are presented as well as the visual results. Experimental results indicate that the correctness of DT-Binarize outperforms other methods by 10% on the average.
Keywords
Global thresholding
Image binarization
Protein crystallization
Decision tree
Acknowledgment
This research was supported by National Institutes of Health (GM090453) grant.
1 Introduction
Protein crystallography is one of the major research areas in the drug discovery industry since it gives information about the 3D structure of the protein and its functionality [1]. Growing a protein crystal structure is a complex process that comprises of several sensitive stages. Every stage requires high attention since some parameters, such as pH, temperature, type, and portion of the salt and the precipitant need to be set carefully. (Note that it is possible to generate millions of different solutions using different chemicals for protein crystallization process.) Therefore, growing a crystal usually requires many trials, and most of the trials do not yield a desired protein crystal [2]. In non-automated systems, hundreds of images of proteins need to be checked manually by the experts in order to detect the crystal formation, which is a time consuming process [1]. For this reason, detecting and analyzing of protein crystals using an automated system is significantly important for the experts to save time and effort. There are several examples of automated systems in use, and most of them use typically regional, geometrical or texture features of the protein images to detect and classify crystals. In order to extract the features correctly, accurate image segmentation is required for these systems.
Image binarization (thresholding) is one of the widely used preprocessing tasks in most of the systems. Thresholding is an operation that converts grayscale image into a black and white image using a threshold value τ. This τ value can be selected using different techniques. Therefore, image thresholding can be mainly grouped into two based on the selection of τ value: global and local thresholding. If an image is binarized using a single τ value, it is called “global thresholding.” If τ value varies depending on pixel position due to some local features of the image, then it is called “local thresholding” [3]. In the literature, there are many studies that focus on different aspects of the problems. The studies focus on their own problem domain to find the best approach for binarization [4], and there is not an optimal solution that works for all cases.
All thresholding techniques have been developed based on some assumptions, and all of the methods have some strengths and weaknesses. Therefore, all methods may fail under some circumstances. For example, Otsu’s thresholding method, which is one of the popular thresholding methods in the literature, is affected by the size of the objects in the image. If the object size is too large or too small, this method will probably fail in segmentation operation. This may lead extraction of incorrect features for the system [5]. As another example, most of document binarization methods assume that document has whitish background color. This means that if the document has dark background, those methods will generate improper binary images. Thus, there is no single thresholding method that can generate proper binary images for all images in the datasets such as medical images, biological images, and especially protein crystallization images.
Crystal images are anticipated to have characteristic features such as high intense regions, clear edges, and proper geometric shapes. These features are mostly used in classification process, but in some cases, they may not be observed clearly due to focusing or reflection problems in the image. Capturing clear images is an important step to extract reliable features as well as to binarize images correctly. Most of protein images have non-uniform illumination, low contrast, and noise since proteins are grown in a liquid solution. This makes thresholding process more complex task. In this study, we investigated several thresholding methods for protein crystal imagery. In most cases, while one method generates proper binary images for some of the protein images, another method generates better results for the others. Obviously, a single type of thresholding technique is not enough to generate a useful binary image to use in classification of the protein images. Thus, it is very important to select the correct binarization method for these types of images in the classification process. Improper binary image may lose some important information or it may keep some unnecessary information such as tiny noisy pixels. Furthermore, incorrect thresholding method may lose a blurred crystal in the image or it may crop a regular object around its borders leading incorrect classification.
In our previous work [6], we used three thresholding techniques (Otsu‘s Threshold (Otsu), 90th Percentile Green Intensity Threshold (g90), and Max Green Intensity Threshold (g100)) together not to lose any informative feature for classification of protein crystallization images. However, this also leads incorporation of unnecessary features that may yield incorrect classification results. To avoid this problem, in this study, we propose an alternative approach, DT-Binarize, recently introduced in [7]. It selects the best thresholding technique for a particular image using decision tree.
In DT-Binarize, we train a decision tree using some basic features of the protein images on our pre-labeled samples. Each label indicates a different thresholding technique that properly fits for that particular image. In the test stage, the best thresholding method is selected for a given test image using the same features. Our technique tries to select the most useful and reliable binarization methods for the protein crystallization images. In this way, the complexity of our system may be reduced since we are dealing with less number of features (i.e., features from a single thresholded image are used rather than from multiple thresholded images).
This research uses protein crystallization images dataset provided by iXpressGenes, Inc. As our earlier work, we classify the protein images into three main groups (non-crystals, likely-leads, and crystals). Each category has its own specific characteristics that need to be considered independently. In this paper, we focus on “crystals” only and propose a solution to select the best thresholding technique for each image.
The rest of the chapter is structured as follows. The image binarization techniques are described in Section 2. Our approach to select the best binarization technique is explained in Section 3. Experimental results are provided in Section 4. Finally, our chapter is concluded in Section 5.
2 Background
2.1 Image Binarization Methods
Image binarization is a technique for separating foreground and background regions in an image. For the protein images consisting of crystals, the crystal regions are expected to be represented as the foreground in the binary images. Some of the sample protein images are provided in Figure 1 (a-c). While a thresholding technique may perform well for an image, it may not perform as good as other thresholding techniques for another image. Thus, we consider three image thresholding techniques described below: Otsu‘s threshold (Otsu), 90th percentile green intensity threshold (g90), and max green intensity threshold (g100).
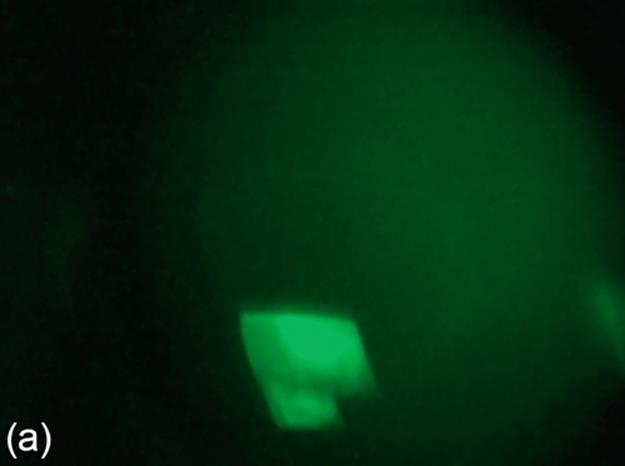
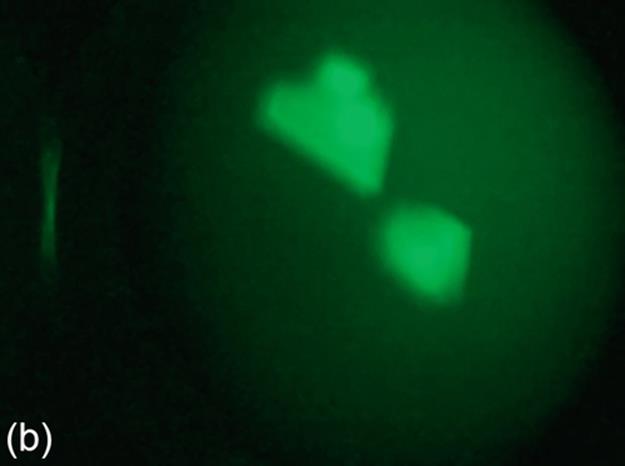
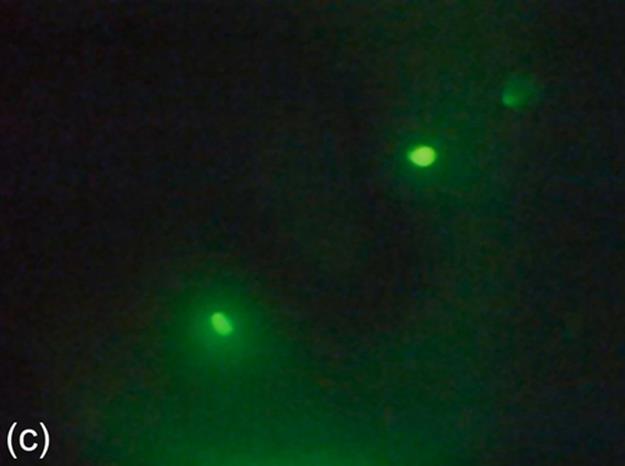
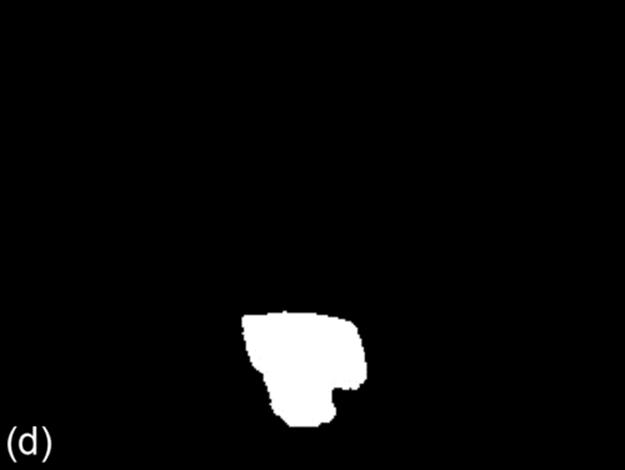
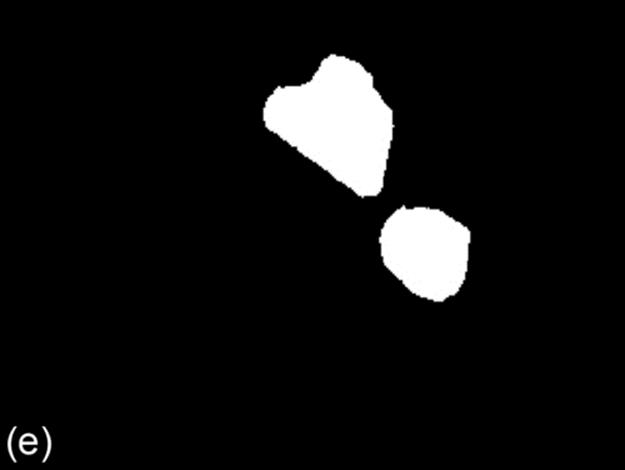
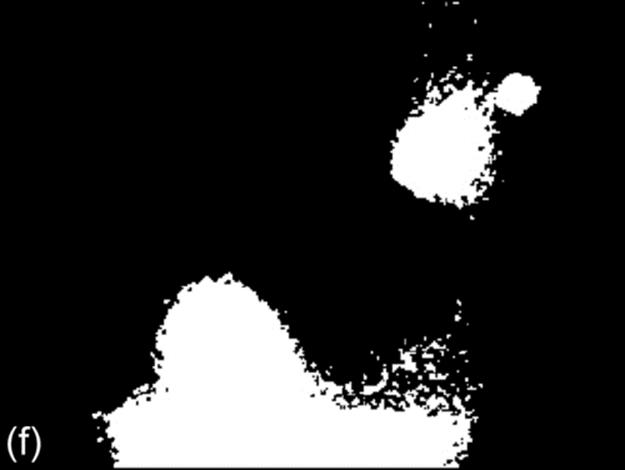
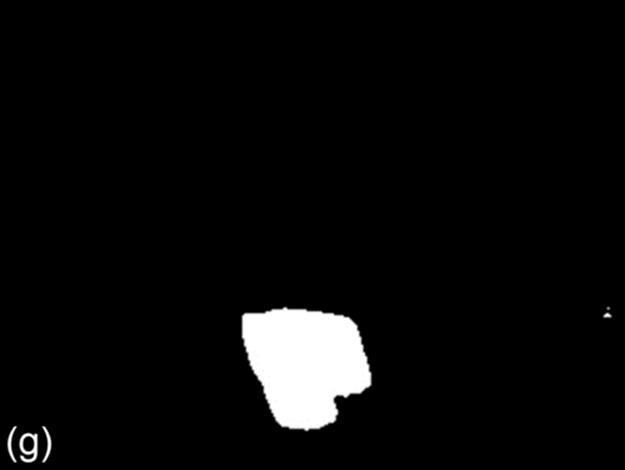
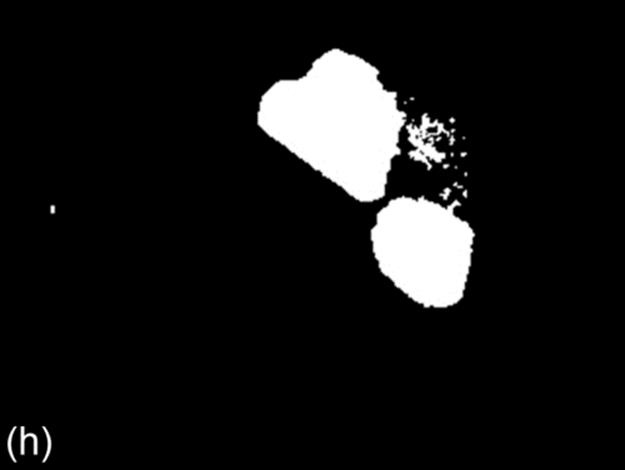
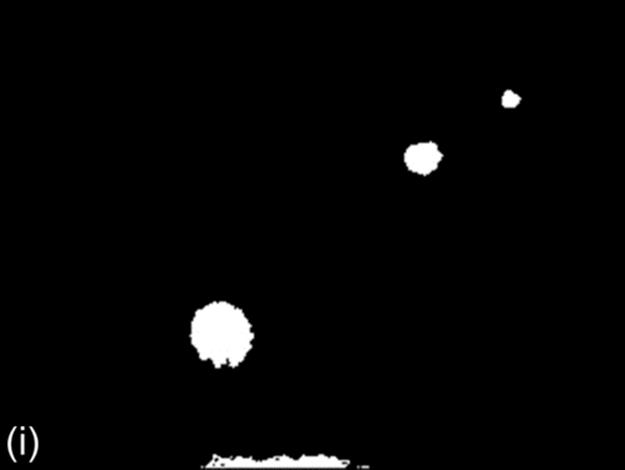
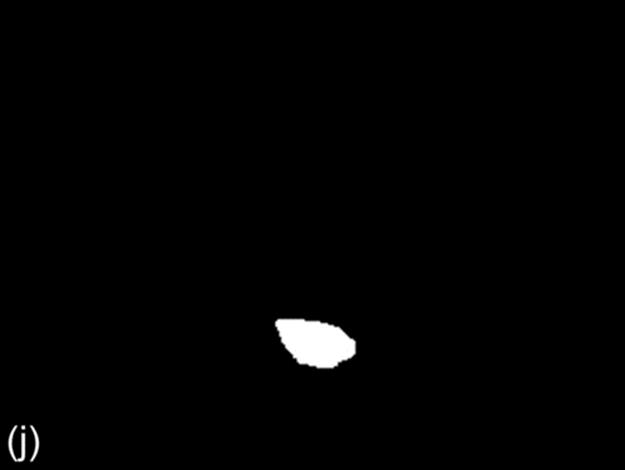
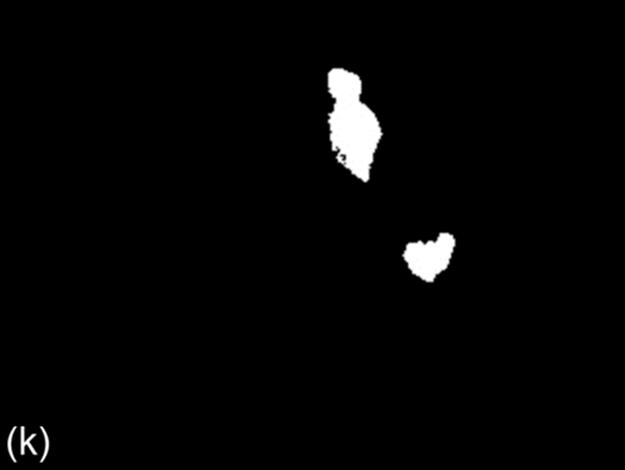
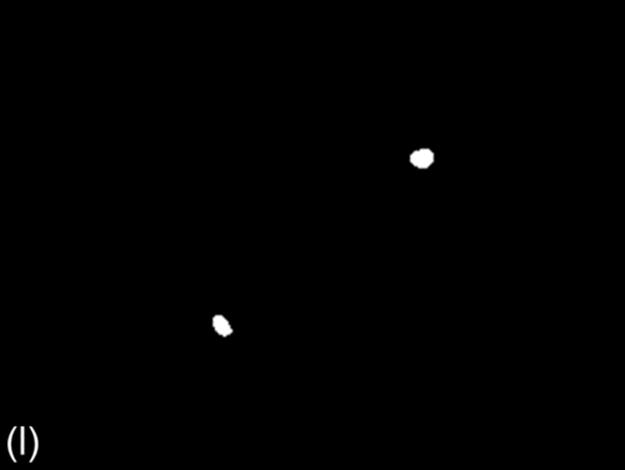
FIGURE 1 Sample images for all thresholding techniques: (a-c) original images,(d-c) Otsu results, (g-i) g90 results, and (j-l) g100 results. Note that (e), (g), and (l) are outputs of the best thresholding method for each case.
2.1.1 Otsu threshold
For Otsu’s thresholding [8], firstly a gray level image is generated from an input color image. Then, for each possible intensity threshold, the variance of spread of pixels in the foreground and background region is calculated. The intensity (τ0) for which the sum of foreground and background spreads is minimal is selected as the threshold. Pixels with gray level intensity higher than (τ0) form the foreground region while the remaining pixels form the background. Figure 1 (d-f) shows some sample binary images of Otsu’s method.
2.1.2 90th Percentile green intensity threshold (g90)
When green light is used as the excitation source for fluorescence based acquisition, the intensity of the green pixel component is observed to be higher than the red and blue components in the crystal regions [6]. 90th percentile green intensity threshold utilizes this feature for image binarization. First, the threshold intensity (τg90) is computed as the 90th percentile intensity of the green component in all pixels. This means that the number of pixels in the image with the green component intensity below this intensity constitutes around 90% of the pixels. Also, a minimum gray level intensity condition (tmin = 40) is applied. All pixels with gray level intensity greater than tmin and having green pixel component greater than (τg90) constitute the foreground region while the rest constitute the background region [3]. Some sample binary images of g90 are shown in Figure 1 (g-i).
2.1.3 Maximum green intensity threshold (g100)
This technique is similar to the 90th percentile green intensity threshold described earlier. In this method, the maximum intensity of green component (τg100) is used as the threshold intensity for green component. All pixels with gray level intensity greater than tminand having green pixel component equal to (τg100) constitute the foreground region. The foreground (object) region in the binary image from this method is usually smaller than the foreground region from the other two techniques [3]. Figure 1 (j-l) shows some sample binary images of g100.
3 DT-Binarize: Selection of best binarization method using decision tree
In this section, first we describe DT-Binarize that can be used in any image binarization problem. Then, we briefly define the methods used at intermediate stages of our algorithm. Finally, we provide application of this method to the protein image binarization problem.
3.1 Overview
Since image binarization is a challenging problem, it is not practical to determine the optimal threshold value for all cases. There are some weaknesses and strengths of the all image binarization methods [9]. Based on this fact, in this research, we target an algorithm that selects the best binarization method rather than a single threshold value. Our goal is to exploit the powerful features of different binarization methods and use them whenever they perform well. For this reason, we propose using a supervised classification method (decision trees) to determine the best binarization method for any image dataset based on some basic features such as standard deviation, mean, max intensity, etc.
We first build a training set that is labeled with the best thresholding technique by the experts. In other words, the best thresholding technique for each image is used as the class label in that stage. We benefit from ground truth data to select the best binarization method as a class label. According to our algorithm we first generate a training dataset, in which training samples are labeled with the binarization methods that provides best binary image. Then in the training stage, we build the decision tree based on the basic features of the images in the training dataset. Once we have the decision tree, we are able to determine the best binarization method for any test image by using the same statistical features. Figure 2 shows the mechanism of the DT-Binarize algorithm. Following steps provide a brief summary of our algorithm:
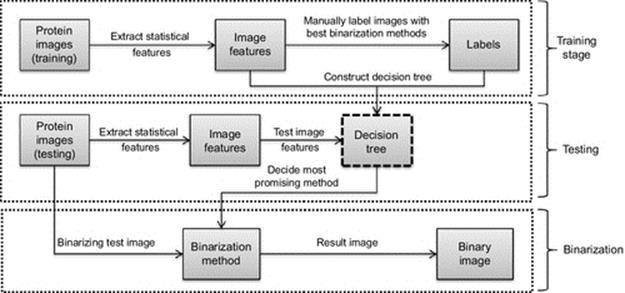
FIGURE 2 Overview of the DT-Binarize.
1. resizing and noise reduction of the images,
2. labeling training images with best binarization methods,
3. extracting statistical features of the images,
4. building the decision tree based on the statistical features,
5. predicting the best binarization method for a test image using the decision tree,
6. applying chosen binarization method to a given test image.
3.2 Stages of the Algorithm
3.2.1 Median filter
Median filter is one of the well-known order-statistic filters due to its good performance for some specific noise types such as “Gaussian,” “random,” and “salt and pepper” noises [3]. According to the median filter, the center pixel of a M × M neighborhood is replaced by the median value of the corresponding window. Note that noise pixels are considered to be very different from the median. Using this idea median filter can remove this type of noise problems [3]. We use this filter to remove the noise pixels on the protein crystal images before binarization operation.
3.2.2 Contrast stretching
Contrast stretching is a normalization method that enhances the informative features of the image by expanding the histogram of the intensities. It maps the pixel values into a new range in a linear fashion [3]. We can apply contrast stretching to the images by using Equation (1),
 (1)
(1)
where Iin and Iout are the input and output images, Pmin and Pmax are the minimum and the maximum intensity value of the input images, and P′min and P′max are the minimum and the maximum intensity values of the output image, respectively. We include contrast stretching in our research, because our dataset contains some low contrast images that may cause incorrect thresholding for our dataset. Figure 3 shows a problematic image and contrast stretching result. Note that informative features of the result image are magnified without loosing the structure of the crystal, and contrast stretching is not applied all the images in the dataset.
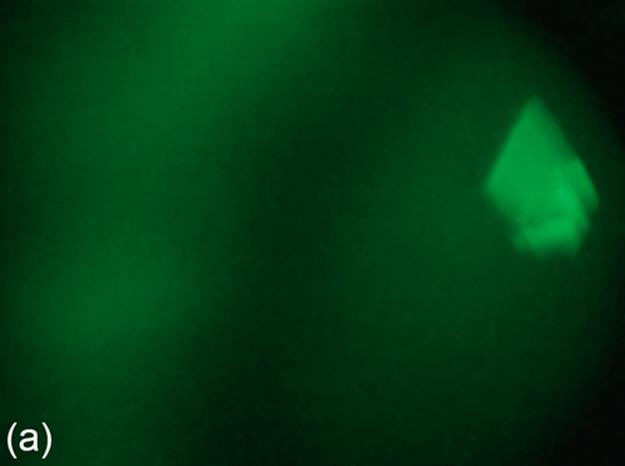
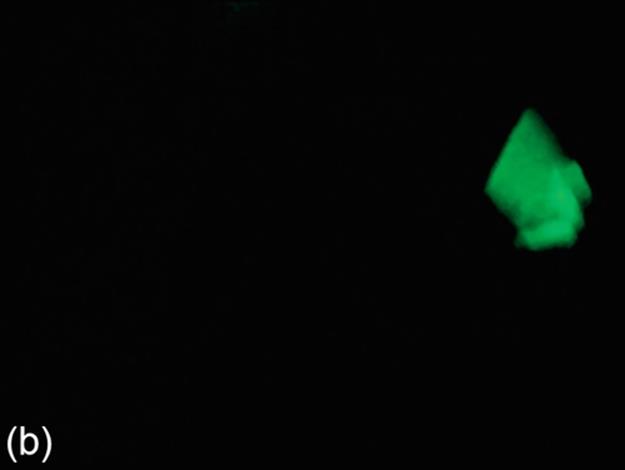
FIGURE 3 Contrast stretching example: (a) original image and (b) image after applying contrast stretching.
3.2.3 Decision tree
Decision tree [10] is a rule-based classifier that employs a tree structure for data classification. It is a supervised classification technique that comprises of training and testing stages. In the training stage the tree is generated based on the entropy of the data features. In the testing stage, each test sample is classified using the tree built in the training stage. Decision tree is a classifier that requires relatively less time to create training model. In addition, testing is quite fast after building the tree.
3.3 Application of Dt-Binarize on Protein Crystal Images
Protein image binarization problem is a convenient application area of DT-Binarize, since there is no single thresholding method that can generate proper binary images for all datasets. In our problem, we labeled the protein crystallization images with one of the three different thresholding methods: Otsu‘s threshold 90th Percentile Green Intensity threshold, and Max Green Intensity threshold. We use the training images to build the decision tree based on only standard deviation of the pixel intensities. 75% of the data is selected as the training set, and the remaining is used for the testing. Figure 4 shows the decision tree of the training stage. In Figure 4, “g90” is selected as the best binarization method if standard deviation of the test sample is less than 12.86. However, if the standard deviation is between 12.86 and 24.99, the best binarization method is selected as “Contrast Stretching + g90.” Similarly, other binarization methods may be selected depending on the standard deviation of the test image.
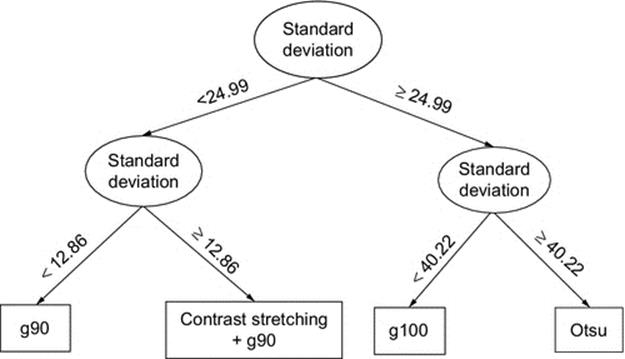
FIGURE 4 Decision tree for selecting the best threshold method.
We have employed this tree to our test dataset. For a test sample, we take the standard deviation and find the corresponding class label of the tree. The method represented with that label is selected to binarize the test image. The following section provides some numerical and visual results of DT-Binarize with several examples.
4 Experiments and results
This section provides objective evaluation of each binarization technique using the ground truth (reference) image dataset that is manually generated by our research group. The correctness of a binary image is calculated using several well-known performance measures. DT-Binarize technique is also compared with the given methods.
4.1 Dataset
The protein crystal images may be grouped into five main categories: “posettes and spherulites” “needles,” “2D plates,” “small 3D crystals,” and “large 3D crystals.” Distinctive features of these categories may be identified as high intense regions, straight edges, and proper geometric shapes. Our dataset consists of totally 114 protein crystal images that consist of three subcategories of crystals: “2D plates (40%),” “small 3D crystals (10%),” and “large 3D crystals (50%).” The size of each image is 320 × 240, and all images have been captured by a special imaging system under green light. In the following sections, we are going to explain protein crystal subcategories briefly.
4.1.1 2D Plates
2D Plates have quadrangular shapes. In some specific cases, we may not be able to observe all the edges of a quadrangular shape because of focusing issues. 2D Plates may have small or large sizes, and they may be located as a stack of regions. The mean intensities of 2D Plates are lower than the mean intensities of 3D crystals. This means intensity change between the foreground and the background may not be as significant as for 3D crystals. Figure 5 (a-c) shows a group of sample images for this category.
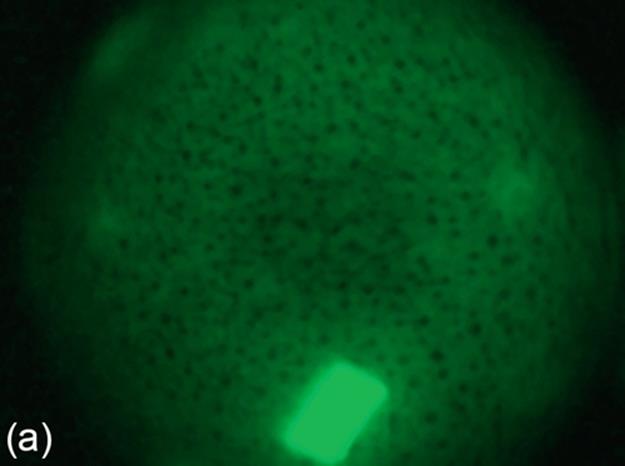
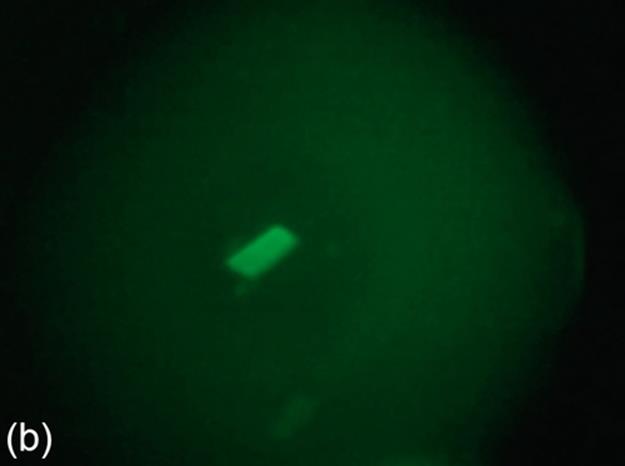
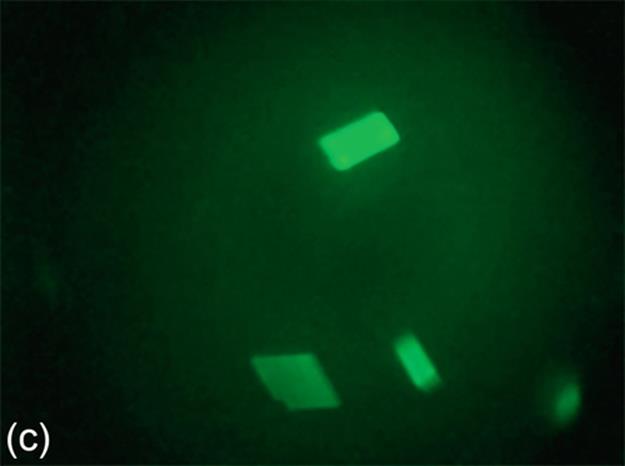
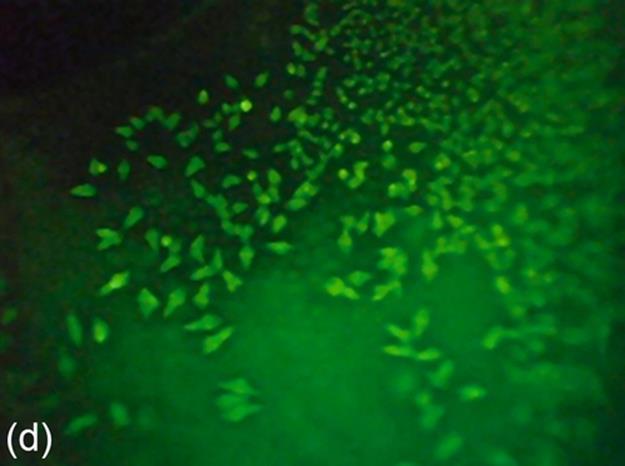
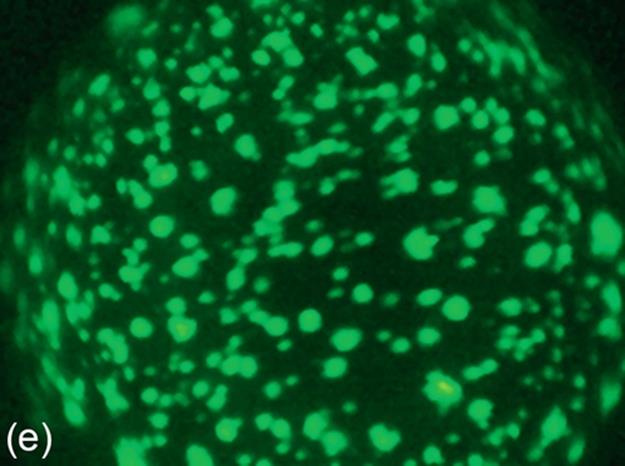
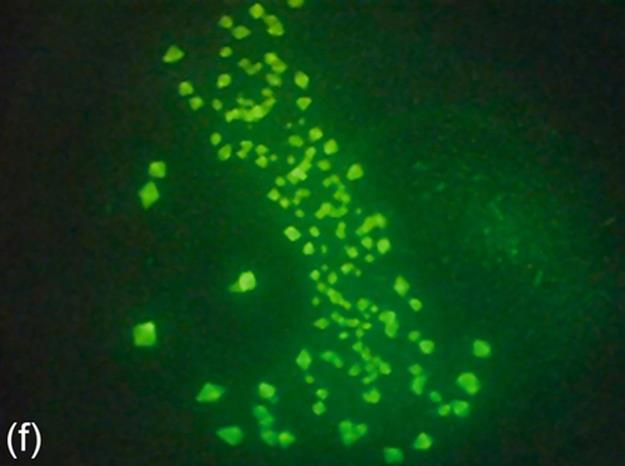
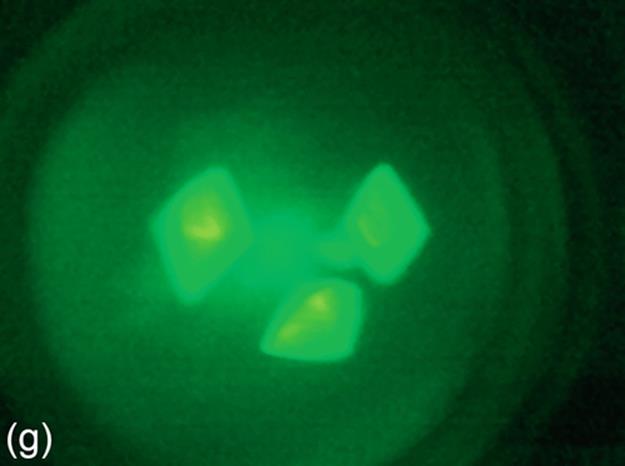
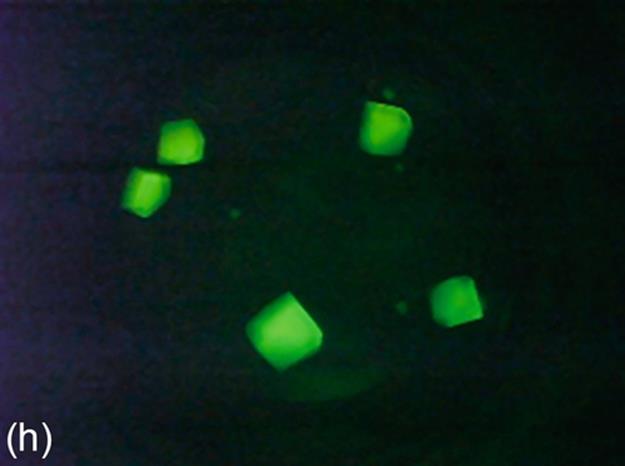
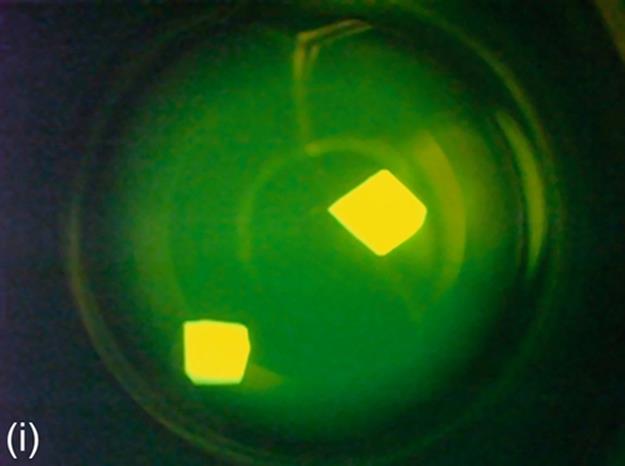
FIGURE 5 Protein crystallization image samples: (a-c) 2D plates, (d-f) small 3D crystals, and (g-i) large 3D crystals.
4.1.2 Small 3D crystals
The areas of small 3D crystals are smaller than those of large 3D crystals. They have higher intensities than 2D plates. This causes a significant intensity change between 3D objects and background in images. Generally, it is hard to detect all the edges of this category due to small size. Figure 5 (d-f) shows some sample images of this category.
4.1.3 Large 3D crystals
This category generally has regions with high intensity, and these regions generally have proper geometric shapes. The 3D structure of large 3D crystals can be observed in images. In some particular cases, it is difficult to detect all the edges of 3D objects because of focusing and light reflection problems. The instances of this category have larger sizes than small 3D crystals. Some sample images of this category are shown in Figure 5 (g-i).
4.2 Correctness Measurement
Most image binarization studies need to deal with a common difficulty regarding the correctness of their proposed system. Because a simple visual comparison of the binary images would not provide an objective and dependable results, numerical results are expected as well as the visual results. For this reason, we decided to generate a reference (ground-truth) binary image of each protein image manually in our dataset. We extracted the protein instances in a image using an image editing software [11] that has the capability of auto selection of the objects in an image. This software also provides fine level adjustments on the object areas. Finally, all reference images were checked by the domain experts to minimize the human error.
The success of a binarization method can be measured in terms of the “similarity” of its output binary image to the corresponding reference binary image. If the similarity is high then it can be considered as a successful method. In order to measure similarity between two binary images, in this study, we used a simple technique called “weighted sum.” In this technique we basically sum (overlap) two binary images, after we multiply the reference image by 2,
![]() (2)
(2)
where IS, IR, and IO are the sum image, reference binary image, and the output binary image, respectively. Suppose that the values of the pixels of protein instances are represented by “1” and the background area is represented by “0” in the images. After the “weighted sum” operation, the sum image will include “0s,” “1s,” “2s,” and “3s.” Every number has a special meaning to measure the similarity. If the pixel value pij of the sum image is “3,” it is a hit, which is also called as a True Positive (TP). If the pixel value is “2,” it is a miss, which is called as a False Negative (FN). Similarly, if the pixel value is “1,” it is a false alarm, which is called as a False Positive (FP). Finally if the pixel value is “0,” it is a correct reject, which is called as a True Negative (TN). We can use these 4 values (TP, TN, FN, and TN) to measure the correctness of the output binary image. Figure 6 shows an example sum image that includes four regions.
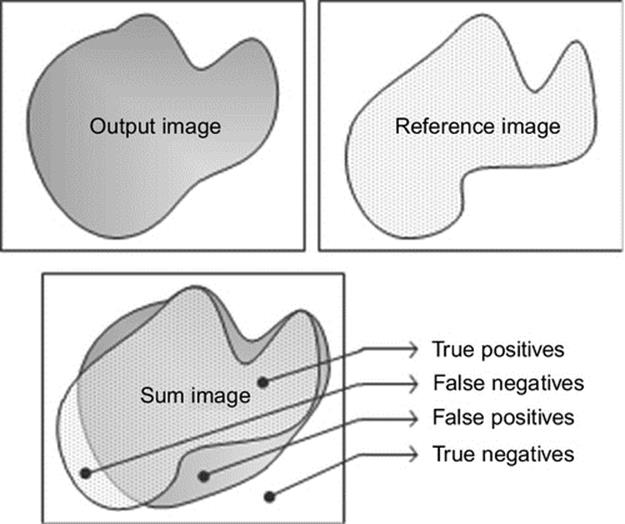
FIGURE 6 Example sum image.
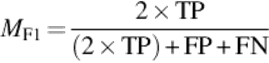
In the literature there are several measures that may provide correctness information from different perspectives. It is important to use a proper accuracy measure that is more relevant to the characteristics of our study. For example, the classical accuracy measure may not be a proper technique for our study. Because in a typical protein binary image, there are usually few number of foreground pixels compared to the background pixels. This means that the TN pixels can easily suppress the accuracy even if there are no TP pixels. To avoid bias towards a specific measurement method, we use and compare 4 well-known measures: Accuracy, F-Score (F-measure), Matthews correlation coefficient (MCC), and Jaccard (Jacc) similarity. These can provide more reliable measures for a variety of confusion matrices [12]. Following equations show the formula of each measurement:
![]() (3)
(3)
 (4)
(4)
 (5)
(5)
![]() (6)
(6)
4.3 Results
In the experimentation stage we generate four binary images using the three binarization techniques (g90, g100, and Otsu) and DT-Binarize (see Figure 8). Correctness of each binary image is measured based on reference binary images (ground truth). Four different correctness measures are employed at this stage in order to evaluate the results objectively. This process is done for all test images in the dataset. Table 1 shows the average results of each measure. DT-Binarize achieves 98.44% accuracy on our protein dataset, but accuracy is not a reliable measure for our dataset since true negative pixels are much more than true positive pixels in the image. Therefore, F-measure, MCC, and Jaccard similarity measures are more reliable to evaluate DT-Binarize. According to Table 1, our method could reach 81.06%, 82.36%, and 71.03% for F-measure, MCC, and Jaccard respectively. DT-Binarize outperforms all other methods by 10% on the average.
Table 1
Comparison of the Techniques by Different Measures
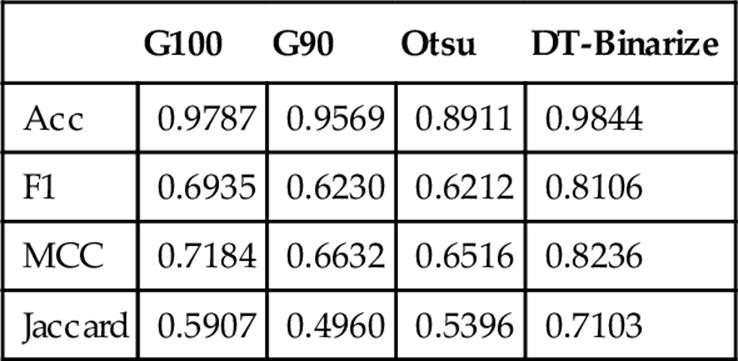
Figure 7 shows a visual representation of the results is given in Table 1.
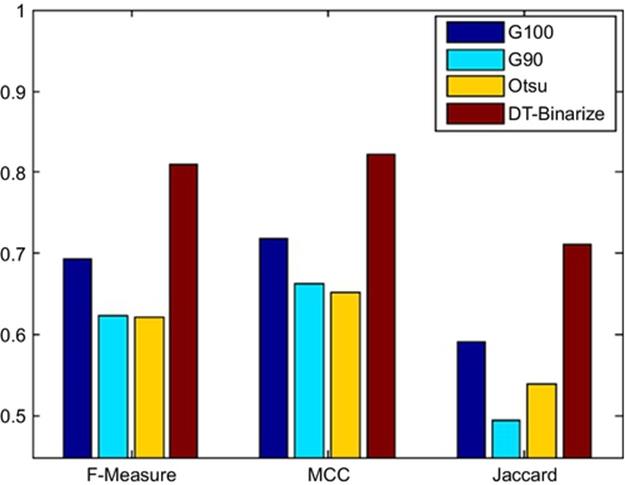
FIGURE 7 Comparison of the results.
In almost all cases, DT-Binarize was able to generate the best binary image in the testing stage. Figure 8 shows a sample test case in which our technique can successfully generate the best result.
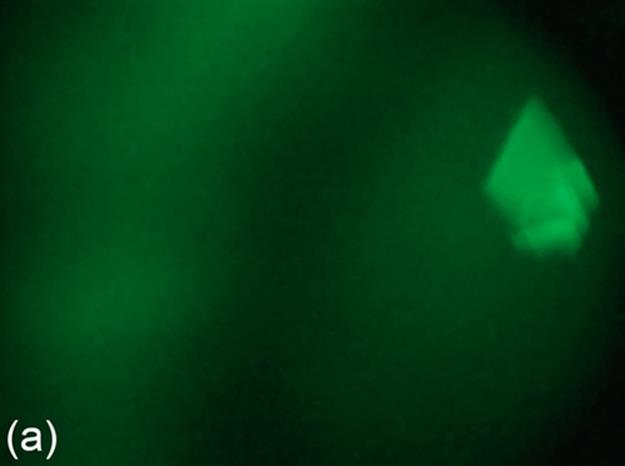
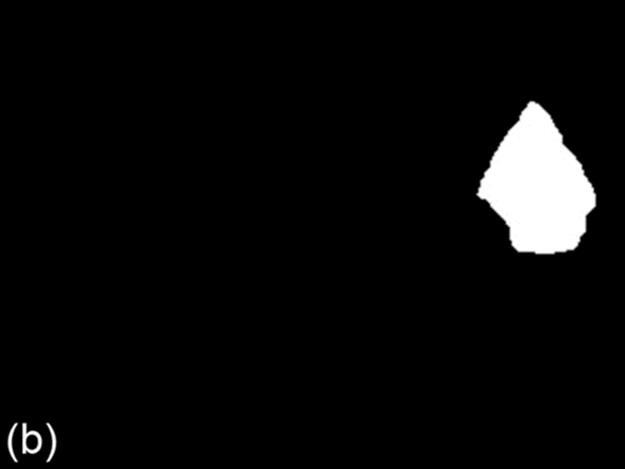
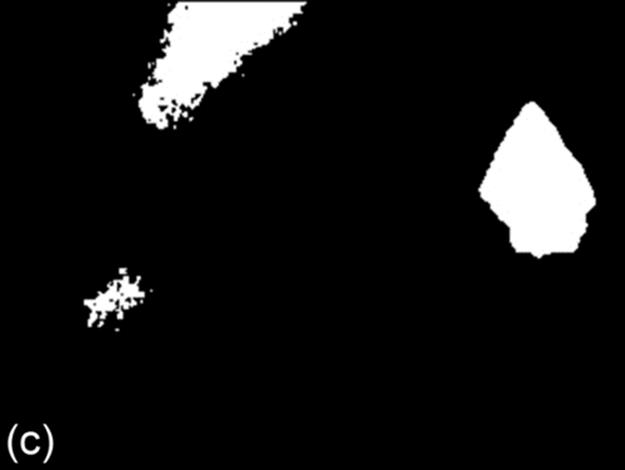
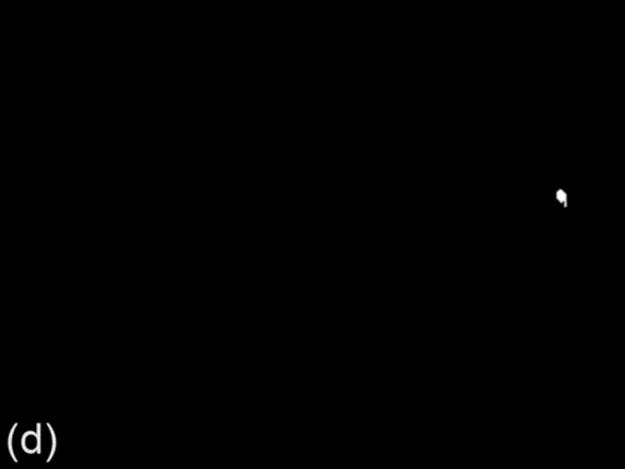
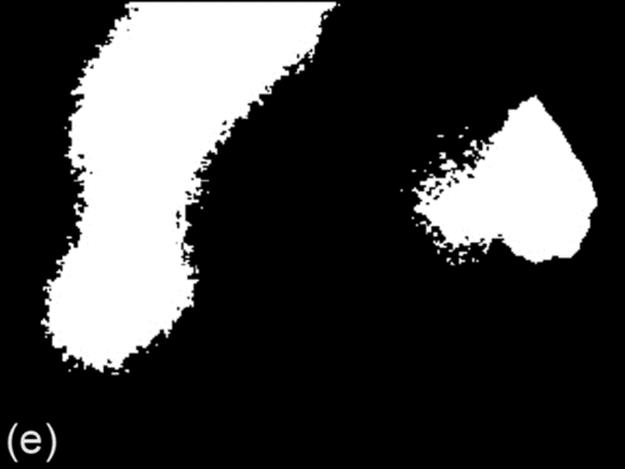
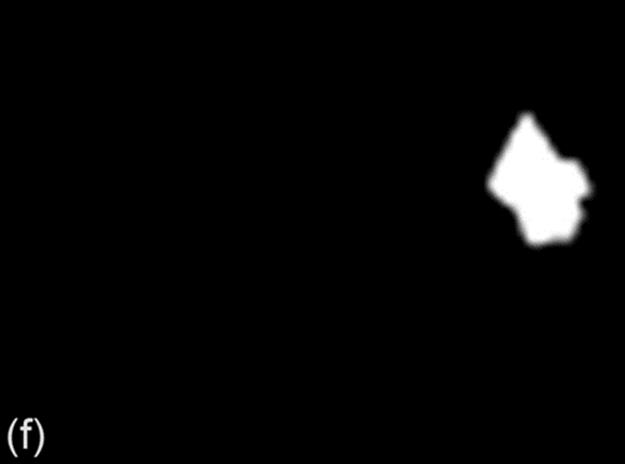
FIGURE 8 A sample test case: (a) original image, (b) ground truth image, (c) g90 threshold, (d) g100 threshold, (e) Otsu threshold, and (f) DT-Binarize.
However, there are also few cases that our technique could not provide proper binary image of the protein crystal. Figure 9 shows a sample image for that case.
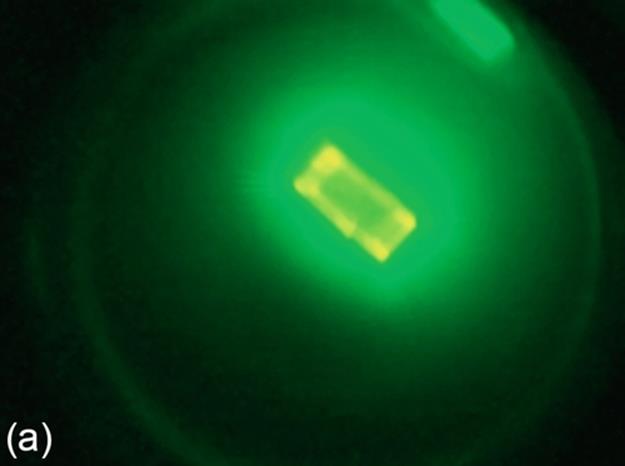
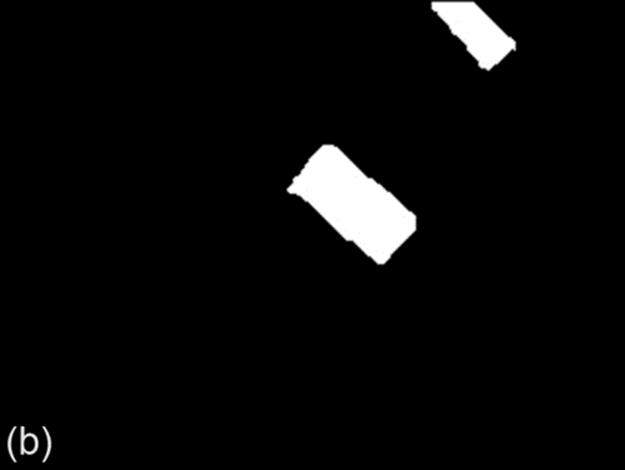

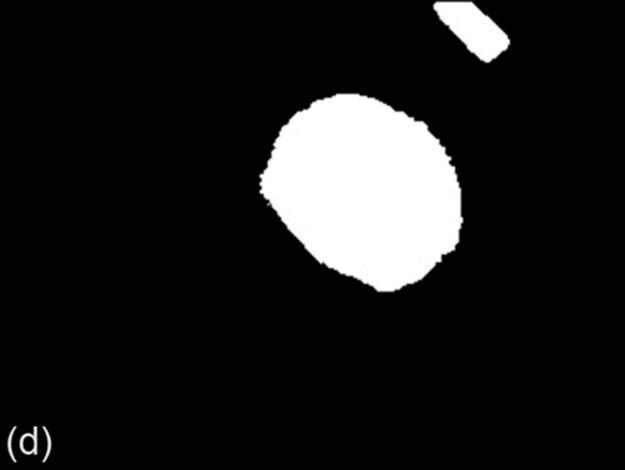
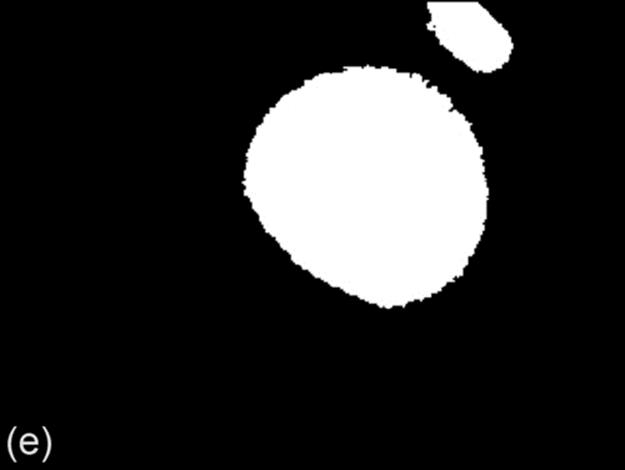
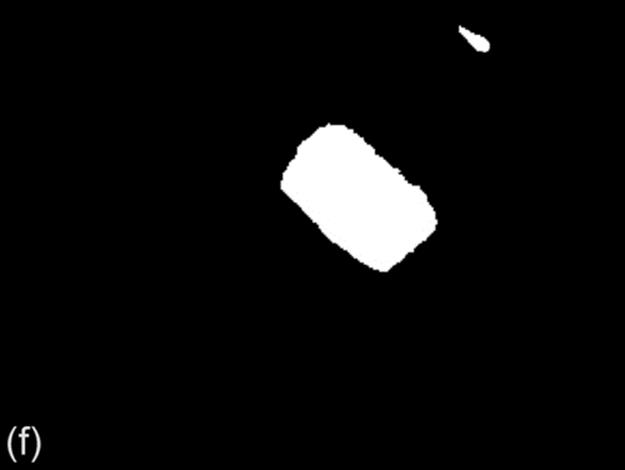
FIGURE 9 Example of a bad binarization result: (a) original image, (b) ground truth image, (c) g90 threshold, (d) g100 threshold,(e) Otsu threshold, and (f) DT-Binarize.
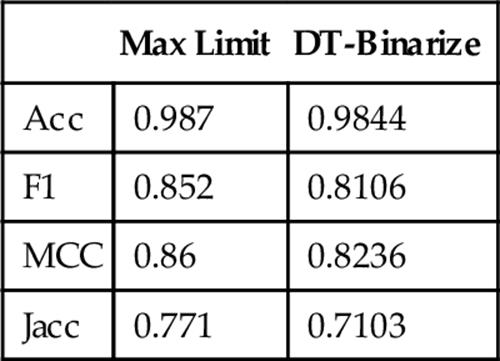
Please note that success of DT-Binarize depends on the thresholding methods that are chosen for the problem domain. If none of the thresholding techniques provide a correct result, our method will not provide a good result either. It means that there is a performance limit that DT-Binarize can achieve. We call this limit as the “Max Limit.” If we select the best thresholding method for every image out of the provided techniques, we can reach the “Max Limit.” In this case, DT-Binarize is considered to perform well when it chooses the same thresholding techniques that are chosen manually. Figure 10 shows the comparison of the correctness of our technique with respect to the best labeling. The closeness to the max limit indicates the success of DT-Binarize in this problem. Numerical results are presented in Table 2. The max limit of F-measure is 85.2%, and DT-Binarize could achieve 81.06%. It means that DT-Binarize can reach 95% of the max limit for protein image dataset.
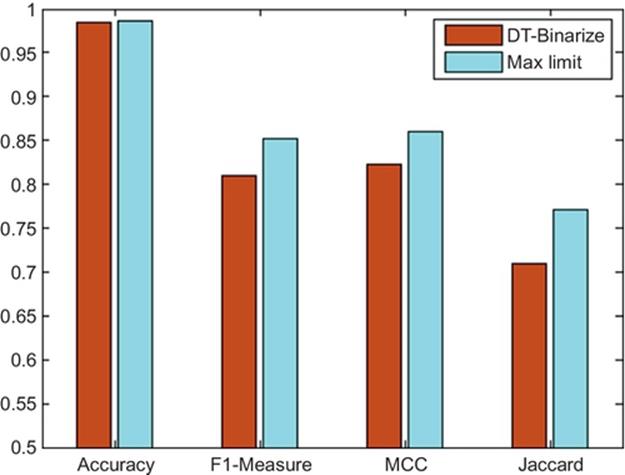
FIGURE 10 Comparison with theoretical max limit.
Table 2
Comparison of DT-Binarize and max Limit
5 Conclusion
This paper presents a new technique for image binarization problem using a group of different thresholding methods. DT-Binarize is a supervised method with training and testing stages. In the training stage, a decision tree is built using the standard deviation of the protein images. Leaf nodes of the tree represent different thresholding techniques that provide the best binarization method for a specific group of images. In the testing stage, using the decision tree, we select the best thresholding technique for the test sample and then generate the binary image using that technique.
We evaluate the performance of our approach with four different accuracy measures. For all cases, DT-Binarize outperformed other single thresholding methods. Experimental results show that our technique improves the binarization accuracy by 10% on the average and provides high accuracy by reaching 95% of the expert choices.
References
[1] Zhu X, Sun S, Bern M. Classification of protein crystallization imagery. Engineering in Medicine and Biology Society. 2004 IEMBS ’04. 26th Annual International Conference of the IEEE, vol. 1; 2004. p. 1628–31.
[2] Rupp B, Wang J. Predictive models for protein crystallization. Methods. 2004. ;34(3):390–407. Available: http://www.sciencedirect.com/science/article/pii/S1046202304001203.
[3] Gonzalez R, Woods R. Digital image processing. Pearson/Prentice Hall; 2008. Available: http://books.google.com/books?id=8uGOnjRGEzoC.
[4] Sezgin M, Sankur B. Survey over image thresholding techniques and quantitative performance evaluation. J Electron Imaging. 2004. ;13(1):146–168. Available: http://dx.doi.org/10.1117/1.1631315.
[5] Ray N, Saha B. Edge sensitive variational image thresholding. IEEE International Conference on Image Processing, ICIP 2007. 2007;vol. 6 p. VI37–VI40.
[6] Sigdel M, Pusey ML, Aygun RS. Real-time protein crystallization image acquisition and classification system. Crystal Growth Design. 2013. ;13(7):2728–2736. Available: http://pubs.acs.org/doi/abs/10.1021/cg3016029.
[7] Dinç I, Dinç S, Sigdel M, Sigdel MS, Pusey ML, Aygün RS. Dt-binarize: A hybrid binarization method using decision tree for protein crystallization images. Proceedings of the 2014 International Conference on Image Processing, Computer Vision & Pattern Recognition, ser. IPCV’14. 2014 p. 304–11.
[8] Otsu N. A threshold selection method from gray-level histograms. Automatica. 1975;11(285–296):23–27.
[9] Roy S, Saha S, Dey A, Shaikh S, Chaki N. Performance evaluation of multiple image binarization algorithms using multiple metrics on standard image databases. 2014;249:349–360. doi:10.1007/978–3–319–03095–1_38.
[10] Tan PN, Steinbach M, Kumar V. Introduction to data mining. 1st ed. Boston, MA, USA: Addison-Wesley Longman Publishing Co., Inc.; 2005.
[11] Corporation C. Corel draw. 2014. Available: http://www.corel.com/corel/category.jsp?rootCat=cat20146&cat=cat3430091.
[12] Sigdel M, Aygün RS. Pacc – a discriminative and accuracy correlated measure for assessment of classification results. Proceedings of the 9th International Conference on Machine Learning and Data Mining in Pattern Recognition, ser. MLDM’13. Springer-Verlag: Berlin, Heidelberg; 2013.doi:10.1007/978–3–642–39712–7_22 p. 281–95.
All materials on the site are licensed Creative Commons Attribution-Sharealike 3.0 Unported CC BY-SA 3.0 & GNU Free Documentation License (GFDL)
If you are the copyright holder of any material contained on our site and intend to remove it, please contact our site administrator for approval.
© 2016-2026 All site design rights belong to S.Y.A.