Emerging Trends in Image Processing, Computer Vision, and Pattern Recognition, 1st Edition (2015)
Part I. Image and Signal Processing
Chapter 13. Automatic mass segmentation method in mammograms based on improved VFC snake model
Xiangyu Lu; Min Dong; Yide Ma; Keju Wang School of Information Science and Engineering, Lanzhou University, Lanzhou, China
Abstract
Mammography analysis is an efficient way for the early detection of breast cancer. In this chapter, we present an integrated method for mass auto-segmentation in breast. First of all, the local threshold method, rough set theory, and morphological filter are used to remove the label and enhance the mammogram. Second, we apply the Hough transformation algorithm on the preprocessed image and locate the lesion as an approximate parametric circle which would be used as the initial contour of Snake model followed by. Finally, the mass boundary is accurately segmented based on coarse localization. This approach is tested on digital database for screening mammography and mammography image analysis society database and the performance is evaluated from three aspects: detection rate, area-based accuracy, and distance-based boundary similarity measures based on manual-segmented results. By comparison, we find that our improved method has higher detection rate and the segmented contours are much closer to the actual area of objects. The promising results indicate that our approach can provide some theoretical basis for computer-aided image detection system.
Keywords
Mammography
Early breast cancer detection
Mass segmentation
VFC Snake model
Acknowledgments
Authors would like to thank the retrieval of DDSM and MIAS database from the Internet for the experiments of this chapter. This work is jointly supported by the National Natural Science Foundation of China (Grant No. 61175012), Science Foundation of Gansu Province of China (Grant Nos. 1208RJZA265 and 145RJZA181), Specialized Research Fund for the Doctoral Program of Higher Education of China (Grant No. 20110211110026), and the Fundamental Research Funds for the Central Universities of China (Grant No. lzujbky-2013-k06).
1 Introduction
Breast cancer is one of the common malignant tumors and remains the leading cause of cancer death among females, accounting for 23% of the total cancer cases and 14% of the cancer deaths in the world [1]. Mammography is a preferred method for early detection and also the most efficient and reliable tool for early prevention and diagnosis of breast cancer [2]. Mammograms are always with low contrast and the lesions are blurry and irregular, the shape and size of each mass or calcification are changeful, which cause the high misdiagnosis rate of breast cancer. For the past few years, computer-aid diagnosis has become the international research hot spot worldwide [3], which offers the doctors a reliable “second suggestion.”
Breast mass is an important symptom and its accurate segmentation is crucial to the treatment of breast cancer. Different algorithms for early lesion area detection in mammograms have been widely studied [4–7]. Kumar and Sureshbabu [4] detected mass in mammogram automatically using wavelet transform modulus maximum (WTMM), which located the region of interest (ROI) by multithreshold and then extracted the contour of ROI by WTMM method. Song et al. [5] proposed a hybrid segmentation method, which defined a local cost function for dynamic programming based on the rough region of mass obtained by template-matching technique, and the performance was evaluated by measuring the similarity. A new mass segmentation and automatic estimation method were presented based on robust multiscale feature-fusion and maximum a posteriori [6]. Before delineating the final mass, the dynamic contrast improvement, template matching, and posterior probabilities were used to obtain the mass candidate points. This method can segment the ill-defined or spiculated lesions.
Novel image detection methods are appearing along with the development of technology. In recent years, the active contour model (Snake) [8] is widely used in image processing, computer vision, etc. [9,10], and among which VFC (vector field convolution) Snake [11] model performs more excellent characteristics in segmentation of boundaries such as low dependence to initial contour, capability of convergence and superior noise robustness. While it doesn’t work well when we apply the typical VFC Snake method to extract the mass in mammograms, because of that the mass boundaries are always with low contrast and appearing blurry in the whole image.
Considering the disadvantage mentioned above, we proposed an integrated approach for mass autosegmentation in breast based on the improved VFC Snake model. The present method can detect the regions of masses in mammograms automatically and achieve promising results. This chapter is organized as follows. In Section 2, we present the methodology for mass localization and segmentation. Section 3 illustrates some experiments to verify the proposed method. Besides, the comparisons with typical VFC Snake model and the discussion also can be found in Section 3. Section 4 gives the conclusions of this chapter.
2 Methodology
The proposed methodology of breast mass segmentation can be schematically described in Figure 1. The method consists of four main processing steps: (1) obtaining the mammogram images; (2) mammogram preprocessing, to remove the label and enhance the image; (3) mass localization: for determining the regions of interest and mass location parameters; and (4) mass accurate segmentation.
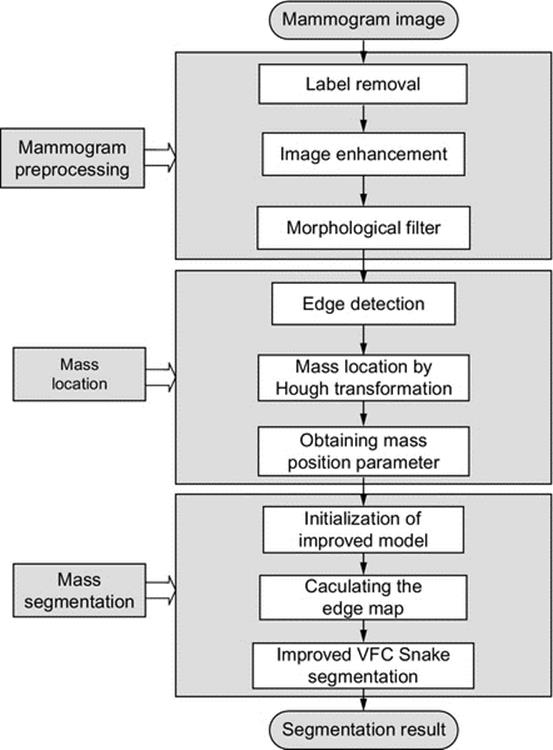
FIGURE 1 Flow chart of mass segmentation methodology.
2.1 Mammogram Database
The mammograms used in this work are taken from digital database for screening mammography (DDSM) [12] and mammography image analysis society (MIAS) [13]. These two databases are widely used in studies on mammogram analysis, because they are freely available and consist of plenty cases. For DDSM database, there are as many as 2620 cases and each image contains about 3000 × 5000 pixels with 16-bit or 12-bit gray level, we map the intensity value into the range [0–255] by using brightness adjustment method. The full raw mammograms provided in this database are with a format of LJPEG which is hard to read under Windows, thus we first convert it to the usable PNG format by a DDSM-software proposed by Chris [14]. The suspicious regions of each abnormality were provided with chain code data by experts. The MIAS database contains 322 mammograms and each image is 1024 × 1024 pixels with 8-bit gray level, the abnormality is given by a circle. These two databases also offered some other corresponding information such as type, severity, character, and so on.
2.2 Mammogram Preprocessing
2.2.1 Label removal
The mammogram image usually includes of breast region, pectoral muscle, background and label. In order to reduce the processing time and further study, the label should be removed. Here, we use the standard local threshold method which has been proved to be a convenient method to remove the label.
2.2.2 Image enhancement
To extract the mass region accurately and eliminate noise, the rough set (RS) theory [15] is applied. Traditional gray level transformation is not working well since the gray values between mass region, pectoral muscle, and gland are similar. RS theory that is used in reasoning from imprecise data is applied in information processing and artificial intelligence widely [16,17]. In this part, we choose image gradient attribute C1 and noise attribute C2 as the condition attributes. According to the indiscernibility relation concept, the mammogram is divided into two sub-images:
![]() (1)
(1)
![]() (2)
(2)
where P is the gradient threshold, Q is the noise threshold, f(i, j) is the gradient value calculated from the label-removed image, “s” denotes the sub-block. Considering smn as each pixel examine its neighbors to decide whether it is noise or not. If it is, then eliminate the noise by replacing the pixel value with Q. The sub-images that need to be enhanced are defined as follows:
![]() (3)
(3)
![]() (4)
(4)
Next, we enhance I1 and I2, respectively, and get the final image by merging the sub-images: I2 is enhanced by histogram equalization method and I1 is transformed below:
![]() (5)
(5)
Here, we set ρ = γ = 1.5. After enhancement, the boundary contrast between the mass and surrounding tissue becomes more obvious.
2.2.3 Morphological filter
Then we amend the enhanced image using morphological filter. The preprocessed image is shown in Figure 2.
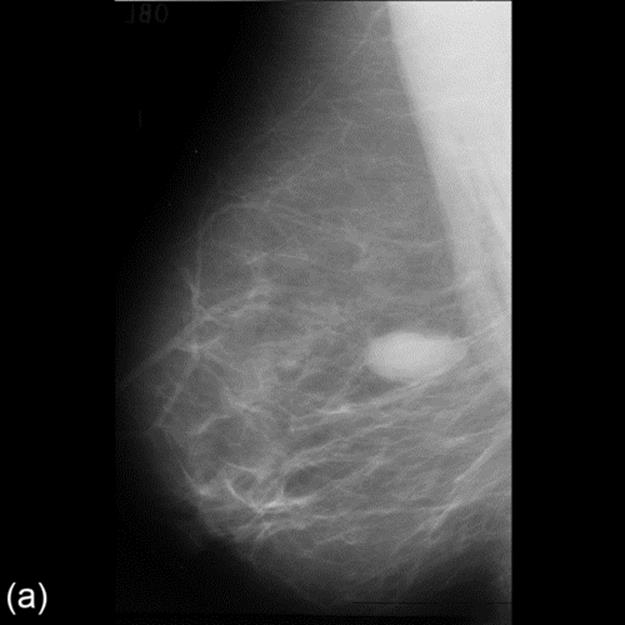
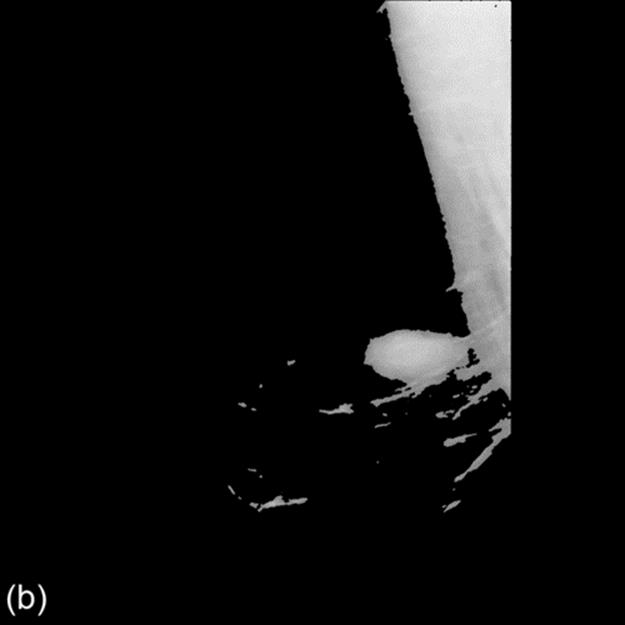
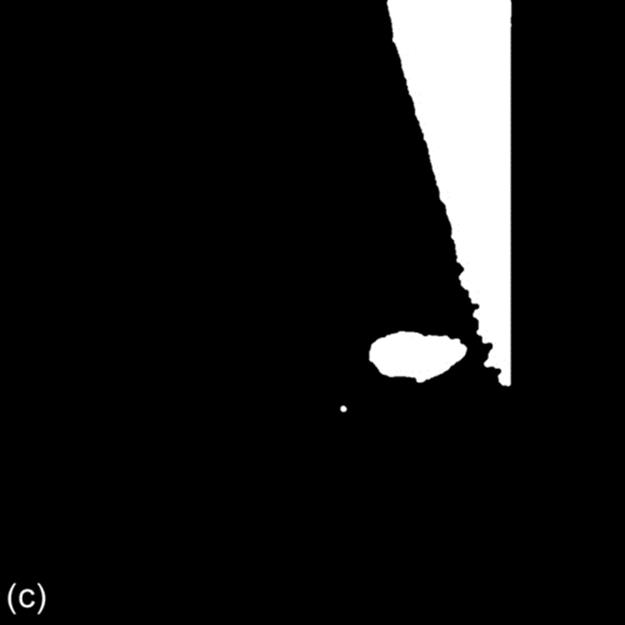
FIGURE 2 Image(from MIAS) before and after enhancement and preprocessed results.
2.3 ROI Extraction and Location
2.3.1 Edge extraction
The preprocessed image is composed of pectoral muscle and mass region. Before removing the pectoral muscle, the edge detection operator is used to extract the edge first.
2.3.2 Hough transform detection
From Figure 3, the edge of pectoral muscle appears as a triangle while mass edge usually appears as an ellipse or circle; thus, we can obtain the approximate edge of mass by performing the linear Hough transform (LHT) [18] and circular Hough transform (CHT) on the extracted edge image, which, respectively, are defined as formulas (6) and (7). Here, Ωpectoral is the pectoral muscle detected by LHT on edge image, Ωmass is the initially segmented mass obtained by CHT on the region Ωedge-pectoral, where Ωpectoral is removed. (ai,bi) is the center position of the circle and R is the radius. The location results are shown in Figure 3:
![]() (6)
(6)
![]() (7)
(7)
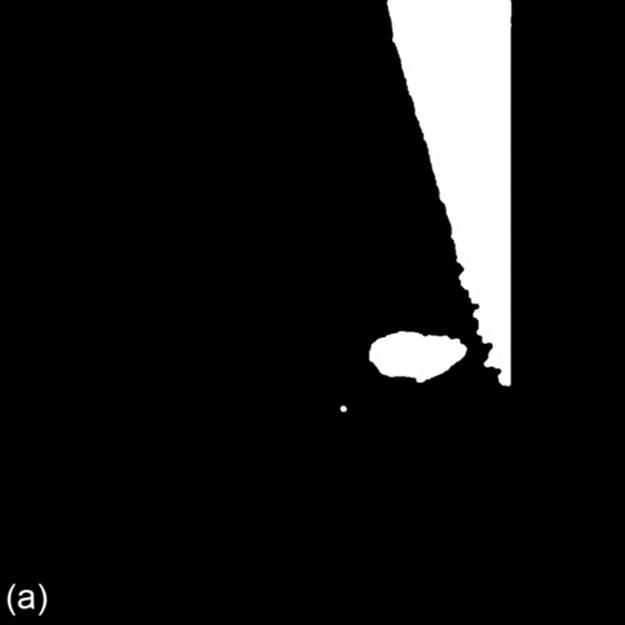
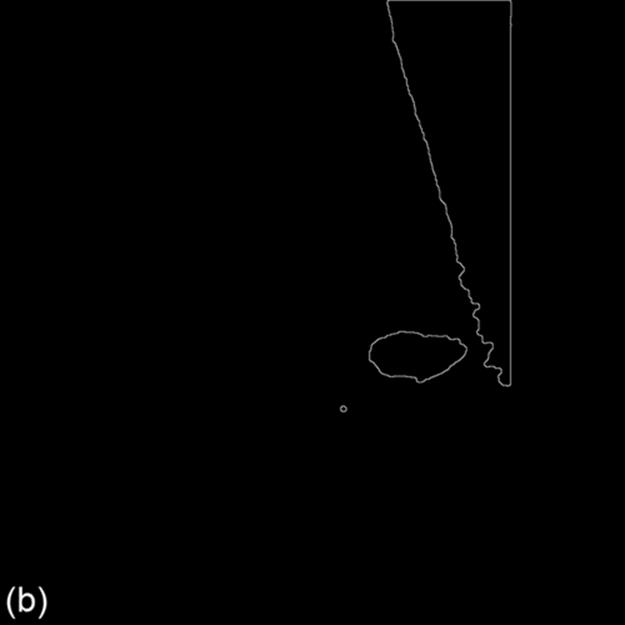
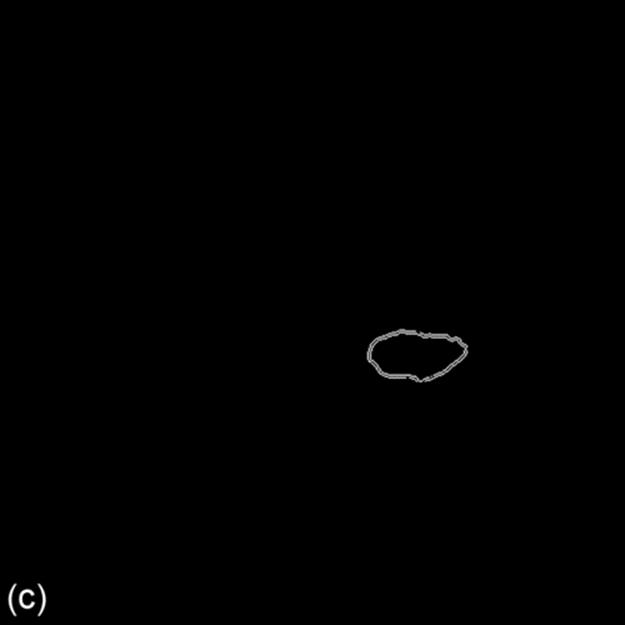
FIGURE 3 Edge extraction and mass location results (1024 × 1024 pixels).
2.3.3 Mass location parameter
For a further work, we obtain the mass position coordinate by defining a circle, whose center corresponds to the center of extracted mass egde, and the radius of which is a middle value of the distance from boundary pixel to the center position, indicating as: (cx, cy) and r. For Figure 3, the parameter is: (682, 586), r = 46. The parametric circle could be used as the initial contour of deformable model followed by.
2.4 Mass Segmentation
The results of mass location are rough and exist certain gap with the actual boundary, we utilize the Snake model to perform an accurate segmentation further.
2.4.1 Typical VFC Snake model
The Snake model defined a parametric curve guided by external forces and internal forces that pull it toward the edge of ROI until the energy function achieves the minimum. The curve v(s) and the minimizing energy function E(v) forms are
![]() (8)
(8)
 (9)
(9)
![]() (10)
(10)
where Eint is the internal energy decided by the curve, α and β control the continuity and smoothness, respectively. Eext is the external energy decided by the image information. The VFC Snake is an active contour model whose external force is VFC field. First defined a vector field kennel:
![]() (11)
(11)
where m(x, y) is the vector magnitude and n(x, y) is the unit vector pointing to the kennel origin (0, 0):
![]() (12)
(12)
![]() (13)
(13)
Here, r = (x2 + y2)1/2. The external force is calculated by convoluting the vector field kennel k(x, y) and the edge map f(x, y), defined as
![]() (14)
(14)
2.4.2 Improved VFC Snake model
First, we use the typical VFC Snake model to detect the lesion area; however, there are obvious distortions in the segmented results. By analyzing the force field of the model, we observe that the distribution of which is disordered (Figure 4(b) and (c)), and this causes the misleading of the active contour to the interference tissues rather than the real mass boundaries. Thus, the main idea of our proposed segmentation algorithm is to improve the force field by defining a new and clear edge map f(x, y). First, the gradient value of each pixel is improved using RS theory method by setting a gradient threshold to judge whether the pixel belongs to a potential boundary or not. If it is, then these pixels should be enhanced. Next, the edge map f(x, y) is calculated by performing the Canny operator [19], which is considered to have more excellent features like stability and accuracy compared to the gradient operator. As shown in Figure 4(d) and (e), it is obvious that the improved force field distribution turns to be more regular, which appears much evenly near the boundaries and the areas mixed in normal glands.
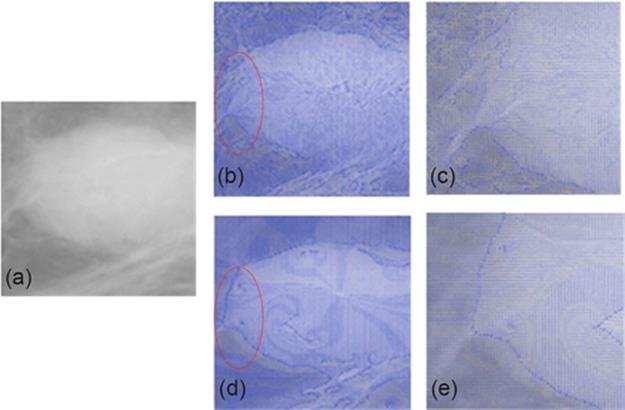
FIGURE 4 Force field of typical and improved VFC Snake and the enlarged images.
Besides, the performance of typical VFC Snake model depends on the position of initial contour around the mass, which usually is a circle formed by the coordinate position and radius. Here, we set the initial contour by using the parametric circle obtained in the mass location part.
3 Experiment results and discussion
Our proposed method was totally tested on 400 mammograms with abnormal breast regions from DDSM and MIAS database and the experimental results are shown in Figures 5 and 6, respectively. We can observe that our approach can achieve much better results in comparison with the typical VFC Snake method. During this test, we set the parameter of VFC Snake model as: α = 0.5, β = 0.2, and the iteration is about 30. To fully explain the superiority of our proposed method in visual, the illustrated mammograms consist of craniocaudal and mediolateral oblique view, whose severity includes benign and malignant, and each case contains only one abnormality.
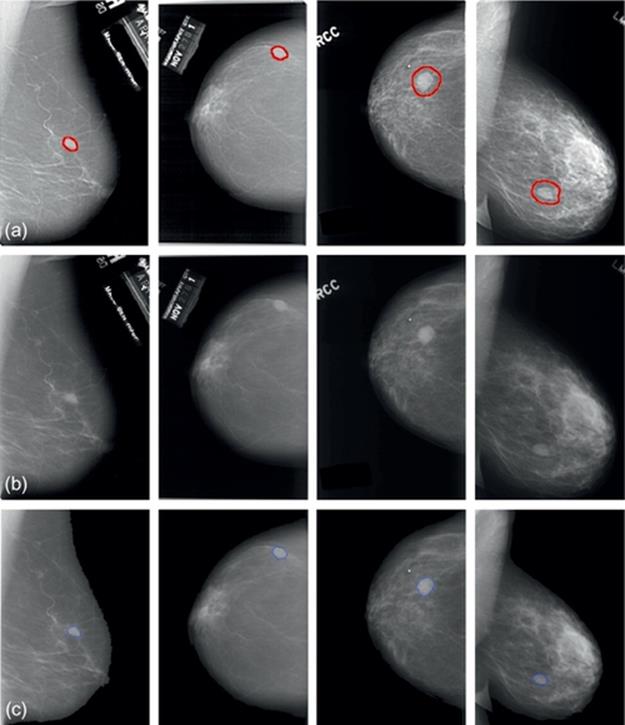
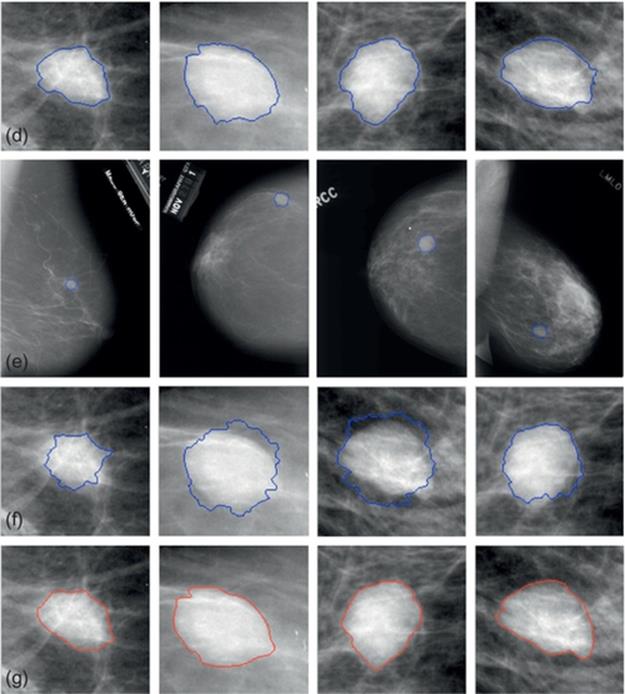
FIGURE 5 Experimental results of mammograms from DDSM database: (a)–(d) The “thumbnails”. (a-1)–(d-1) Full raw images. (a-2)–(d-2) Results by our proposed method. (a-3)–(d-3) Results by typical VFC Snake model. (a-4)–(d-4) Results by manually.
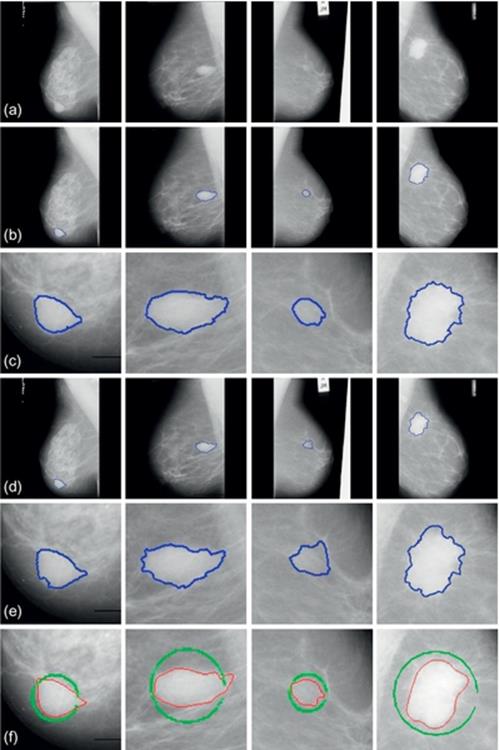
FIGURE 6 Experimental results of mammograms from MIAS database: (a)–(d) Original images. (a-1)–(d-1) Results by the proposed method. (a-2)–(d-2) Results by typical VFC Snake model. (a-3)–(d-3) The ground truth.
3.1 Experiments Results
The suspicious regions of full raw images from DDSM were given by chain code data as ground truth. This database also provided thumbnail images for visual browsing of each case as shown in Figure 5(a)–(d). The severity of these selected images is benign and the approximate abnormal regions have been marked in this database. To contrast, we illustrate the manual-segmented results in (a-4)-(d-4). Here, we utilize the parametric circle obtained from mass location procedure as the initialization of VFC Snake model and segment the lesion area. Results gained by our method are shown in Figure 5(a-2)–(d-2), labels in these mammograms have been removed already. From the enlarged images, we can clearly see that the contours converge precisely to the real boundaries in all cases and are much similar to the manual ones. For comparison, Figure 5(a-3)–(d-3) states the same cases detected by the typical VFC Snake model, unfortunately, these results are seriously influenced by the blurry tissues and can’t deform to the objects completely, even the initial contours are very close to the actual boundaries. Thus, we can say that the improved model is in lower dependence on the initial contour and with stronger capability of convergence than the typical method, that is, our approach performs much better when we segment the masses in mammograms from DDSM database.
The MIAS database has offered the central coordinate and radius of each abnormal region showing in Figure 6(a-3)–(d-3), as well was the ground truth segmented manually. Here, we also initialize the VFC Snake model using the parametric circle obtained by mass location. From Figure 6(a-2)–(d-2), we observe that the results segmented by the typical method exist serious distortions and the contours can hardly converge to the real boundaries. Compared with the typical model, our proposed method can completely remove the labels or interference and achieve more robust and accurate results. As we can see, the curves are much more close to the ground truth and precisely tend to the object even in blurry regions.
From the enlarged results of our method, we find that the margin of the last image is rough and the other ones are smooth, that is because the severity between the last lesion and the rest are different, the last lesion is malignant while others are benign. Our results objectively reflect the pathology characteristics of actual masses to some extent that the malignant masses are always with burrs. This performance is somewhat benefit to the early diagnosis of breast cancer. Therefore, for a CAD system, we are able to extract the features of our detected results and determine the severity of abnormalities for a further work to give a considerable “second suggestion” to the clinician.
3.2 Algorithm Performance Analysis
We test the proposed method on the DDSM and MIAS database and evaluate the performance from three aspects.
3.2.1 Detection rate
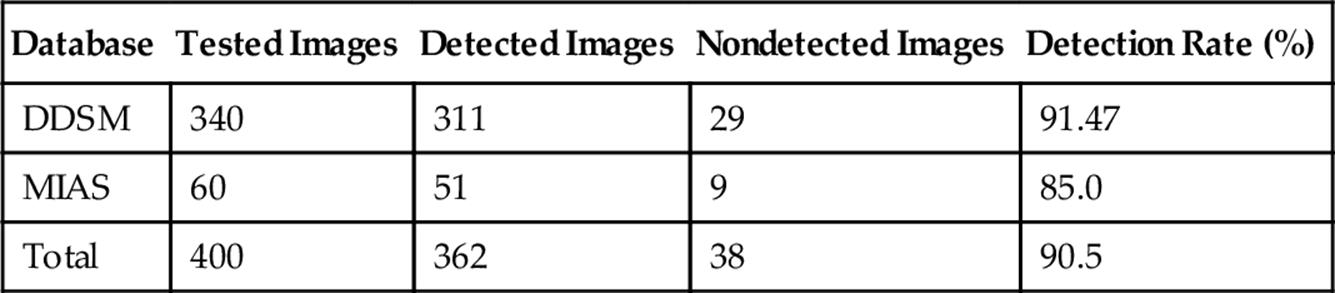
First, we compute the detection rate, our evaluation principle is that the autosegmented region by the proposed method is completely within the criterion region by the experts. In the case of DDSM database, the criterion region is the outline formed by chain code data, and for MIAS database, the criterion region is the circle formed by the center coordinates and the radius. The detection rates of masses for each database are shown in Table 1. As we can see, 362 images are successfully extracted in total and the average detection rate is 90.5%, and even reaches up to 91.47% for the DDSM images. While it is lower for the MIAS images, the lesions in dense breast images of MIAS are always embedded in the gland and we can hardly obtain the mass position by location or edge map by edge detection operator for the deformable model.
Table 1
Mass Detection Rate by the Proposed Method
3.2.2 Segmentation accuracy
To further explain the accuracy of our algorithm, we introduce another area-based evaluation method then. The area overlap ratio criteria are the most common evaluation criteria in medical images, which are the ratio of overlapped area between the segmented region of VFC Snake method and the criterion region of ground truth segmented manually. The performance of the proposed method and the typical VFC Snake method is tested on the successfully detected mammograms of MIAS by the following equation:
![]() (15)
(15)
where L is the area segmented by VFC Snake model, T is the area of ground truth. SL∩ T and SL∪ T are the intersection area and union set area of the two regions, respectively. The average area overlap ratio and the variance of the segmentation results are shown inTable 2. We can see that the average area overlap ratio of improved method is much higher than the typical method, and the variance is much lower, that is to say, our auto-segmented results are generally much more close to the ground truth. It is proved that our approach indeed performs much more excellent results compared with the typical method.
Table 2
Area Overlap Ratio of Different Methods
|
Method |
Mean (%) |
Variance (%) |
|
Typical method |
76.0151 |
11.5249 |
|
Improved method |
90.4073 |
2.1556 |
3.2.3 Segmentation similarity
Finally, we introduce a new measure method of medical image segmentation which is based on boundary distance-based similarity [20]. The above-mentioned area-based criteria have reflected the difference between the region of arithmetic-segmented result and manual-segmented result, while it could neither reflect the difference nearby the contour nor estimate whether the arithmetic-segmented curve is bigger or smaller than the ground truth.
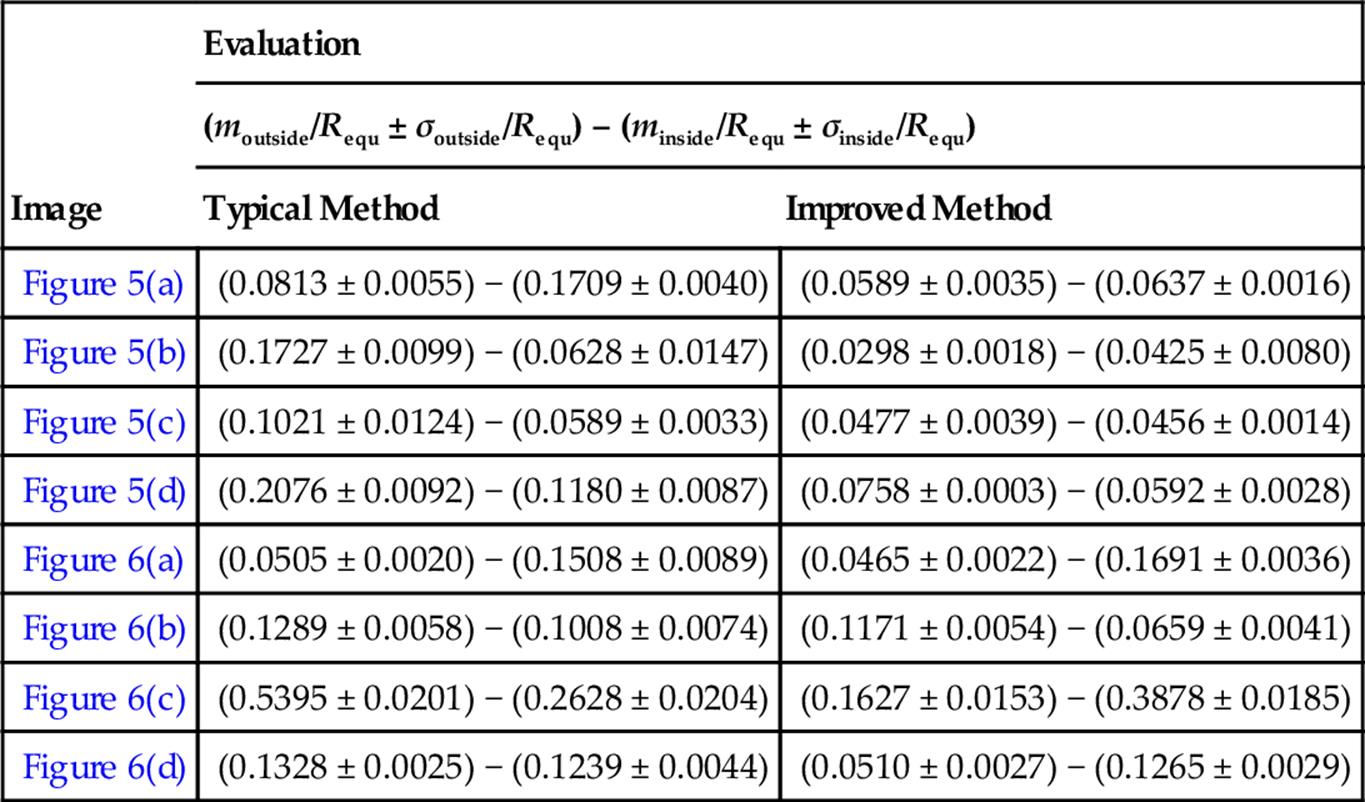
The new evaluation index is described as expression (16), where moutside and σoutside are the mean and standard deviation of the bigger portion, which consist of points from segmented contour outside the ground truth (segmented manually), and minside and σinside are the mean and standard deviation values of the smaller portion, which are inside. Requ is the radius of a circle equivalent to the segmented region. Here, the value of σ reflects the level of similarity, the smaller the σ value is, the higher similarity level has been reflected.
 (16)
(16)
For the arithmetic-segmented contour A = {a1, a2,…, ak} and the manual-segmented curve B, if there are m points outside B and n points inside B, then,
 (17)
(17)
 (18)
(18)
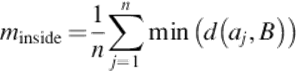 (19)
(19)
 (20)
(20)
Here, d stands for the Euclidean distance. In this part, we access the similarity of eight mammograms which illustrated in Figures 5 and 6.
From Table 3, compare the corresponding values of m and σ of each image, we can find that most of the moutside, minside and almost all σoutside, σinside values obtained by modified method are much smaller than the typical results. The m value shows how much the curves deviated, and the smaller m indicates that the curve is much close to the real ones. The σ can exactly reflects the level of similarity of two curves, the smaller σ is, the much similar to the manual-segmented results. Thus, we can come to the conclusion that the contours obtained by modified method are more similar to the manual-segmented results compared with the typical method.
Table 3
The Similarity of Different Methods
4 Conclusions
In this work, we present an effective integrated approach based on the improved VFC Snake model for mass automatic segmentation in mammogram which with low contrast and blurry boundaries. First of all, the local threshold method, RS theory, and morphological filter are applied to preprocess the mammograms to remove the labels and enhance the whole image. Then we use the LHT and CHT algorithms to locate the massive lesions and the position of which parametrically indicated as an approximate circle. The mass segmentation stage uses the parametric circle to initialize the deformable method which is defined by improving the force field of typical VFC Snake model and extract the mass boundary accurately. The proposed approach is tested on DDSM and MIAS database, respectively, and the results show that our algorithm achieves a higher detection rate and superior segmentation accuracy compared with the typical VFC Snake model. What’s more, the segmented contours are much similar to the actual boundary of objects. In conclusion, the improved approach can not only locate and segment the mass automatically, but also in lower dependence on the initial active contour and with stronger capability of convergence. Besides, this algorithm is robust to the interference of blurry areas and tissue and able to converge precisely to the object. In addition, the results conform to the pathology characteristics of actual masses to some extent and benefit to early detection of breast cancer. That is to say, the proposed approach can provide some important basis to improve the CAD system.
This is an extension of the paper published on the IPCV’14 [21]. Here, we further evaluate the performance of our proposed algorithm using a novel distance-based boundary similarity measure based on the manual-segmented result mainly. In future work, we would like to classify the breast masses to benign and malignant based on the auto-segmented results of this chapter.
References
[1] Jemal A, Bray F, Center MM, Ferlay J, Ward E, Forman D. Global cancer statistics. CA Cancer J Clin. 2011;61(2):69–90.
[2] Xu G, Li K, Feng G. Comparison of three imaging methods in the early diagnosis of breast cancer. J Capital Med Univ. 2009;30(3):293–297.
[3] Ouyang C, Ding H, Wang G. Segmentation of masses in mammograms. Beijing Biomed Eng. 2007;26(3):237–241.
[4] Kumar P, Sureshbabu R. Segmentation of region of interest and mass auto detection in mammograms based on wavelet transform modulus maximum. Digit Image Process. 2011;3(7):415–421.
[5] Song E, Xu S, Xu X, Zeng J, Lan Y, Zhang S, Hung CC. Hybrid segmentation of mass in mammograms using template matching and dynamic programming. Acad Radiol. 2010;17(11):1414–1424.
[6] Abbas Q, Celebi M, Garcia I. Breast mass segmentation using region-based and edge-based methods in a 4-stage multiscale system. Biomed Sig Process Control. 2013;8(2):204–214.
[7] Wang Y, Tao D, Gao X, Li X, Wang B. Mammographic mass segmentation: embedding multiple features in vector-valued level set in ambiguous regions. Pattern Recogn. 2011;44(9):1903–1915.
[8] Kass M, Witkin A, Terzopoulo D. Snakes: active contour models. Int J Comput Vis. 1988;1(4):321–331.
[9] Mouelhi A, Sayadi M, Fnaiech F. A supervised segmentation scheme based on multilayer neural network and color active contour model for breast cancer nuclei detection. In: 2013 International conference on electrical engineering and software applications (ICEESA); 2013:1–6.
[10] Guo M, Wang Z, Ma Y, Xie W. Review of parametric active contour models in image processing. J Conv Inf Technol. 2013;8(11):248–258.
[11] Li B, Scott T. Active contour external force using vector field convolution for image segmentation. IEEE Trans Image Process. 2007;16(8):2096–2106.
[12] Heath M, Bowyer K, Kopans D, Moore R, Kegelmeyer W. The digital database for screening mammography. In: The Fifth International Workshop on Digital Mammography; 2001.
[13] Suckling J, Parker J, Dance DR, Astley S, Hutt I, Boggis C. The mammographic image analysis society digital mammogram database. 1994.
[14] Chris R. Software. [Online]. Available: http://microserf.org.uk/academic/Software.html.
[15] Pawlak Z. Rough set approach to knowledge-based decision support. Eur J Oper Res. 1997;99(1):48–57.
[16] Hassanien A, Abraham A, Peters J, Schaefer G, Herry C. Rough sets and near sets in medical imaging: a review. IEEE Trans Inf Technol Biomed. 2009;13(6):955–968.
[17] Liu Y, Ma Y, Xia C, Li S. Rough sets theory and its applications in image processing. Appl Res Comput. 2007;24(4):176–178 [Jisuanji Yingyong Yanjiu].
[18] Hough PV. Method and means for recognizing complex patterns. U.S. Patent 3069654; 1962.
[19] Canny J. A computational approach to edge detection. IEEE Trans Pattern Anal Mach Intell. 1986;8(6):679–698.
[20] Ha Z, Li C, Wang J, Zhou K, Yang Z. A new evaluation method for medical image segmentation. Beijing Biomed Eng. 2008;27(4):385–388.
[21] Lu X, Ma Y, Xie W, Li T. Automatic mass segmentation method in mammograms based on improved VFC Snake model. In: The 2014 International conference on image processing, computer vision, and pattern recognition; 2014.
All materials on the site are licensed Creative Commons Attribution-Sharealike 3.0 Unported CC BY-SA 3.0 & GNU Free Documentation License (GFDL)
If you are the copyright holder of any material contained on our site and intend to remove it, please contact our site administrator for approval.
© 2016-2026 All site design rights belong to S.Y.A.