Emerging Trends in Image Processing, Computer Vision, and Pattern Recognition, 1st Edition (2015)
Part I. Image and Signal Processing
Chapter 15. Traffic control by digital imaging cameras
Rowa’a Jamal; Karmel Manaa; Maram Rabee’a; Loay Khalaf Electrical Engineering Department, University of Jordan, Amman, Jordan
Abstract
Traffic is considered one of the fastest developing technologies in the world. It is noticeable that the number of vehicles around the world is significantly increasing. This led to the search for ways to develop the traffic control technology.
The first cameras installed for traffic monitoring have been developed at the end of the twentieth century, in 1960s. The growth of the traffic cameras was gradual from the early 1970s. However, the development became steady over the last 30 years. This development leads to the growth of multipurpose traffic cameras in several countries across the world.
The scope of our project has concentrated on producing a traffic control camera, which can be installed at the crossroads, traffic lights.
The whole project was simulated using "MATLAB 7.7.0." It is a powerful tools used by designers of image processing. Many researches describe principle, design, and testing procedures.
After some general introduction, traffic detectors principles will be provided. After all, all the design issues and information will be used to construct a traffic light camera, able to detect red-light and speed violations. Detailed calculation of the overall performance will be described.
Keywords
Image processing
Traffic camera
Plate’s recognition
Traffic control
1 Introduction
Road crashes are considered as one of the major causes of death and injury. Over the years, there has been a noticeable steady increase in traffic violations and problems. This led the search for ways to control traffic with the intentions of reducing collisions by enforcing traffic laws, including traffic light violation, red-light violation, and speed violation. Over the last couple of decades, researchers have deliberately worked on improving the control at traffic intersections and traffic lights to reduce traffic jams and accidents [1]. The bottleneck in traffic problems is related to the limited resources in the current infrastructure, such as road crossing or merging. The traffic problems get worse with time, since the number of vehicles is increasing significantly.
The use of automated traffic control technologies is now wide spread throughout the world. Worldwide, despite of variation in the nature of these applications, they have provided positive road safety benefits. The first red-light camera was introduced in 1965 in the Netherlands. This camera was based on using tubes stretched across the road to detect the violation and subsequently trigger the camera [2]. New York's red-light camera program went into effect in 1993 [3].
The first digital camera system was introduced in Canberra in December 2000, and digital cameras have increasingly replaced the old film cameras in other locations since then [4]. From the late 1990s, digital cameras began to be introduced, those cameras can be installed with a network connection to transfer real-time live images to a central processing unit, for that they have advantages over film cameras in speed monitoring. However, film-based systems may provide superior image quality in the variety of lighting conditions encountered on roads. New film-based systems are still being used, but digital ones are providing greater proficiency, lower maintenance and are now more popular.
2 Paper Overview
This paper discusses the production of a traffic control camera used to obtain red-light violation, license plate recognition, and speed detection of the vehicles. The proposed camera is designed to be used at the bottleneck of traffic; intersections with traffic lights. Since there are several technologies used to obtain the same aim of this study, other characteristics were taken into consideration to make it more attractive.
The major step in using such cameras is monitoring the traffic at the red light by capturing a video. Then the video is processed by using image-processing techniques. The image-processing code was developed using Matlab 7.7, whereby the program reads video file, converts it to frames, and then by character segmentation, it can recognize the type of the violation and license plate number. The main tasks of this camera include detection of the red-light violation. Simply, the camera will check the color of the light, if it was red, it will compare between a saved picture for the street in such red-light case (the street in front of the traffic light must be empty) and the captured one. If there is any violation, the camera will capture a photo for the car and perform plate recognition.
On the other hand, for the speed violation, the camera will measure the distance between two points passed by the car and the time elapsed through this distance. Then, it will calculate the speed of the car by dividing the distance over the time. Also, if there is any violation in the speed, it will capture and perform plate recognition for the car. The system continuously monitors the traffic signal and the camera is triggered by any vehicle entering the intersection. Automatic number plate recognition can be used for purposes unrelated to enforcement of traffic laws. In principle, any agency or person with access to data either from traffic cameras or cameras installed for other purposes can track the movement of vehicles for any purpose.
3 Implementation
The main effort of this research is the use of image processing of captured images of a digital camera. The images used in this project and the video were taken by an inexpensive Canon 500 D, digital camera of 15 megapixel and 3.00 × zoom (as shown in Figure 1). It records videos with very high accuracy, full HD with 30 frames/s. Throughout this section, the design essentials, basics, and procedure will be discussed separately.
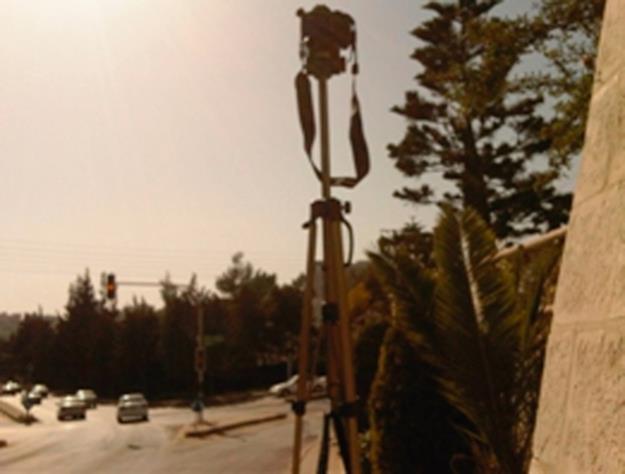
FIGURE 1 Canon 500 D digital camera.
The desired system should be able to meet the requirements and goals stated below:
• Ability to detect the speed of the vehicle that crosses the traffic light with accuracy of 15%.
• Ability to recognize the vehicle registration plate with accuracy of 75%.
• Ability to identify cars crossing the red light.
4 Traffic detectors
This section describes current technology associated with traffic control.
4.1 Induction Loops
Inductive-loop detector technology has been in use for the detection of vehicles since the early 1960s. It consists of a loop of wire and an electronic detection unit. Simply, the operation is based on the principle of metal detection, relying on the fact that a moving metal will induce an electrical current in a nearby conducting wire. With a vehicle detector, the loop is buried in the roadway and the object to be detected is a vehicle (as shown in Figure 2).
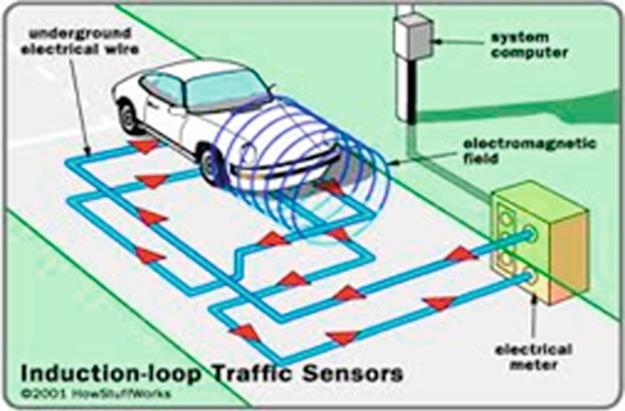
FIGURE 2 Induction loop.
Vehicle-detection loops are used to detect vehicles passing a certain area; for our approach, a traffic light. An insulated, electrically conducting loop is installed in the pavement. The electronic unit transmits energy into the wire loops at frequencies between 10 and 200 kHz, depending on the model. The inductive-loop system behaves as a tuned electrical circuit in which the loop wire is considered as the inductive elements. When a vehicle passes over the loop or is stopped over the loop, the vehicle induces eddy currents in the wire loops, which decrease their inductance. The decreased inductance actuates the electronics unit output relay or solid-state optically isolated output, which sends a pulse to the traffic signal controller signifying the passage or presence of a vehicle.
4.2 Microwave Radar
Radar is an object-detection system which uses radio waves to determine the range, direction, or speed of objects. It can be used to detect motor vehicles. The radar antenna transmits pulses of radio waves which bounce off any object in their path. The object returns a small part of the wave’s energy to the receiver antenna which is usually located at the same site as the transmitter.
The basic use of the traffic radars is the measurement of the speed of the vehicle. Traffic radar calculates speed from the reflections it receives. It uses a phenomenon of physics known as the Doppler principle. The classic example is heard along roads. As the car approaches, you hear the high pitch sound of the car horn. The instant the car passes and begins to move away, you hear a lower pitch sound. The car itself is making the same sound for both coming and going, but for a stationary listener, the speed of the car adds to the pitch of its sound as it approaches, and subtracts as it departs. This change from true pitch is called the Doppler shift, and the magnitude of the change depends upon the speed of the car. The Radar compares the shifted frequency of the reflection to the original frequency of the beam it sent out and from the difference it calculates speed. Figure 3 shows how microwave radar detects the speed of the vehicle.
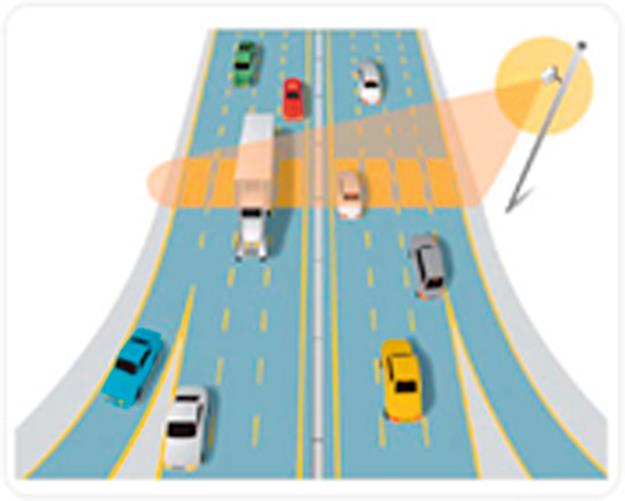
FIGURE 3 Microwave radar.
4.3 Infrared Sensors
Active and passive infrared sensors are manufactured for traffic flow monitoring applications. Active infrared sensors illuminate detection zones with low-power infrared energy transmitted by laser diodes operating in the near infrared region of the electromagnetic spectrum. A portion of the transmitted energy is reflected or scattered by vehicles back toward the sensor. The diodes operated in the near infrared spectrum at 880 nm. The signal modulation prevented interference from other sources of infrared energy, including sunlight. Two transmitter-receiver systems measured the vehicle speed and one measured the vehicle height. When trucks susceptible to rollover or jackknifing were encountered, flashers were activated to warn drivers to reduce speed [5].
Passive sensors do not transmit energy; they detect energy from two sources:
1. Energy emitted from vehicles, road surfaces, and other objects in their field-of-view.
2. Energy emitted by the atmosphere and reflected by vehicles, road surfaces, or other objects into the sensor aperture
The energy captured by infrared sensors is focused by an optical system onto an infrared-sensitive material mounted at the focal plane of the optics. This material converts the reflected and emitted energy into electrical signals. Real-time signal processing is used to analyze the signals for the presence of a vehicle. The sensors are mounted overhead to view approaching or departing traffic. They can also be mounted in a side-looking configuration. Infrared sensors are utilized for signal control; volume, speed, and class measurement; detection of pedestrians in crosswalks; and transmission of traffic information to motorists.
4.4 Video Detection
Video detection is based on real-time image processing providing efficient wide-area detection well suited for registration of incidents on roads and in tunnels. Connected to Traffic Controllers, the application can also be used for vehicle detection at signalized intersections where it is difficult or expensive to install inductive loops. Video-detection systems are also considered nonintrusive.
Video detection combines real-time image processing and computerized pattern recognition in a flexible platform; it uses a vision processor to analyze real-time changes in the image. In this system, cameras called image sensors capture images and provide a video signal to the vision processor. The video signal is analyzed and the results are recorded. Video image detection is one of the leading alternatives to the commonly used loop detectors. It is progressively being used to detect traffic intersections and interchanges. This is because video detection is often cheaper to install and maintain than inductive loop detectors at multilane intersections. In addition to speed, volume, queues, and headways, it provides traffic engineers with many other traffic characteristics, such as level of service, space mean speed, acceleration, and density. Video detection is also more readily adaptable to changing conditions at intersections (e.g., lane reassignment and temporary lane closure for work zone activities). This is one of the biggest advantages of video image detection. It provides traffic managers with the means to reduce congestion and improve roadway planning. Additionally, it is used to automatically detect incidents in tunnels and on freeways, thus providing information to improve emergency response times of local authorities [6].
Through the discussion about the image-processing cameras, it is noticeable that they have these advantages:
• Monitors multiple lanes and multiple detection zones/lane.
• Easy to add and modify detection zones.
• Rich array of data available.
• Provides wide-area detection when information gathered at one camera location can be linked to another.
• Generally cost effective when many detection zones within the camera field-of-view or specialized data are required.
5 Image processing
Image processing is defined as a process involving the change in the natural appearance of an image. It consists of an input and an output. The input is an image, whereas the output is a set of characteristics related to the image, also the output may be an image.
The main aim of image processing lies in converting the image for better human interpretation and machine perception. The operation of image processing may contain several actions including making the images to appear sharper, removing motion blur from images, removing noise from images, obtaining the edges of an image and removing details from an image [7].
5.1 Basic Types of Images
There are a total of four basic types of images, namely, binary, grayscale, true color or red-green-blue (RGB), and indexed. The descriptions of all these images are provided in the following sections.
5.1.1 Binary image
A binary image is a digital image that has only two possible values for each pixel. The pixel is made up of either in black or white color. Binary images are also called bi-level or two levels. This means that each pixel can be stored as a single bit in either binary “0” or “1.” Figure 4 shows a binary image.
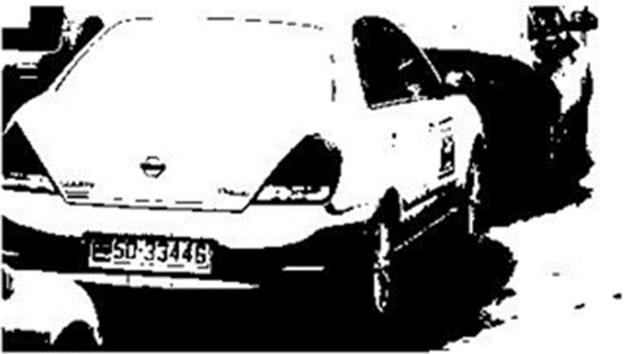
FIGURE 4 Binary image.
5.1.2 Grayscale image
A grayscale digital image is an image in which the value of each pixel is not the same. The only colors are shades of gray. Each image pixel is made up of shades of gray from 0 (black) to 255 (white). Each pixel can be represented by 1 byte or 8 bits. The reason for having such an image was because less information is needed to be provided for each pixel (Figure 5).
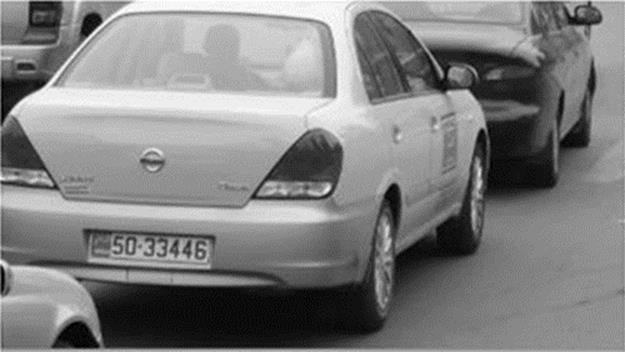
FIGURE 5 Grayscale image.
5.1.3 True color or RGB image
Each pixel will have a particular color that is being described by the amount of red, green, and blue in it. If each of the components has a range of 0-255, this will give a total of 224 different possible colors in an image. Each pixel will require 24 bits and they are called 24-bit color images (Figure 6).
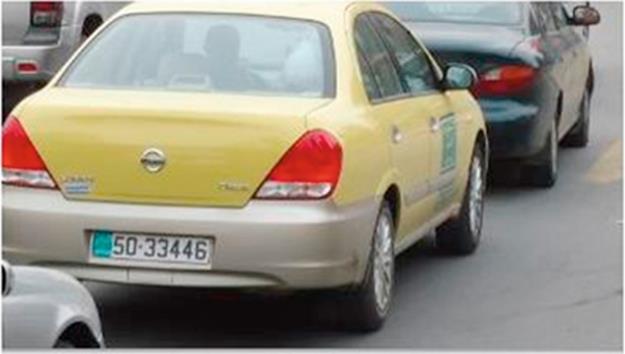
FIGURE 6 RGB image.
5.1.4 Indexed images
Each pixel has a value that does not give its color but an index to the color in the map which has a list of all the colors used in that image.
6 Project design
The procedure followed to obtain the interruption whether for the red violation or the speed violation is shown in Figure 6.
Image Acquisition: The proposed design was performed through recording a video by using a digital camera with a focus of 14 mm then converting this video to a series of images in order to obtain the principle of image processing through MATLAB 7.7.0 version. Whereas all the images obtain will be JPEG format.
Preprocessing
• Cropping: The basic type of preprocessing refers to image cropping. Cropping refers to the removal of the outer parts of an image to improve framing, accentuate subject matter or change aspect ratio. In other words, it refers to removing unwanted areas from a digital image capture. This is needed in the project in the part of the vehicle registration plate.
Image cropping can be performed either by manually or by defining the selected spatial coordinates [a b c d]. a is the pixels from left, b is the pixels from bottom, c is the width of the selected area, and finally d is the height of the selected area.
• Bwarea Function: This function from the MATLAB basically removes from a binary image all the connected components (objects) which are lower than the defined pixel. After which it will reproduce another binary image with the entire pixel that are higher or equal to the defined pixel.
Segmentation: Segmentation is the process of assigning a label to every pixel. In other words, the segmentation is partitioning a digital image into multiple segments "pixels." The goal of segmentation is to simplify the representation of an image into something that is more meaningful and easier to analyze. Whereas the result of image segmentation is a set of segments that cover the entire image, or a set of contours extracted from the image. The simplest method of image segmentation is called the threshold method. This method is based on threshold value to turn a grayscale image into a binary image. During this process, every pixel in an image is called as object pixel if the value is greater than the threshold value and it is named as background pixel if the value is lower than the threshold value. An object pixel is being given a “1” value while the background pixel is given the “0” value. After which a binary image is being created with all the object and background pixels.
Representation and Description
• Edge Detection: Edge detection is the process for detecting meaningful discontinuities in intensity values; to find places where in an image where the intensity changes rapidly. Using: Sobel, Prewitt, Roberts or Canny method. What has been used in this project is Sobel edge detection.
• Strel Function: It is a function used to create a structuring element. It has many syntaxes; one from them is “strel(‘rectangle’, MN)” which was used in this project to create the plate rectangular shape and MN represents a two-element vector of nonnegative integers (Figure 7).
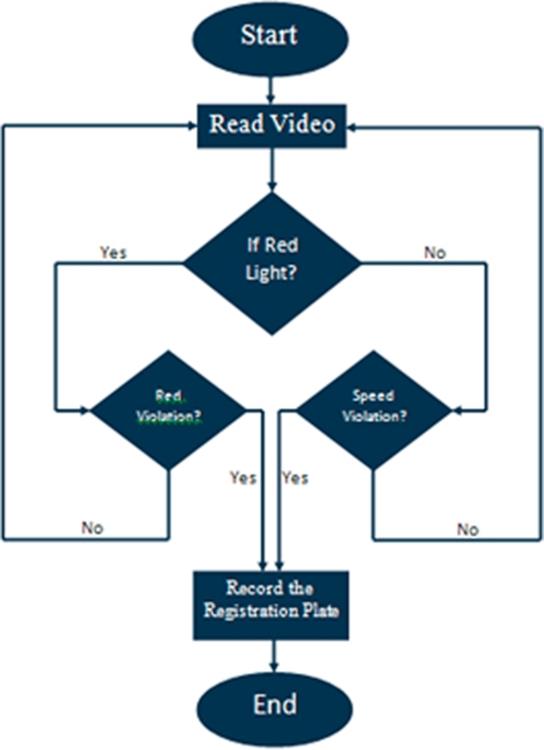
FIGURE 7 System flow chart.
6.1 Red-Light Violation
This part has been made by taking the absolute difference between the current inputs with a reference one. So it could be known if the car had passed the red line.
By applying the following steps:
– Define the red-light position in the traffic light.
– Define the reference frame to compare with (when the street is empty).
– Define the frame where the violation occurred.
– Take the absolute difference between the two frames.
For that it could be known if the car had passed the red line showed in Figure 8.
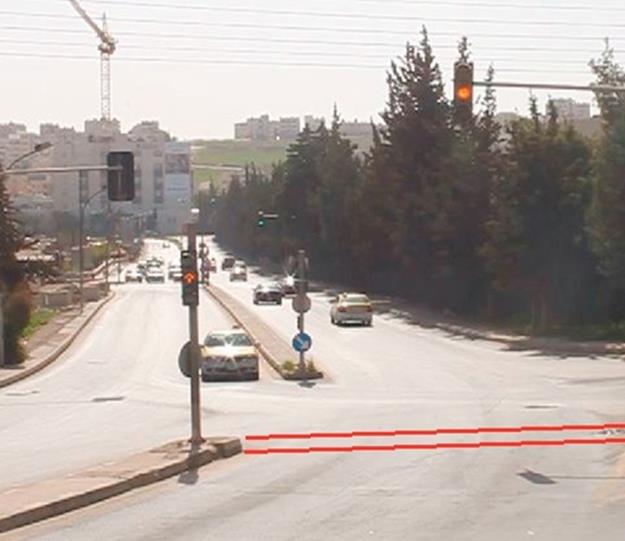
FIGURE 8 Reference of red light violation.
6.2 Speed Violation
This part is to determine if the car has crossed a certain speed limit which was chosen to be 600 pixel/s for normal traffic conditions. Two reference points have been defined c1 = [162 260], c2 = [445 504], r1 = [691 700], and r2 = [567 577] (as shown in Figure 9). This operation reads the video frames and first if there was a crossing found in them, it takes the difference which is the pixel difference between the points. The absolute difference is taken between the reference defined by (c1 and r1) and the read frame. The difference is defined as start frame, and it takes another absolute difference between (c2, r2) and the read frame, where the difference is defined as the final frame.
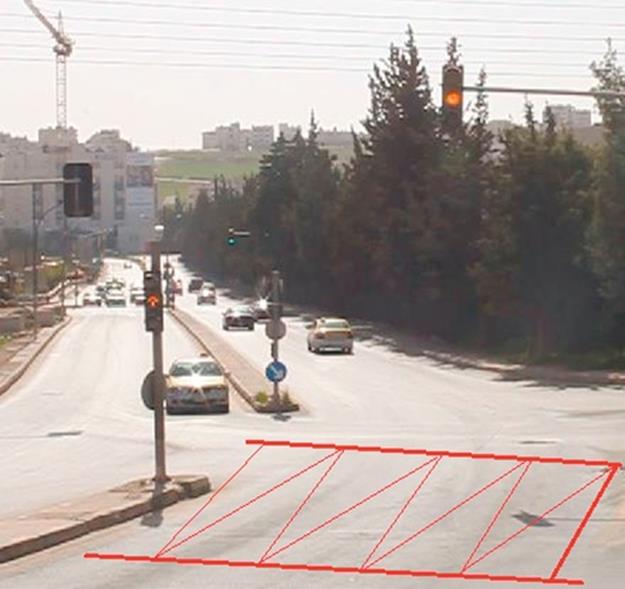
FIGURE 9 Speed violation.
The difference is made by:
![]() (1)
(1)
The time can be known from the following equation where 30 is the frame rate:
![]() (2)
(2)
Then the speed is calculated by the following equation, where 310 is the difference in pixels:
![]() (3)
(3)
6.3 Plate Numbers Recognition
This is done by first determining the plate position, then taking the numbers from the plate and from a look-up table to compare. The numbers are detected by taking the ones that have the maximum correlations. The look-up table is a template that contains the numbers from 0 to 9.
The action of recognition includes many functions to obtain the exact result. The image will be transformed to grayscale. Then the extended-maxima transform is computed. Edge detection and Strel functions are also used. Finally, plate shaping and filter processing are used to obtain the final result.
Plate position determination is made by the following steps:
– Transform the image to grayscale.
– Compute the extended-maxima transform.
– Apply edge-detection-type Sobel.
– Determine the line by Strel function.
– Dilate the image.
– Verify the rectangular plate shape.
Plate number recognition (PNR) consists of three parts:
– PNR: in this M-file, the image is being read and then opens a text document where the result is being displayed at. In this M-file, the plate numbers are being divided each separately in order to the compare. As shown in Figure 10.
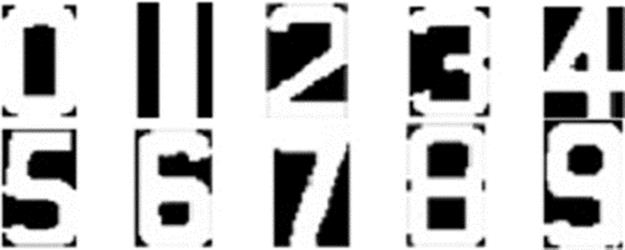
FIGURE 10 Templates for the plate numbers.
– Creatt: in this M-file, the templates have been made.
– Recognize_numb: in this M-file, it computes the correlation between template and input image and takes the maximum correlation. Its output is a string containing the letter.
The correlation is made by this part of the code:
![]() (4)
(4)
where allnumb is from the PNR M-file which is the size templates
![]() (5)
(5)
This comutes the correlation between the templates and the input image
![]() (6)
(6)
After applying this part of the project the result of the plate number will appear in a text document.
The templates that were used in finding the maximum correlation are provided in the subsequent sections.
7 Performance analysis
The project was tested using a video for speed and red violations. For the plate position determination and number recognition, a few images were tested.
7.1 Speed Violation
A video was tested for any speed violation; in the tested video, the car speed was 615 pixel/s which violate the limit, while the other cars in the street had a speed in the range of (500-580)pixel/s.
There is a ratio for transformation from pixel to meter each 1 pixel equals 0.000264583 m, but this is not quit accurate since the zoom ratio affect number and size of the pixel.
7.2 Red Violation
For the same video, the car has violated the red light, and the project code was able to detect it.
7.3 Plate Position Determination
This part from the project has worked efficiently with some errors.
The proposed design was tested at 25 plates; the accuracy percentage was determined by the following:
![]() (7)
(7)
Note: Any addition number appears in the result count as an error, Table 1 shows the results and the percentage of error.
Table 1
Results Summary
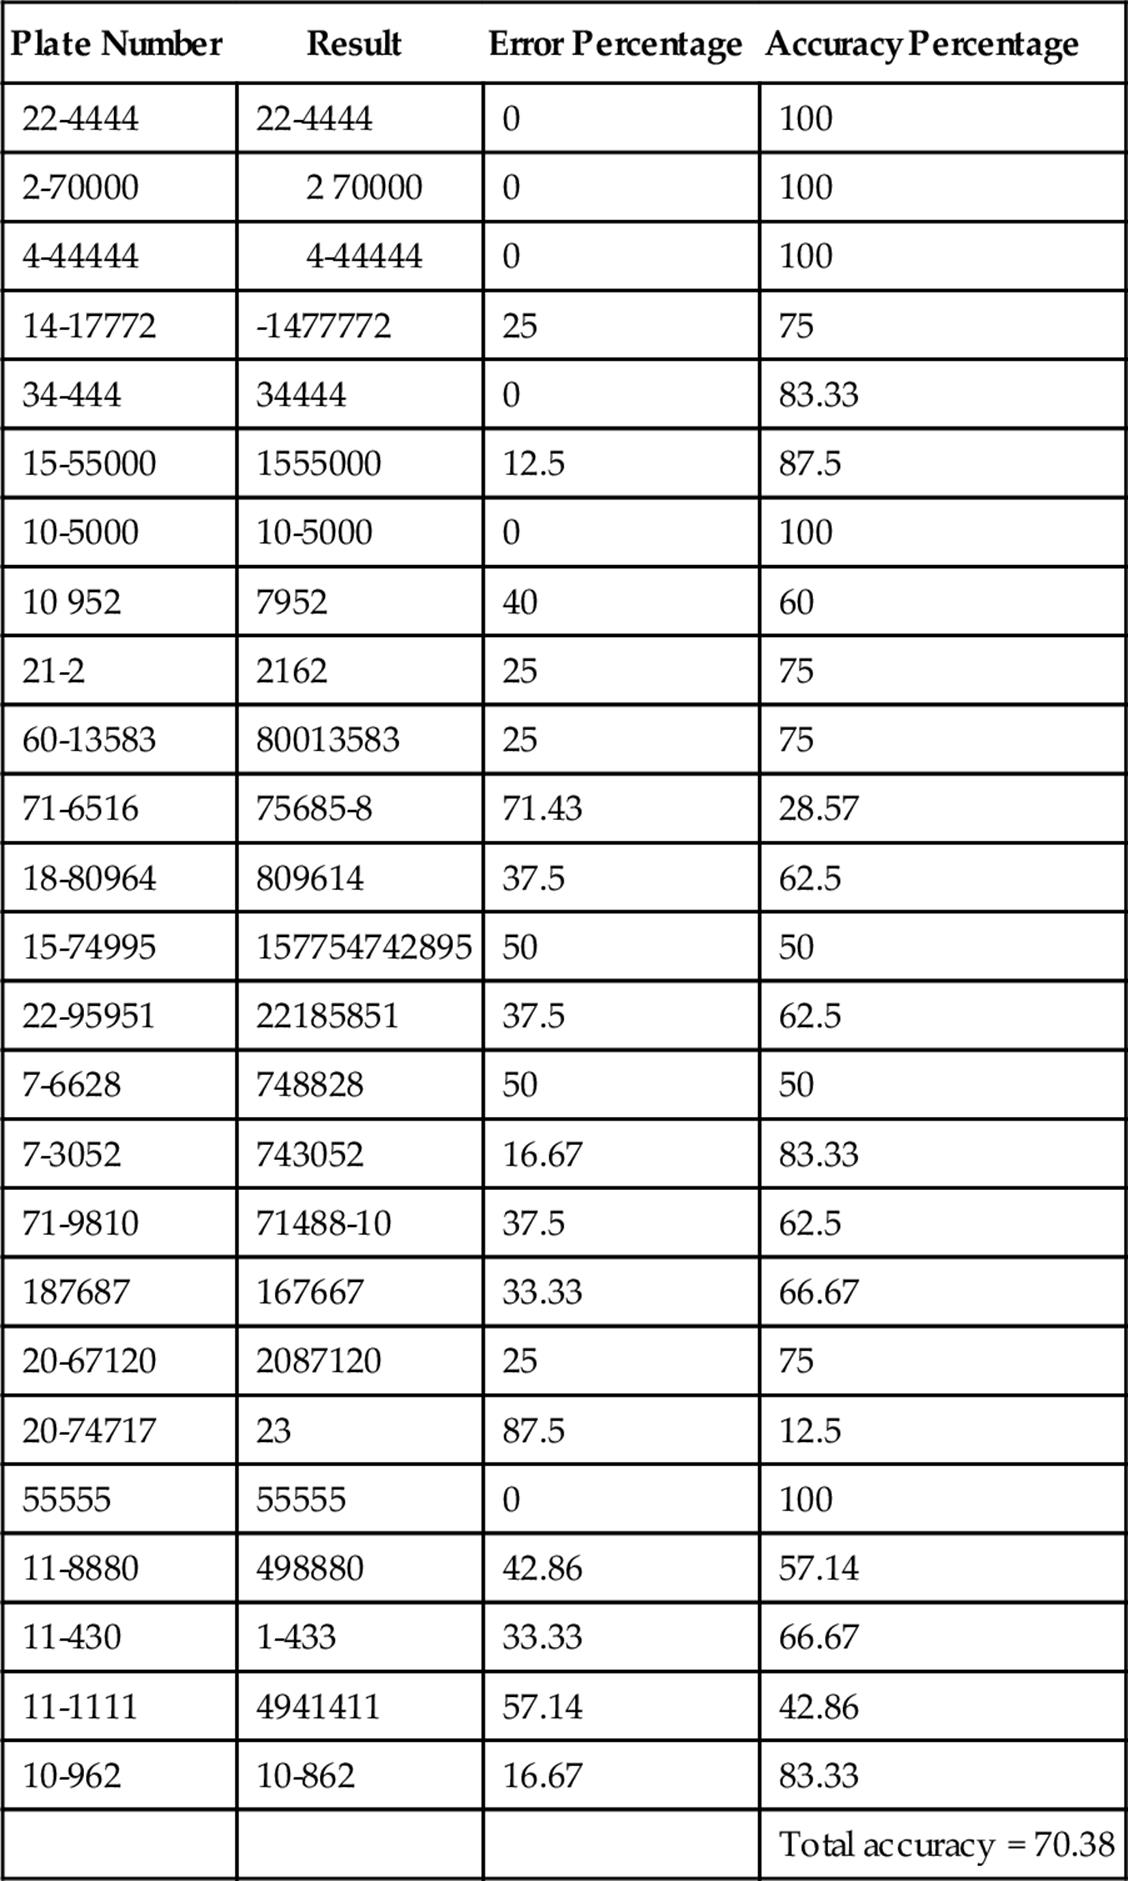
Figure 11 represents the PNR result:
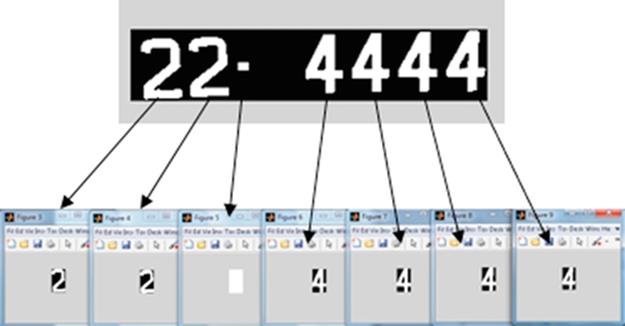
FIGURE 11 PNR.
Figure 12 represents the correlation between the input numbers and the templates, in the illustrated plate. Figure 12 shows the correlation for the first element number (2) and the templates. Figure 12 shows that its maximum correlation was with templates of number (2).
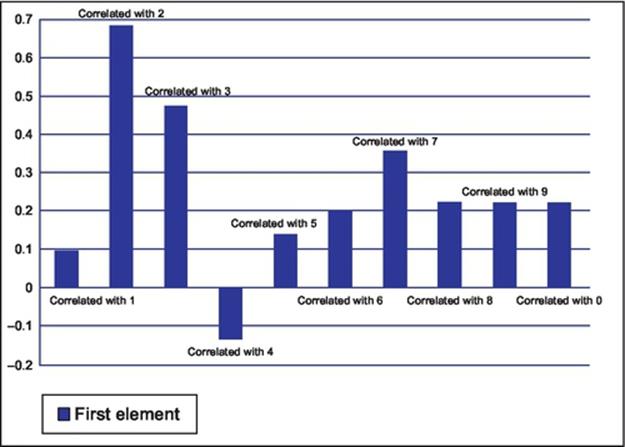
FIGURE 12 Correlation of number (2).
8 General Conclusion
Based on the results and the observation of the performance of the project code, the following conclusions can be drawn:
• MATLAB was a very helpful programe to use; it has all the required toolboxes and demos.
• The results of image processing were very good for the purpose of this project, the operations used to edit the images have done the task successfully.
• The camera specifications played an important role in the accuracy of the code, as it is better, the accuracy will be better.
• This project can make a good drop in the cost comparing to the other systems are being used in the traffic controlling, as it only needs a computer, high-quality camera, and the MATLAB license.
8.1 Problems
The problems faced in this project were mainly the low quality of the camera used since the video contains a moving car, for that the camera lens and zoom must be at a high quality, and it also needs a high processor computer for the MATLAB to work properly.
In the red violation, our tested zone was an intersection of three lanes so the moving cars left no space for us to put our testing points, which implies that we need a higher position of camera to see the empty space needed for testing points.
In the plate recognition what we faced that some of the plates have some nails on them or some stains which make it harder to extract the numbers correctly.
8.2 Future Work
This code was implemented using image processing in MATLAB, It can be implemented by using SCILAB which have the required toolboxes, and it is free to use which can also be used in LINUX and for which reduce the cost even more sine it is an open source, but SCILAB is harder to deal with rather than MATLAB.
The same approach that was used in this project can be used to detect the traffic congestion in a street and therefore control the traffic light signaling depending on the numbers of cars in the street, which can reduce the congestion on the streets.
References
[1] Jamal R, Manna K, Rabee M, Khalaf L. Traffic control by digital imaging cameras. In: IPCV'14, The 2014 World congress in computer science, computer engineering, and applied computing (WORLDCOMP'14), Las Vegas, USA; 2014.
[2] Retting R, Ferguson S, Hakkert A. Effects of red light cameras on violations and crashes—a review of the international literature. Traffic Inj Prev. 2003;4(1):17–23.
[3] Dailey DJ, Li L. ‘Video image processing to create a speed sensor. Research Report, University of Washington; April 2000.
[4] Peter Clack. World-first digital camera to nab red light runners; November 26, 2000.
[5] Ralph Gillman. Office of highway policy information.
[6] http://www.mountain-plains.org/pubs/html/mpc-04-166/pg1.php; May, 2012.
[7] Matlab tutorial fundamental programming. http://in.mathworks.com/help/pdf_doc/matlab/matlab_prog.pdf retrieved; Nov. 18, 2014.
![]() IPCV paper: Traffic Control by Digital Imaging Cameras.
IPCV paper: Traffic Control by Digital Imaging Cameras.
All materials on the site are licensed Creative Commons Attribution-Sharealike 3.0 Unported CC BY-SA 3.0 & GNU Free Documentation License (GFDL)
If you are the copyright holder of any material contained on our site and intend to remove it, please contact our site administrator for approval.
© 2016-2026 All site design rights belong to S.Y.A.