Emerging Trends in Image Processing, Computer Vision, and Pattern Recognition, 1st Edition (2015)
Part II. Computer Vision and Recognition Systems
Chapter 17. Trajectory evaluation and behavioral scoring using JAABA in a noisy system
H. Chen1; P. Marjoram1; B. Foley2; R. Ardekani2 1 Department of Preventive Medicine, Keck School of Medicine, USC, Los Angeles, CA, USA
2 Molecular and Computational Biology, Department of Biological Sciences, USC, Los Angeles, CA, USA
Abstract
Typical methods for generating and analysing tracking data for animals such as Drosophila require idealized experimental conditions that are frequently difficult, expensive, or undesirable to replicate in the lab. In this chapter, we describe and implement methods for improving robustness in nonideal conditions. Our method involves an initial processing step in which tracks are constructed from noisy video data, followed by a subsequent application of machine learning algorithms to further improve performance. We demonstrate that our methods are capable of generating a substantial improvement in performance in fly identification, and allow for effective construction of tracks for individual flies. We then use this data to train sex and behavior classifiers, which we employ to detect and describe behavioral differences among test experiments. As such, our algorithm provides a path for groups who wish to track fly, or characterize their behavior, in less than ideal conditions.
Keywords
Tracking
Machine learning
JAABA
Behavior
Acknowledgments
The authors gratefully acknowledge funding from NSF and NIMH through awards DMS 1101060 and MH100879. The material contained in this chapter reflects the views of the authors, and not necessarily those of NSF or NMH.
1 Introduction
Behavioral studies commonly rely upon extensive time-series observation of animals, and characterization of their movement, activities and social interactions. Historically this involved scientists (or their students) recording observations by hand—a laborious and error-prone process. More recently, automation has promised to dramatically increase the quantity and detail of data collected, and a variety of methods have recently become popular in the important area of automated tracking, for example, the CTRAX ethomics software [1], and the proprietary EthoVision [2].
Most available solutions demand restricted experimental conditions that may not be desirable for the question of interest, or feasible in the field, (or even the lab). For example, in Drosophila melanogaster experiments, it is common to restrict the possibility of flight, and use a backlit glass substrate for contrast [1]. A majority of D. melanogaster social interactions occur on food, and glass is not representative of their normal habitat. Additionally, many tracking algorithms perform poorly when the number of objects being tracked is not fixed. In such contexts, it is difficult to determine whether a large “blob” of pixels in fact represents a single object or two overlapping objects. Such close contact happens commonly during aggression, courtship and mating events.
We are particularly interested in describing spontaneous group assembly, and describing the resultant behavior in those groups. That is, we need to analyze setups with variable numbers of flies that frequently come into close contact. As a test-case, we consider data from a set of experiments in which we recorded fly behavior in an environment consisting of four food patches, modeled on a published experiment conducted with still cameras [3]. Each patch was recorded independently, and flies could freely move among patches, or be off patch (and thus not recorded). To model group assembly, we need to accurately count individuals on patches, and measure joining and leaving. We are currently able to detect objects (blobs or putative flies) in video frames against a static background. This method is designed to be relatively robust to nonoptimal experimental conditions.
Behavioral annotation requires that we move from static blobs, to individual-fly identification and tracking. Here, we build upon our work presented in [4], and describe a three-stage process from video processing to behavioral annotation. First, we present an algorithm that enables us to assemble trajectories even through multifly blobs. Second, we then utilize these trajectories in freely available machine-learning behavioral annotation software. The Janelia Automatic Animal Behavior Annotator (JAABA) is a commonly used animal-behavior annotation software [5]. We use JAABA to manually flag errors in our tracking algorithm for “single fly” versus “multifly” blobs. This enables subsequent trajectory correction and behavioral annotation. Finally, from the subset of trajectories consisting of high-likelihood single-fly blobs, we train a sex classifier to distinguish males from females. We also train a chasing classifier, which together with sex annotation allows us to score important social behaviors, namely courtship and aggression.
2 Methods
Videos are recorded using four high-resolution Grasshopper digital video cameras (Point Grey Research Inc., Richmond, Canada) simultaneously filming individual patches at 30 Hz, RGB, and 800 × 600 resolution. Videos are processed as single frames, by identifying blobs against an averaged background [6]. Blobs may contain from one to many individual flies, or be spurious artifacts. Features of the blobs are extracted using the cvBlobslib package [7]. The borders of the patch are defined manually, using the ImageJ software ellipse tool [8], and are calculated as length of the radius from centroid of the patch. All flies outside this radius are considered “off patch.” Lighting was ambient room lighting. Videos were recorded for 1 h intervals, and a subset were scored for joining and leaving by hand, to evaluate accuracy.
To facilitate tracking and individual-fly (sex and genotype) identification, we painted a small color-coded dot on each fly (either blue or yellow). For color detection problems there are drawbacks to the RGB color space. First, there is a high correlation between red, green, and blue channels; moreover, they are not robust to lighting conditions. In many situations, one needs to be able to separate the color components from intensity [9–11]. There are many linear and nonlinear color spaces that achieve better color constancy, effective bandwidth reduction, and robust color image processing [12]. In particular, HSV has been shown to have better performance than RGB space for color recognition [9]. For color recognition on silhouettes, RGB values of each pixel were converted to HSV using the equations of [12]. We selected thresholds in 3D HSV space, which were most effective for distinguishing blob colors. Each pixel within the fly silhouette was assigned to a color based on h, s, and v, and values, and pixels which were not within these thresholds were disregarded. The paint color was inferred by the majority of pixels.
Blobs are identified for each frame, or time T. The number of blobs, and blob statistics for each T, were output. Blob statistics include the blob X and Y centroids (BX and BY); fitted-ellipse major and minor axes (BA, BB); and blob area (in pixels, BP). Blobs with centroids outside the perimeter of the patch are excluded. Every blob is assigned a unique identifier within a frame (Bi). Each blob is subsequently assigned an inferred fly number (Bn, below).
Flies are taken to be nonfissible blob units. We infer the number and identity of flies within blobs by tracking fusion and fission events. We construct tracks by making three simplifying assumptions (based on observation). First, that flies do not often move a greater distance than their body length between frames. Second, that the noise in blob area estimation is not large between consecutive frames (i.e., less than half the actual fly area). Third, (on the scale of 30 frames a second) that flies do not join and leave patches often, that is, we conservatively assume fly number does not change, unless there is no other explanation for the data. TABU is implemented in R [13].
Trajectories are constructed by initializing the first frame assuming each blob is a single fly. Subsequently, we implement the following algorithm at each frame:
1. Identify Neighborhoods: For each pair of frames Tt and Tt + 1, we construct a graph by drawing edges between blobs that (a) are in different frames and (b) overlap. We define overlapping as having centroids within the distance of the major axis BA of the blob ellipse. We define two degrees of overlapping: mutual and unidirectional. A mutual overlap occurs when the BA of both blobs is longer than the distance between their centroids. If only one BA is this long, the overlap is unidirectional. A “neighborhood” is defined as group of blobs linked by mutual edges.
2. Check “Joins” and “Leaves”: We test for probable joining and leaving events by examining blobs that are not in a neighborhood with other blobs, using the more-relaxed unidirectional overlap. Flies in blobs in Tt with no unidirectional matches in Tt + 1 are assumed to have left, and flies in blobs in Tt + 1 with no unidirectional matches in Tt are assumed to have joined. Otherwise, the unmatched blobs are assigned to their nearest unidirectional match.
3. Assign flies to blobs: In the simplest case, a neighborhood is comprised of a single blob in Tt and Tt + 1. If so, all flies in the blob at Tt are assigned to the blob at Tt + 1. In more complex cases, we assign flies between blobs to minimize the difference between summed fly-area and their respective BP. Every fly inherits the blob-specific statistics of its assigned blob. During fission events if there are fewer flies than blobs we update fly numbers. Thus, we arrive at our count of flies. Each blob is also assigned a count of the number of flies it contains, BN.
4. Update statistics: Each fly is assigned a number of fly-specific statistics. These include a unique index for each fly (Fj); fly area in pixels (FP); and fly area from the fitted ellipse (Fe = BABBπ). Statistics are running averages, updated only when a fly is inferred to be in a single-fly blob. An error parameter is also updated (FS) to alert us when there is a mismatch between observed blob properties and the inferred fly state, for instance, if the ratio between FP and Fe is much smaller than 0.9, there is a high likelihood the blob contains multiple flies.
5. Resolve probable errors: For cases where error deviance FS has grown too large, we attempt to reduce mismatch between imputed fly and blob matches by imputing leaving events, or evaluating group assignment.
We have found that this method gives us correct fly counts in blobs > 85% of the time, but is subject to several systematic biases (see Section 3). For example, it deals poorly with occlusion due to mounting which may last for seconds, and mating, which lasts for up to 20 min. It also may incorrectly infer several small flies instead of a single large fly. We therefore attempt a subsequent analysis aimed at correcting these remaining biases using machine learning (ML).
2.1 ML in JAABA and Trajectory Scoring
Once TABU has been applied, the trajectories become compatible with JAABA, allowing us to conveniently score behavior using its video annotation capabilities. We then fit various ML algorithms. The first, GentleBoost, is natively implemented within JAABA. The others (GradientBoost, logistic regression, and Support Vector Machine [SVM] with linear and Gaussian kernels [gSVM and lSVM]) we implemented ourselves using the Python Scikit-learn [14] package. For boosting, we use decision stumps as the weak rules, and to ensure fair comparison default parameter values were used for all other methods.
Training of ML Algorithms: We used JAABA to calculate a number of internal single-frame fly statistics, as well as multiframe window features. Window features are normalized to have mean 0 and variance 1. It is these features that were used for the ML classifiers. Users define behaviors, and score positive and negative cases for trajectories in the JAABA Graphical User Interface (GUI), by observation in the video window. Since the ML algorithms are binary classifiers, we scored instances of behavior as a binary outcome: Multifly = 1 for blobs labeled as having more than one fly, Multifly = 0 otherwise; Sex = 0 for female (or 1 for male); and Chase = 1 (or 0 for other behaviors).
We then fit ML classifiers using threefold cross-validation analysis in which the training data uses the manual annotations that we input using JAABA. After fitting, the performance of each model was evaluated using accuracy, specificity, sensitivity, precision, and area under the curve. Here, accuracy is defined as the proportion of times that the fly state is correctly called, for a total number of validation calls. All other performance measures follow the usual statistical definitions. Sex and Multifly classifiers were trained on 4000 frames from a single training video, and evaluated on 400 randomly picked frames. The Chase classifier was trained on 2000 frames, and evaluated on 500. At the same time, using the Multifly classifier, we evaluated the performance of the TABU input trajectories by scoring whether our BN statistic accurately described blob fly count.
Sex classification was performed after trajectory scoring, and incorporated both an ML classifier (as above) and color information. Because the color scoring was more accurate than the Sex classifier, integration was performed by applying the Sex classifier to frames where the color of the painted marker is uncertain.
In order to understand the biological significance of the Chase classifier, we need to understand the sex of the individuals involved in the behavior. Courtship and aggression are known to be important components of fly social behavior [3]. These are usually male initiated, often characterised by chasing, and are directed at females and males respectively. Females rarely if ever chase other flies. Taking Chase together with Sex and Multifly, we created two composite behaviors: Aggression and Courtship. In the case where Multifly = 0, Sex = 1, and Chase = 1, Aggression was defined as a male chasing another male, and Courtship was defined as a male chasing a female. To compare our test videos, we created a composite behavior profile for each. That profile comprised of the percentage of frames that (a) contained Multifly blobs; (b) contained at least one female; (c) contained Aggression; and (d) contained Courtship.
3 Results
We begin by evaluating the performance of the basic blob-recognition algorithm from Ardekani et al. [6], and the change in accuracy after processing the data with TABU, for the basic task of recognizing fly number and for joining and leaving events. The empirical “real” results are obtained from manual annotation. Results are shown in Table 1. Let e be the estimated number of flies in a frame for a given method, n be the actual (manually annotated) number, and τ be the total number of frames. We estimate overall counting error, E, as ![]() (where the denominator is n + 1 to avoid division by zero). This represents an approximate per-fly probability of being miscounted. Directionality, D, is calculated similarly,
(where the denominator is n + 1 to avoid division by zero). This represents an approximate per-fly probability of being miscounted. Directionality, D, is calculated similarly, ![]() , and demonstrates the chances of being consistently over- or under-counted. Joining or leaving events, “Jump,” are reported as the per-frame probability of either a change in blob number, or a trajectory starting or ending. Results are shown for five separate videos (Rep).
, and demonstrates the chances of being consistently over- or under-counted. Joining or leaving events, “Jump,” are reported as the per-frame probability of either a change in blob number, or a trajectory starting or ending. Results are shown for five separate videos (Rep).
Table 1
Performance of the Blob Algorithm Output (Blob), and TABU Trajectory Output
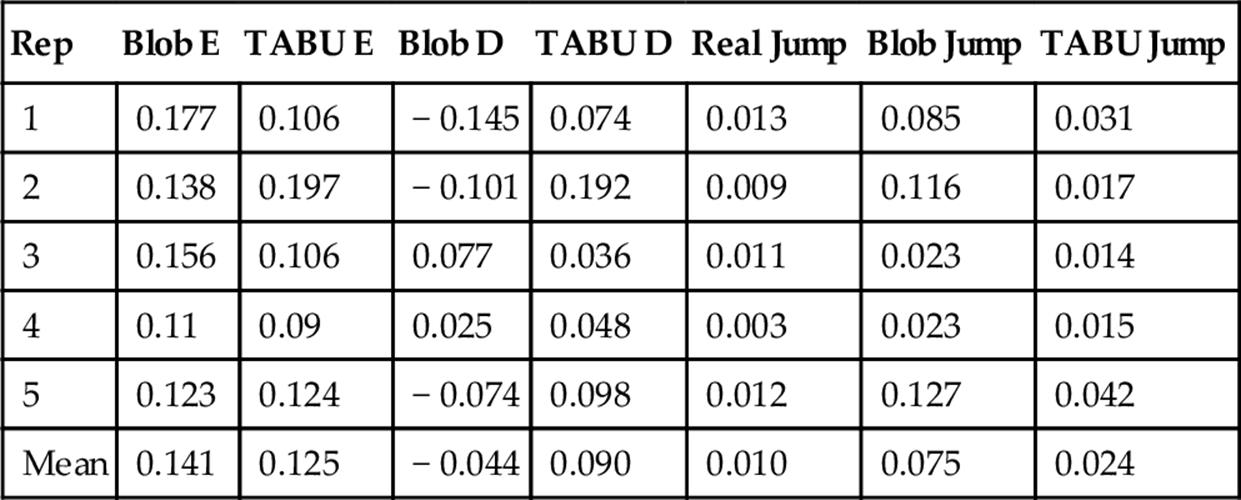
Counting error (E), and directionality (D) bias in counting is shown. Empirical (Real) and estimated fly patch-joining or leaving rates (Jump) are also shown for raw blob data and processed trajectories.
By using TABU to create our trajectories, we have obtained more accurate data than was provided by the raw blob counts (Table 1). We have also greatly reduced the correlation between bias and fly number in our estimates (Figure 1). While the raw output overestimates the number of flies on a patch at low fly numbers, it tends to underestimate fly numbers when there are more flies on a patch (Blob bias: est = − 0.034, df = 442,173, t = − 309.1, P < 0.001). However, TABU does show evidence of a consistent bias towards over-counting, which becomes slightly stronger at high numbers of flies (Tabu bias: est = 0.0075375, df = 495,300, t = 71.67, P < 0.001). Application of the Tabu algorithm reduces the number of spurious patch joining and leaving events to about 30% over the raw blob data (Table 1). However, even for the TABU output, the number of inferred joining and leaving events is still more than 2 × the actual data, offering potential for improvement through subsequent application of ML.
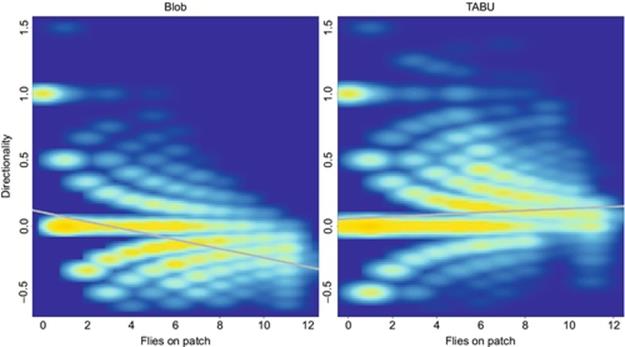
FIGURE 1 Heat map of the distribution of per-fly over- and under-counts (D) as function of the number of flies on a patch for each frame across five test videos.
We now investigate whether application of ML methods to our TABU trajectories can identify miscalled blob counts BN. Threefold cross-validation model-fit results are shown in Table 2. Here algorithms were trained using a period of 10 K frames. We see that all models have an accuracy above 0.98. The two SVM models rank highly on almost all metrics, while logistic regression ranks poorly on most metrics. While JAABA is not top ranked on any metric, we note that it performs very well overall.
Table 2
Performance Measures of ML Algorithms for Multifly Calling on Threefold Cross Validation
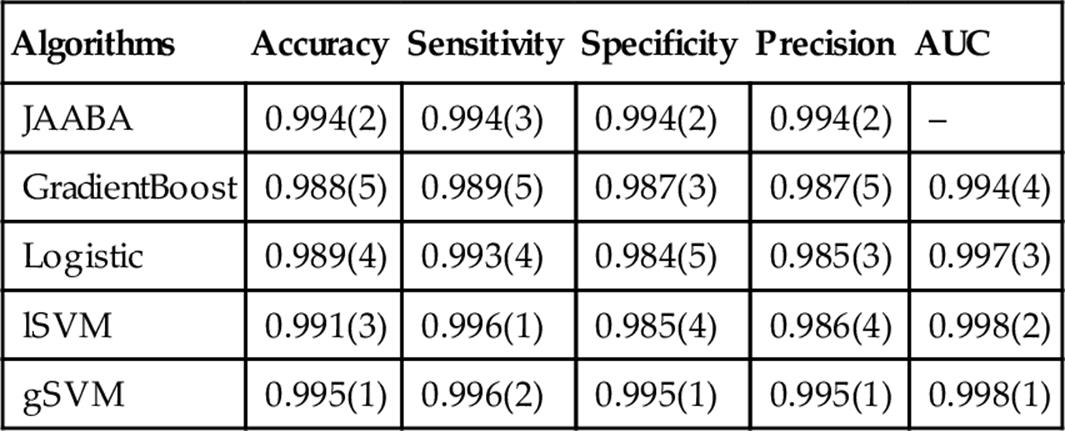
The accuracy, sensitivity, specificity, and area under the curve scores are shown for each. Ranks among ML methods for each performance score are given in brackets.
The critical practical question is whether models trained on one part of a video will be equally effective when applied to later periods of the same video, or to completely new video. Fly behavior is known to change over time, and varies among different genotypes and in different social contexts. We tested the performance of all algorithms on four videos that were not used in the training of the algorithm. This included different genotypes and sex ratios, as well as slightly different lighting and focus, than the algorithms were trained on. Results are shown in Table 3. The performance of all ML methods dropped slightly under these new conditions. All the ML methods improved upon the trajectory input data from TABU. The performance ranking of the ML algorithms remained broadly the same in this new data. The gSVM did very well, and logistic regression did relatively poorly. Again JAABA (GentleBoost) did very well overall.
Table 3
Evaluation of the ML Algorithm Performance for Multifly Calling on Nontraining Videos
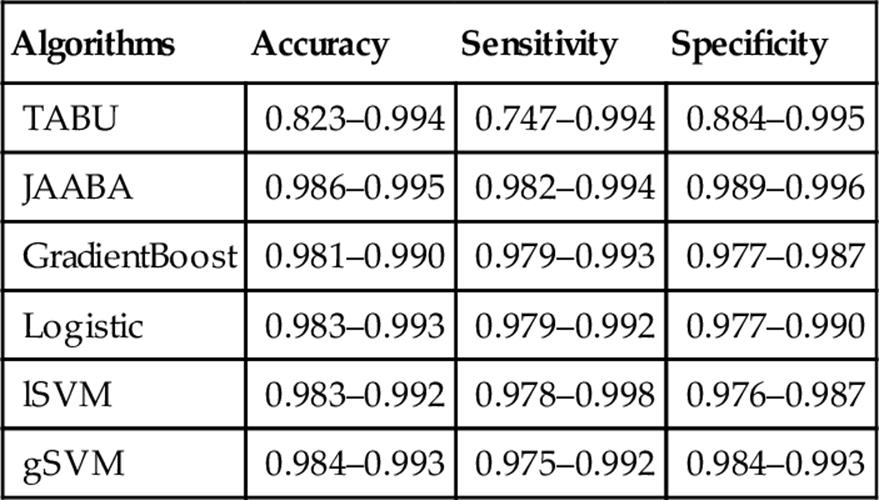
The minimum to maximum range of accuracy, sensitivity, and specificity scores are shown for each, in comparison with the input trajectory data (TABU).
Sex Annotation: We found that the various ML algorithms had accuracies in Sex calling ranging between 0.73 and 0.89 (Table 4). Logistic regression, GradientBoost and JAABA all had similar accuracies, above 0.88. The video blob-processing annotation based on the colored marker, however, was the most accurate of all the Sex classifiers (with an accuracy of 0.93). Integrating this classifier together with the JAABA scores improved the performance statistics for Sex calling to 0.95 and above.
Table 4
Performance Measures of the Sex Classifier on Threefold Cross Validation
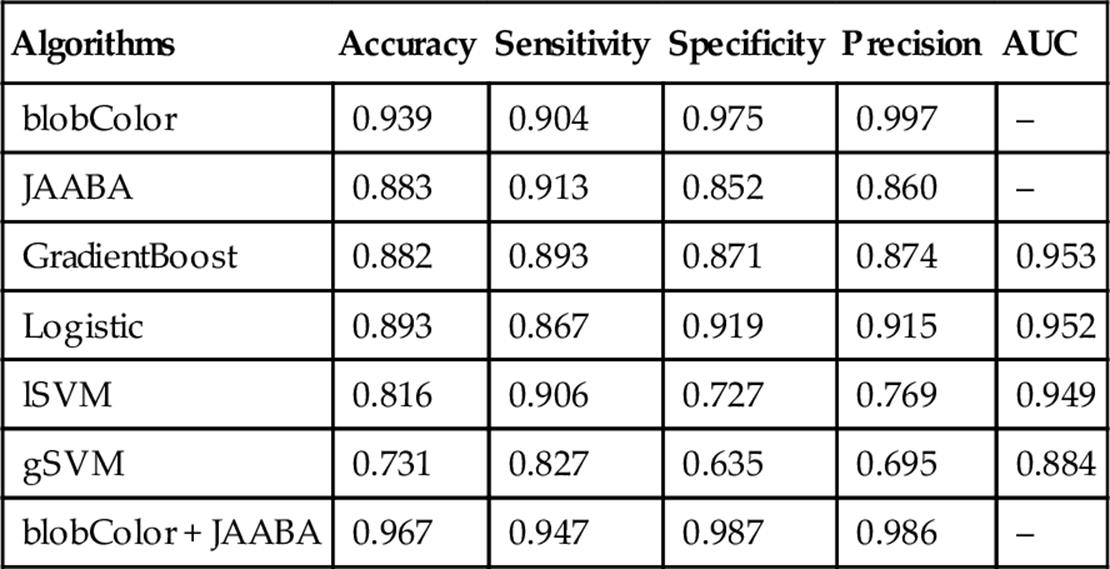
The accuracy, sensitivity, specificity, precision, and area under the curve scores are shown for each.
On the nontraining data, the performance of the Sex classifier for JAABA was very similar to that on the trained video (with an accuracy above 0.90), suggesting that this classification is very robust (Table 5). Indeed, all ML methods however (particularly lSVM) performed somewhat better when applied to the nontraining data, perhaps suggesting that the training dataset was a particularly difficult dataset for which to call sex.
Table 5
Evaluation of the Sex Classifier Performance on Nontraining Videos
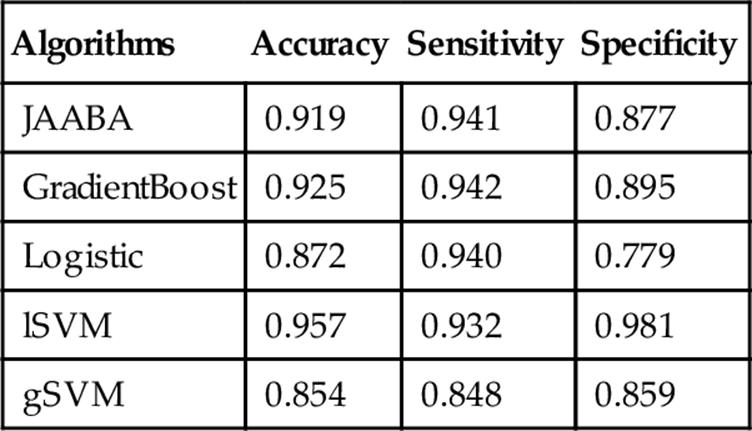
The mean accuracy, sensitivity, and specificity scores across the videos are shown.
Behavior Annotation: The ultimate goal of trajectory analysis, and the implementation of JAABA on tracking data, is to evaluate behaviors in a diversity of experimental manipulations. In scoring Chasing, JAABA, GradientBoost, and logistic regression all performed well, with accuracy above 0.85 (Table 6). Even on the nontraining dataset, all the methods besides the Gaussian SVM had accuracy greater than 0.8, but logistic regression and the linear SVM performed best (Table 7).
Table 6
Evaluation of the Chase Classifier Performance on Threefold Cross Validation
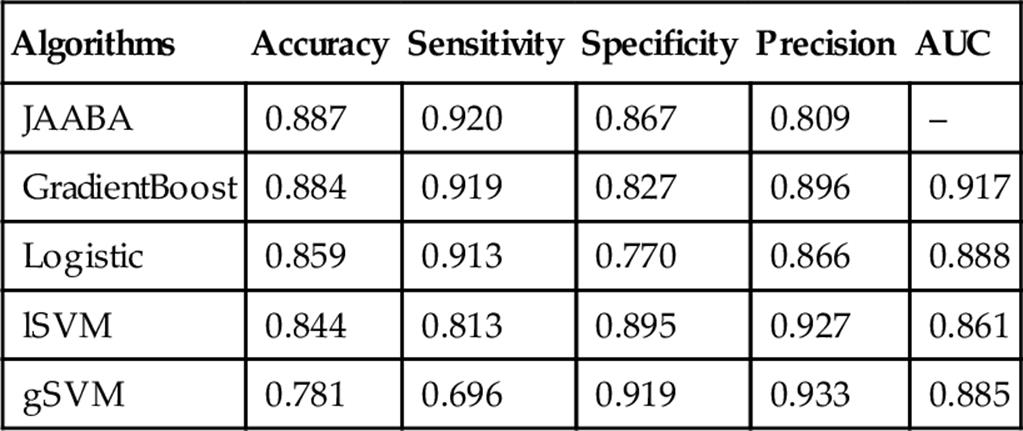
The accuracy, sensitivity, specificity, precision, and area under the curve scores are shown for each.
Table 7
Evaluation of the Chase Classifier Performance on Nontraining Videos
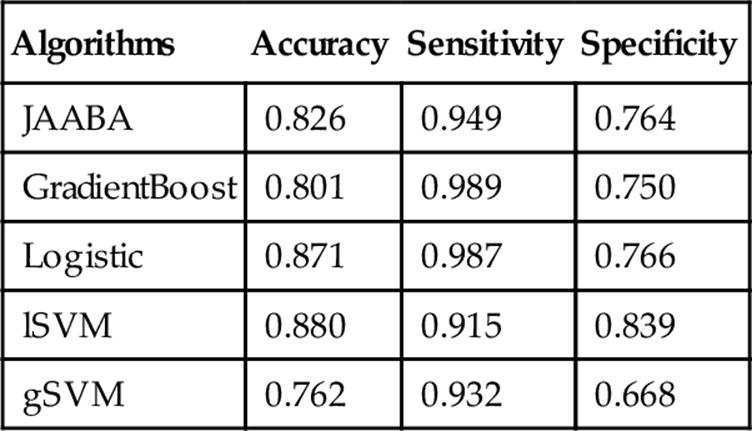
The accuracy, sensitivity, and specificity scores are shown for each.
Intriguingly, we found gross differences in fly behavior between the videos, which generally reflected the sex ratio composition of their respective experiments. It is precisely differences such as these that we hope we will be able to detect using methods such those we have developed here, so this is an encouraging result. A higher proportion of females results in a greater likelihood of observing females on patch, as well as an increased prevalence of Multifly blobs (Table 8). There was a trend towards more frequent aggression with an increase in male numbers, while courtship was observed more frequently at intermediate sex ratios. These results are entirely consistent with what we understand about fly behavior, which again provides encouragement regarding the usefulness of automated annotation of fly behavior such as that we present here.
Table 8
Behavioral Profiles of the Five Fly Videos (v1–v5), with the Number of Females:Males in the Experiment (but not Necessarily in Frame) Shown in Brackets
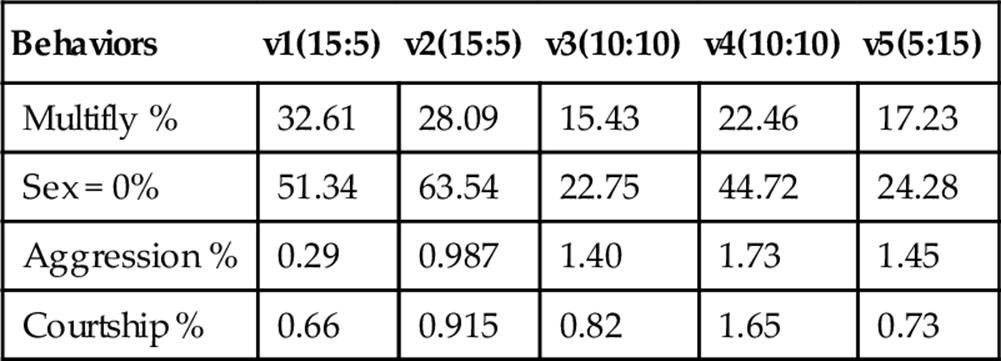
The percentage of frames containing at least one of these behaviors is shown. Behavioral annotations were obtained using JAABA.
4 Discussion
In this paper we have developed a method for generating, and error correcting, tracking data from video recordings of Drosophila made in nonideal conditions. Nonoptimal conditions cause problems at the initial image processing stage, due to poor performance of background subtraction routines, occlusion caused by proximity between animals, and uncertainty in the number of objects that need to be tracked (c.f. [1]). This leads to subsequent poor performance of tracking data. However, imperfect conditions will apply for a majority of behavioral observation systems in nature. Even in many lab situations, experimenters often have to work with such conditions to collect relevant data. Our methods offer the potential for investigators to more successfully work with such data.
Our simple TABU tracking algorithm, by making a few realistic assumptions about the persistence of flies across frames and within blobs, greatly reduces the uncertainty of the initial image processing data from the algorithm of Ardekani et al. [6]. It allows us to count flies on patches with more certainty, and reduces the apparent degree of fly movement on and off of patches. Error rates are still nonzero, but it is clear that subsequent application of any of the ML methods we tested here has the potential to increase correct allocation of flies among blobs from around 90% to over 98%.
Among the algorithms we evaluated, there is no clear winner among the ML methods in terms of performance. However, for ease of implementation, and robustly high performance, the GentleBoost algorithm natively implemented in JAABA represents a reasonable choice for future work. It performed well for the Multifly classifier, and consistently well for Sex and Chase. We emphasize that use of JAABA (and all the behavioral annotation algorithms we tested) requires fly tracking data as input, thereby necessitating pre-processing using an algorithm such as TABU before use. Such a pre-processing algorithm needs to be able to construct tracks successfully in nonideal conditions, and when the number of objects being tracked is unknown, a problem that is known to be extremely challenging [1].
In the test videos, we were able to integrate multiple classifiers, such as painted marker color and Sex to improve our ability to score accurately. We were also able to integrate Sex and Chase in order to obtain richer biological data than was available from individual classifiers. We recapitulated the experimental sex ratio conditions (i.e., higher rates of observation of female prevalence correspond with higher female sex ratios) in the untrained videos. Importantly, we detected interesting patterns in behavioral differences among the trials related to sex ratio—there were trends in the frequency of male-male Aggression, but not, interestingly, Courtship. It might be that as males spend more time fighting, they have less time or opportunity to court. The ability to detect such meaningful behavioral trends, in naturalistic setups, will be of great interest to ethologists.
In sum, our methods produce improved performance both in terms of accurate identification of the number of flies in a blob (and, therefore, the number of flies in a frame at any given moment), and in terms of generation of tracks for individual flies. Both of these types of information are crucial for analysis of fly (and other animal) group behavior. Flies are social animals that actively aggregate and interact in groups. The sizes of these groups is therefore a key diagnostic of the behavior of those flies, and varies with factors such as genotype, sex ratio, etc. Therefore, the methods we present here provide the opportunity for researchers to use automated methods to generate large quantities of such data in an experimental context. A more difficult remaining challenge is to automatically recognize interactions between flies, such as courtship and acts of aggression. Methods (including JAABA) are being developed to attack this problem. Creating, and error correcting, fly trajectories is a necessary first step in taking advantage of this work.
References
[1] Branson K, Robie AA, Bender J, Perona P, Dickinson MH. High-throughput ethomics in large groups of Drosophila. Nat Methods. 2009;6:451–457.
[2] Noldus L, Spink A, Tegelenbosch R. EthoVision: a versatile video tracking system for automation of behavioral experiments. Behav Res Methods Instrum Comput. 2001;33:398–414.
[3] Saltz J, Foley BR. Natural genetic variation in social niche construction: social effects of aggression drive disruptive sexual selection in Drosophila melanogaster. Am Nat. 2011;177:645–654.
[4] Chen H, Foley B, Marjoram P. Trajectory scoring using JAABA in a noisy system. In: Worldcomp iPCV; 2014.
[5] Kabra M, Robie A, Rivera-Alba M, Branson S, Branson K. JAABA: interactive machine learning for automatic annotation of animal behavior. Nat Methods. 2013;10:64–U87.
[6] Ardekani R, Biyani A, Dalton JE, Saltz JB, Arbeitman MN, Tower J, et al. Three-dimensional tracking and behaviour monitoring of multiple fruit flies. J R Soc Interface. 2013;10(78):20120547.
[7] Bradski, G., 2000. The openCV library. Dr. Dobb’s Journal of Software Tools.
[8] Abramoff M, Magalhaes P, Ram S. Image Processing with ImageJ. Biophoton Int. 2004;11:36–42.
[9] Park S, Kim K. Color recognition with compact color features. Int J Commun Syst. 2012;25(6):749–762.
[10] Saber E, Tekalp A, Eschbach R, Knox K. Automatic image annotation using adaptive color classification. Graph Model Image Process. 1996;58:115–126.
[11] Sural S, Qian G, Pramanik S. Segmentation and histogram generation using the hSV color space for image retrieval. In: International conference on image processing (iCIP); 2002.
[12] Wyszechi G, Stiles W. Color science: concepts and methods. 2nd ed. New York, USA: Wiley; 1982.
[13] R Development Core Team. R: a language and environment for statistical computing. Vienna, Austria: R Foundation for Statistical Computing; 2006.
[14] Pedregosa F, Varoquaux G, Gramfort A, Michel V, Thirion B, Grisel O, et al. Scikit-learn: machine learning in Python. J Mach Learn Res. 2011;12:2825–2830.
All materials on the site are licensed Creative Commons Attribution-Sharealike 3.0 Unported CC BY-SA 3.0 & GNU Free Documentation License (GFDL)
If you are the copyright holder of any material contained on our site and intend to remove it, please contact our site administrator for approval.
© 2016-2026 All site design rights belong to S.Y.A.