Emerging Trends in Image Processing, Computer Vision, and Pattern Recognition, 1st Edition (2015)
Part II. Computer Vision and Recognition Systems
Chapter 18. An algorithm for mobile vision-based localization of skewed nutrition labels that maximizes specificity
Vladimir Kulyukin1; Christopher Blay2 1 Department of Computer Science, Utah State University, Logan, UT, USA
2 YouTube Corporation, San Bruno, CA, USA
Abstract
An algorithm is presented for mobile vision-based localization of skewed nutrition labels (NLs) on grocery packages that maximizes specificity, i.e., the percentage of true negative matches out of all possible negative matches. The algorithm works on frames captured from the smartphone camera’s video stream and localizes NLs skewed up to 35-40° in either direction from the vertical axis of the captured frame. The algorithm uses three image processing methods: edge detection, line detection, and corner detection. The algorithm targets medium- to high-end mobile devices with single or quad-core ARM systems. Since cameras on these devices capture several frames per second, the algorithm is designed to minimize false positives rather than maximize true ones, because, at such frequent frame capture rates, it is far more important for the overall performance to minimize the processing time per frame. The algorithm is implemented on the Google Nexus 7 Android 4.3 smartphone. Evaluation was done on 378 frames, of which 266 contained NLs and 112 did not. The algorithm’s performance, current limitations, and possible improvements are analyzed and discussed.
Keywords
Computer vision
Nutrition label localization
Mobile computing
Text spotting
Nutrition management
1 Introduction
Many nutritionists and dieticians consider proactive nutrition management to be a key factor in reducing and controlling cancer, diabetes, and other illnesses related to or caused by mismanaged or inadequate diets. According to the U.S. Department of Agriculture, U.S. residents have increased their caloric intake by 523 calories per day since 1970. Mismanaged diets are estimated to account for 30-35% of cancer cases [1]. A leading cause of mortality in men is prostate cancer. A leading cause of mortality in women is breast cancer. Approximately 47,000,000 U.S. residents have metabolic syndrome and diabetes. Diabetes in children appears to be closely related to increasing obesity levels. The current prevalence of diabetes in the world is estimated to be at 2.8% [2]. It is expected that by 2030 the diabetes prevalence number will reach 4.4%. Some long-term complications of diabetes are blindness, kidney failure, and amputations. Nutrition labels (NLs) remain the main source of nutritional information on product packages [3,4]. Therefore, enabling customers to use computer vision on their smartphones will likely result in a greater consumer awareness of the caloric and nutritional content of purchased grocery products.
In our previous research, we developed a vision-based localization algorithm for horizontally or vertically aligned NLs on smartphones [5]. The new algorithm, presented in this chapter, improves our previous algorithm in that it handles not only aligned NLs but also those that are skewed up to 35-40° from the vertical axis of the captured frame. Figure 1 shows an example of such a skewed NL with the vertical axis of the captured frame denoted by a white line. Another improvement designed and implemented in the new algorithm is the rapid detection of the presence of an NL in each frame, which improves the run time, because the new algorithm fails fast and proceeds to the next frame from the video stream.
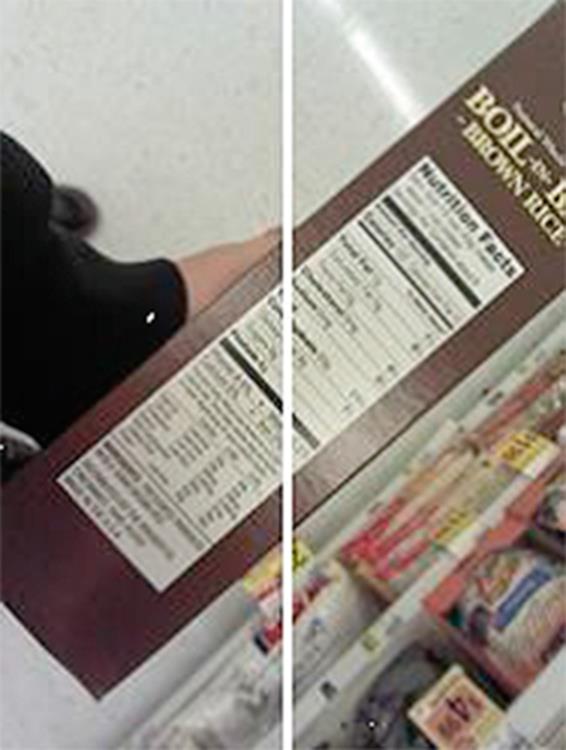
FIGURE 1 Skewed NL with vertical axis shown.
The new algorithm targets medium- to high-end mobile devices with single or quad-core ARM systems. Since cameras on these devices capture several frames per second, the algorithm is designed to minimize false positives rather than maximize true ones, because, at such frequent frame capture rates, it is far more important to minimize the processing time per frame.
Our chapter is organized as follows. In Section 2, we present our previous work on accessible shopping and nutrition management to give the reader a broader context of the research and development presented in this chapter. In Section 3, we outline the details of our algorithm. In Section 4, we present the experiments with our algorithm and discuss our results. In Section 5, we present our conclusions and outline several directions for future work.
2 Previous work
In 2006, our laboratory began to work on ShopTalk, a wearable system for independent blind supermarket shopping [6]. In 2008-2009, ShopTalk was ported to the Nokia E70 smartphone connected to a Bluetooth barcode pencil scanner [7]. In 2010, we began our work on computer vision techniques for eyes-free barcode scanning [8]. In 2013, we published several algorithms for localizing skewed barcodes as well as horizontally or vertically aligned NLs [5,9]. The algorithm presented in this chapter improves the previous NL localization algorithm by relaxing the NL alignment constraint for up to 35-40° in either direction from the vertical orientation axis of the captured frame.
Modern nutrition management system designers and developers assume that users understand how to collect nutritional data and can be triggered into data collection with digital prompts (e.g., email or SMS). Such systems often under-perform, because many users find it difficult to integrate nutrition data collection into their daily activities due to lack of time, motivation, or training. Eventually, they turn off or ignore digital stimuli [10].
To overcome these challenges, in 2012 we began to develop a Persuasive NUTrition Management System (PNUTS) [5]. PNUTS seeks to shift current research and clinical practices in nutrition management toward persuasion, automated nutritional information extraction and processing, and context-sensitive nutrition decision support. PNUTS is based on a nutrition management approach inspired by the Fogg Behavior Model [10], which states that motivation alone is insufficient to stimulate target behaviors. Even a motivated user must have both the ability to execute a behavior and a trigger to engage in that behavior at an appropriate place or time.
Another frequent assumption, which is not always accurate, is that consumers and patients are either more skilled than they actually are or that they can be quickly trained to obtain the required skills. Since training is difficult and time consuming, a more promising path is to make target behaviors easier and more intuitive to execute for the average smartphone user. Vision-based extraction of nutritional information from NLs on product packages is a fundamental step in making proactive nutrition management easier and more intuitive, because it improves the user’s ability to engage into the target behavior of collecting and processing nutritional data.
3 Skewed NL localization
3.1 Detection of Edges, Lines, and Corners
Our NL detection algorithm uses three image processing methods: edge detection, line detection, and corner detection. Edge detection transforms images into bitmaps where every pixel is classified as belonging or not belonging to an edge. The algorithm uses the Canny edge detector (CED) [11]. After the edges are detected (see Figure 2), the image is processed with the hough transform (HT) [12] to detect lines (see Figure 3). The HT algorithm finds paths in images that follow generalized polynomials in the polar coordinate space.
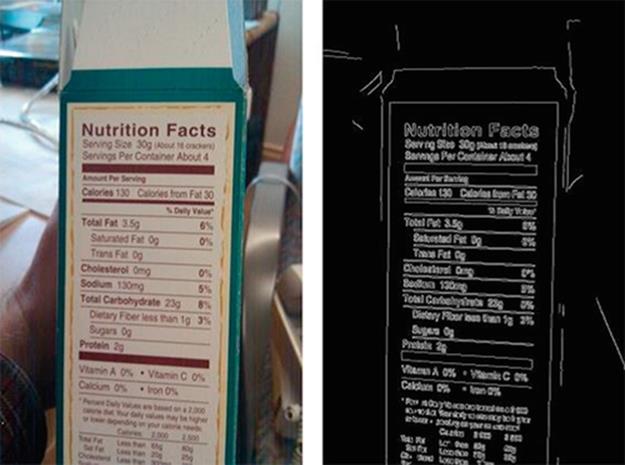
FIGURE 2 Original NL (left); NL with detected edges (right).
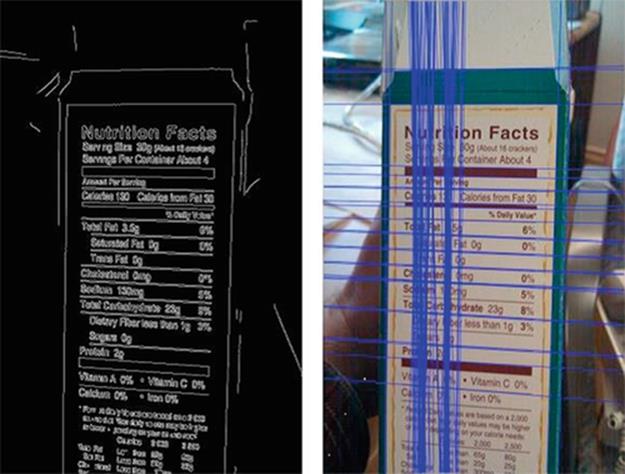
FIGURE 3 NL with edges (right); NL with detected lines (right).
Corner detection is done primarily for text spotting because text segments tend to contain many distinct corners. Thus, image segments with higher concentrations of corners are likely to contain text. Corners are detected with the dilate-erode method [13] (seeFigure 4). Two stages of the dilate-erode method with different 5 × 5 kernels are applied. Two stages of dilate-erode with different kernels are applied. The first stage uses a 5 × 5 cross dilate kernel for horizontal and vertical expansions. It then uses a 5 × 5 diamond erode kernel for diagonal shrinking. The resulting image is compared with the original and those pixels which are in the corner of an aligned rectangle are found.
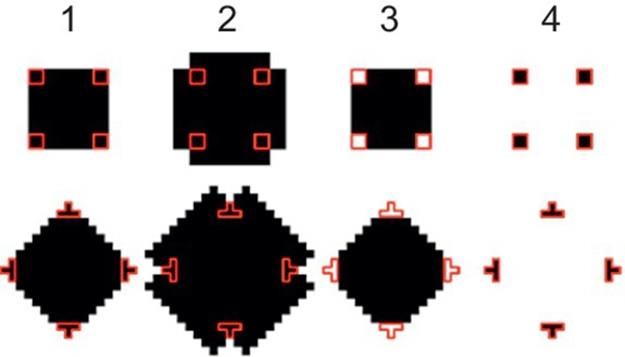
FIGURE 4 Corner detection steps.
The second stage uses a 5 × 5 X-shape dilate kernel to expand in the two diagonal directions. A 5 × 5 square kernel is used next to erode the image and to shrink it horizontally and vertically. The resulting image is compared with the original and those pixels which are in a 45° corner are identified. The resulting corners from both steps are combined into a final set of detected corners.
In Figure 4, the top sequence of images corresponds to stage one when the cross and diamond kernels are used to detect aligned corners. The bottom sequence of images corresponds to stage two when the X-shape and square kernels are used to detect 45° corners. Step one shows the original input of each stage, step two is the image after dilation, step three is the image after erosion, and step four is the difference between the original and eroded versions. The resulting corners are outlined in red (dark gray in print versions) in each step to provide a basis of how the dilate-erode operations modify the input.
Figure 5 demonstrates the dilate-erode algorithm used on an image segment that contains text. The dilate steps are substantially whiter than their inputs, because the appropriate kernel is used to expand white pixels. Then the erode steps partially reverse this whitening effect by expanding darker pixels. The result is the pixels with the largest differences between the original image and the result image. Figure 5 shows corners detected on an image segment with text.
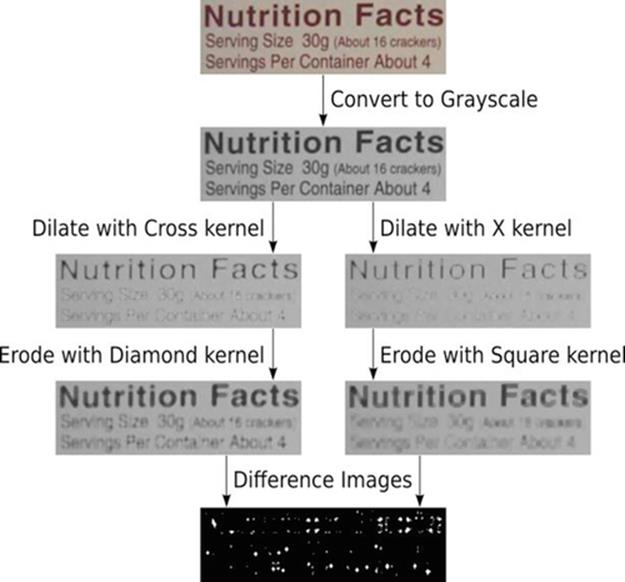
FIGURE 5 Corner detection for text spotting.
Our previous NL localization algorithm [5] was based on the assumption that the NL exists in the image and is horizontally or vertically aligned with the smartphone’s camera. Unfortunately, these conditions sometimes do not hold in the real world due to shaking hands or failing eyesight. The exact problem that the new algorithm addresses is twofold. Does a given input image contain a skewed NL? And, if so, within which aligned rectangular area can the NL be localized? In this investigation, a skewed NL is one which has been rotated away from the vertical alignment axis by up to 35-40° in either direction, i.e., left or right. An additional objective is to decrease processing time for each frame to about 1 s.
3.2 Corner Detection and Analysis
Before the proper NL localization begins, a rotation correction step is performed to align inputs which may be only nearly aligned. This correction is performed by taking advantage of high numbers of horizontal lines found within NLs. All detected lines that are horizontal within 35-40° in either direction (i.e., up or down) are used to compute an average horizontal rotation. This rotation is used to perform the appropriate correcting rotation. Corner detection is executed after the rotation. The dilate-erode corner detector is applied to retrieve a two-dimensional bitmap where true white pixels correspond to detected corners and all other false pixels are black. Figure 5 shows main steps of the dilate-erode corner detection algorithm. Figure 6 (right) shows the corners detected in the frame shown in Figure 6 (left).
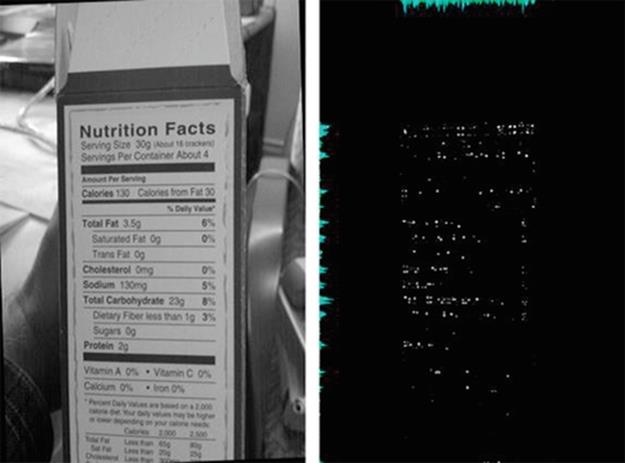
FIGURE 6 Visualization of the corner detection output.
The dilate-erode corner detector is used specifically because of its high sensitivity to contrasted text, which is why we assume that the region is bounded by these edges contains a large amount of text. Areas of the input image which are not in focus do not produce a large amount of corner detection results and tend not to lie within the needed projection boundaries.
Two projections are computed after the corners are detected. The projections are sums of the true pixels for each row and column. The image row projection has an entry for each row in the image while the image column projection has an entry for each column in the image. The purpose of these projections is to determine boundaries for the top, bottom, left, and right boundaries of the region in which most corners lie. Each value of the projection is averaged together and a projection threshold is set to twice the average. Once a projection threshold is selected, the first and last indexes of each projection greater than the threshold are selected as the boundaries of that projection.
3.3 Selection of Boundary Lines
After the four corner projections have been computed, the next step is to select the Hough lines that are closest to the boundaries selected on the basis of the four corner projections. In two images of Figure 6, the four light blue (white in print) lines are the lines drawn on the basis of the four corner projection counts. The dark blue (dark gray in print) lines show the lines detected by the HT. In Figure 7 (left), the bottom light blue (white in print) line is initially chosen conservatively where the row corner projections drop below a threshold. If there is evidence that there are some corners present after the initially selected bottom lines, the bottom line is moved as far below as possible, as shown in Figure 7 (right).
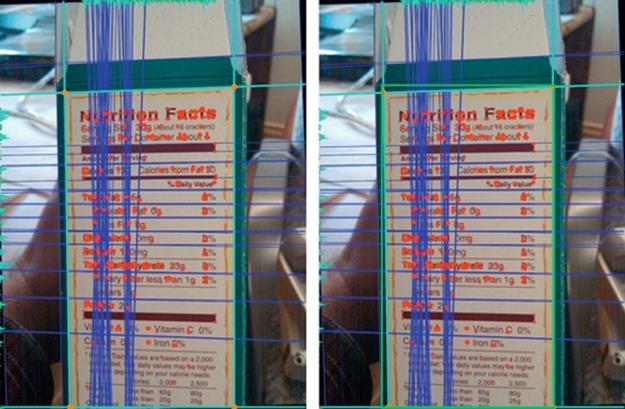
FIGURE 7 Initial boundaries (left); final boundaries (right).
When the bounded area is not perfectly rectangular, which makes integration with later analysis where a rectangular area is expected to be less straightforward. To overcome this problem, a rectangle is placed around the selected Hough boundary lines. After the four intersection coordinates are computed (see Section 3.3 for details), their components are compared and combined to find a smallest rectangle that fits around the bounded area, as shown in Figure 7. This rectangle is the final result of the NL localization algorithm. As was stated before, the four corners found by the algorithm can be passed to other algorithms such as row dividing, word splitting, and Optical Character Recognition (OCR). Row dividing, world splitting, and OCR are beyond the scope of this chapter. Figure 8 shows a skewed NL localize by our algorithm.
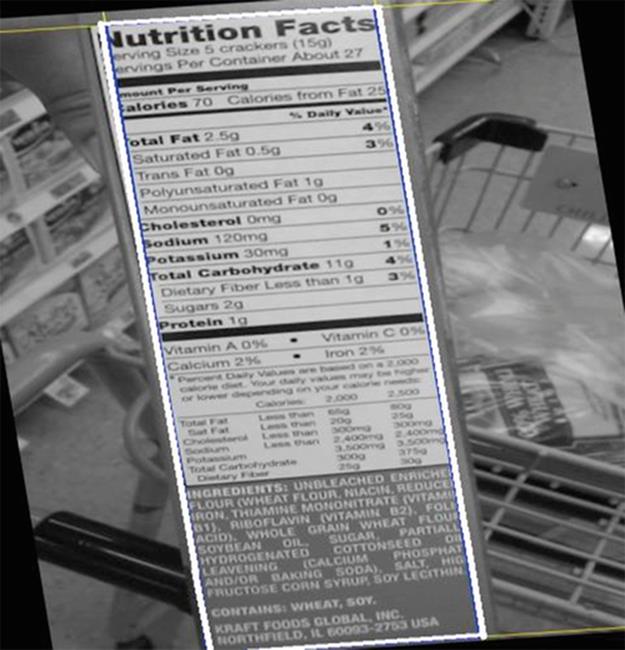
FIGURE 8 Localized skewed NL.
3.4 Finding Intersections in Cartesian Space
Each Hough line returned by the HT is described as (ρ, θ), where ρ is the length of the normal from the line to the origin of the polar coordinate system and θ is the angle specifying the rotation of the line about the origin. Given l1 = (ρ1, θ1) and l2 = (ρ2, θ2) in the polar coordinate system, we need to find the intersection of these lines in the Cartesian system in order to find the four intersection coordinates shown in Figure 7. If θ1 = θ2 and ρ1 = ρ2, then l1 and l2 are the same line and there are infinitely many intersections. Ifθ1 = θ2 and ρ1 ≠ ρ2, then l1 and l2 are parallel lines and have no intersections. If l1 and l2 do not coincide and are not parallel, there are three cases to consider, shown in Figures 8, 9, and 10. In each case, there are two normals AB and AC, denoted as n1 and n2, respectively (see Figure 8) to l1 and l2. The normal n1 goes from the origin A to point B on l1 whereas the normal n2 goes from the origin A to point C on l2. The segment BC, denoted as l3, completes the triangle T1 consisting of points A, B and C. Another triangle T2consists of points B, C, and D, where point D is the sought intersection of l1 and l2. Consider the line segments BD and CD denoted as l4 and l5, respectively (see Figures 9, 10, or 11). Once l4 is found, point D is found by adding vectors n1 and l4. Technical details of this computation are given in [14].
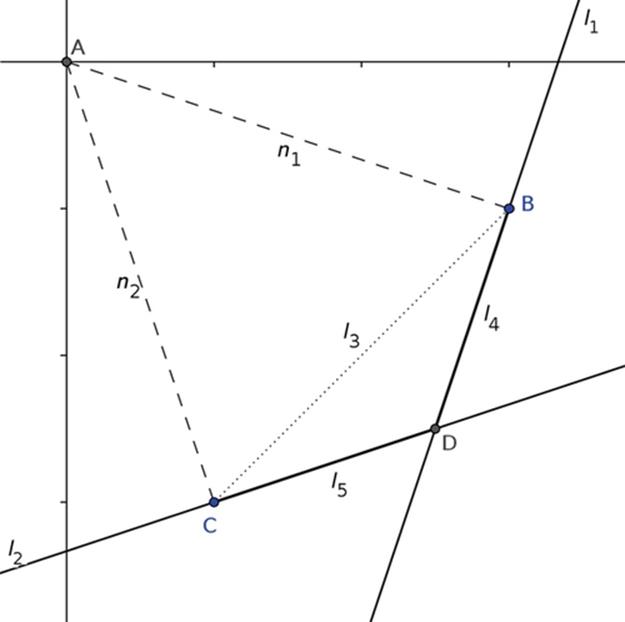
FIGURE 9 Case 1: Intersection D is between two normals.
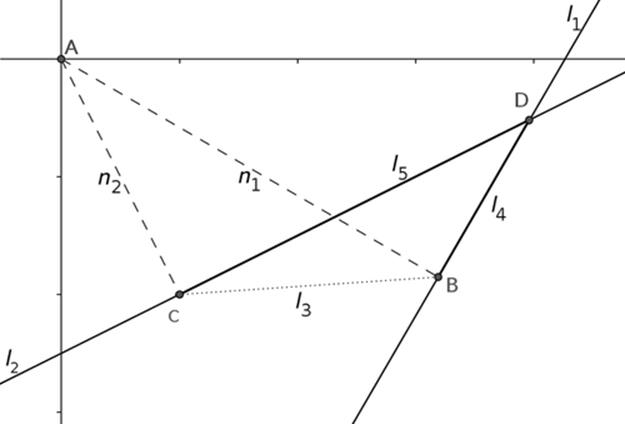
FIGURE 10 Case 2: Intersection D is above two normals.
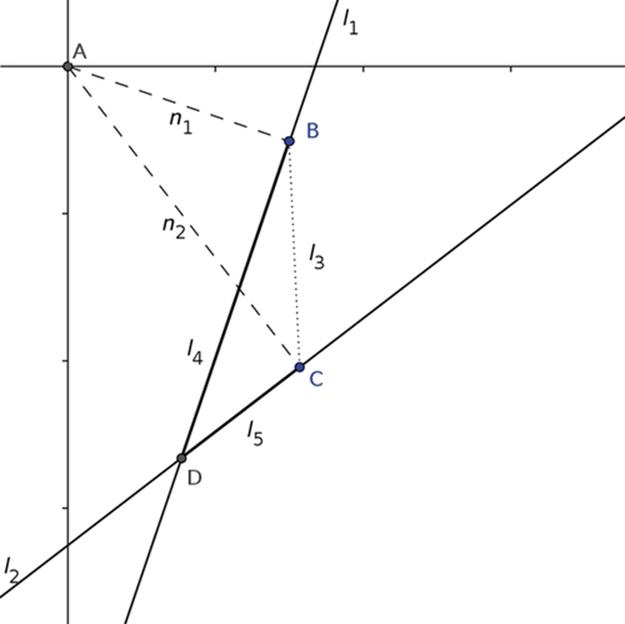
FIGURE 11 Case 3: Intersection D is below two normals.
4 Experiments
4.1 Complete and Partial True Positives
We assembled 378 images captured from a Google Nexus 7 Android 4.3 smartphone during a typical shopping session at a local supermarket. Of these images, 266 contained an NL and 112 did not. Our skewed NL localization algorithm was implemented and tested on the same platform with these images.
We manually categorized the results into five categories: complete true positives, partial true positives, true negatives, false positives, and false negatives. A complete true positive is an image where a complete NL was localized. A partial true positive is an image where only a part of the NL was localized by the algorithm. Figure 12 shows examples of complete and partial true positives.
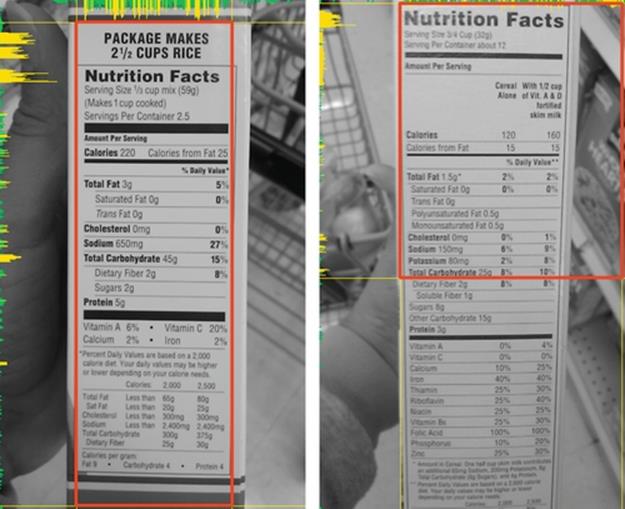
FIGURE 12 Complete (left) vs. partial (right) true positives.
Figure 13 shows another example of complete and partial true positives. The image on the left was classified as a complete true positive, because the part of the NL that was not detected is insignificant and will likely be fixed through simple padding in subsequent processing. The image on the right, on the other hand, was classified as a partial true positive. While the localized area does contain most of the NL, some essential text in the left part of the NL is excluded, which will likely cause failure in subsequent processing.
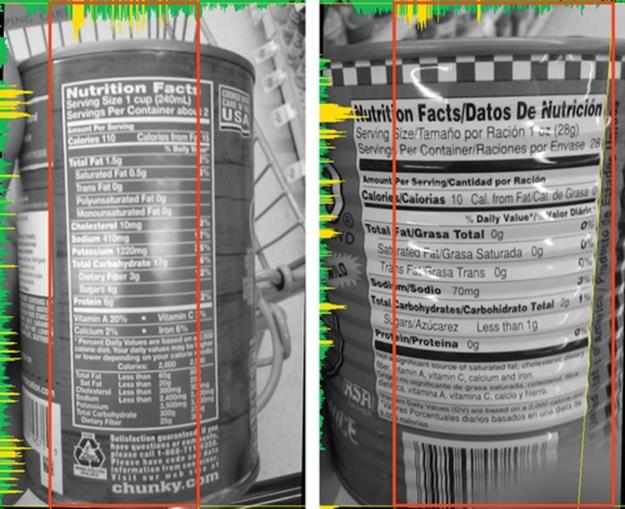
FIGURE 13 Complete (left) vs. partial (right) true positives.
In Figure 14, the left image technically does not include the entire NL, because the list of ingredients is only partially included. However, we classified it as a complete true positive since it includes the entire table on nutrition facts. The right image of Figure 14, on the other hand, is classified as a partial true positive, because some parts of the nutrition facts table is not included in the detected area.
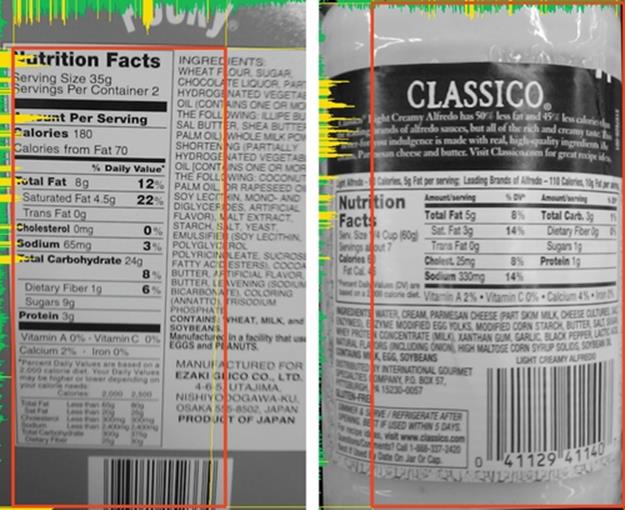
FIGURE 14 Complete (left) vs. partial (right) true positives.
4.2 Results
Of the 266 images that contained NLs, 83 were classified as complete true positives and 27 were classified as partial true positives, which gives a total true positive rate of 42% and a false negative rate of 58%. All test images with no NLs were classified as true negatives. The remainder of our analysis was done via precision, recall, and specificity, and accuracy. Precision is the percentage of complete true positive matches out of all true positive matches. Recall is the percentage of true positive matches out of all possible positive matches. Specificity is the percentage of true negative matches out of all possible negative matches. Accuracy is the percentage of true matches out of all possible matches.
Table 1 gives the NL localization results where PR stands for “precision,” TR for “total recall,” CR for “complete recall,” PR for “partial recall,” SP for “specificity,” and ACC for “accuracy.” While total and complete recall numbers are somewhat low, this is a necessary trade-off of maximizing specificity. Recall from Section 1 that we have designed our algorithm to maximize specificity. In other words, the algorithm is less unlikely to detect NLs in images where no NLs are present than in images where they are present. As we argued above, lower recall and precision may not matter much because of the fast rate at which input images are processed on target devices, but there is definitely room for improvement.
Table 1
NL Localization Results

4.3 Limitations
The majority of false negative matches were caused by blurry images. Blurry images are the result of poor camera focus and instability. Both the CED and dilate-erode corner detector require rapid and contrasting changes to identify key points and lines of interest. These points and lines are meant to correspond directly with text and NL borders. These useful data cannot be retrieved from blurry images, which results in run-time detection failures. The only recourse to deal with blurry inputs is improved camera focus and stability, both of which are outside the scope of this algorithm, because it is a hardware problem. It is likely to work better in later models of smartphones. The current implementation on the Android platform attempts to force focus at the image center but this ability to request camera focus is not present in older Android versions. Over time, as device cameras improve and more devices run newer versions of Android, this limitation will have less impact on recall but it will never be fixed entirely.
Bottles, bags, cans, and jars have a large showing in the false negative category due to Hough line detection difficulties on curved lines (see Figure 15). One possibility to get around this limitation is a more rigorous line detection step in which a segmented HT is performed and regions which contain connecting detected lines are grouped together. These grouped regions could be used to warp a curved image into a rectangular area for further analysis.
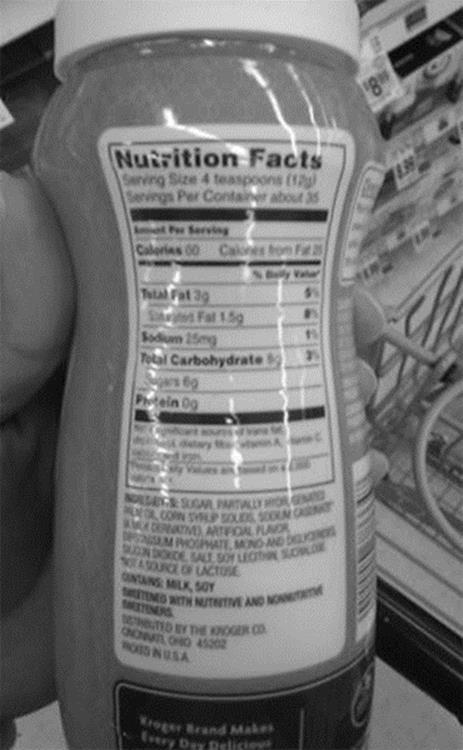
FIGURE 15 NL with curved lines.
Smaller grocery packages (see Figure 16) tend to have irregular NLs that place a large amount of information into tiny spaces. NLs with irregular layouts present an extremely difficult problem for analysis. Our algorithm better handles more traditional NL layouts with generally empty surrounding areas. As a better analysis of corner projections and Hough lines is integrated into our algorithm, it will become possible to classify inputs as definitely traditional or more irregular. If this classification can work reliably, the method could switch to a much slower and generalized localization to produce better results in this situation while still quickly returning results for more common layouts.
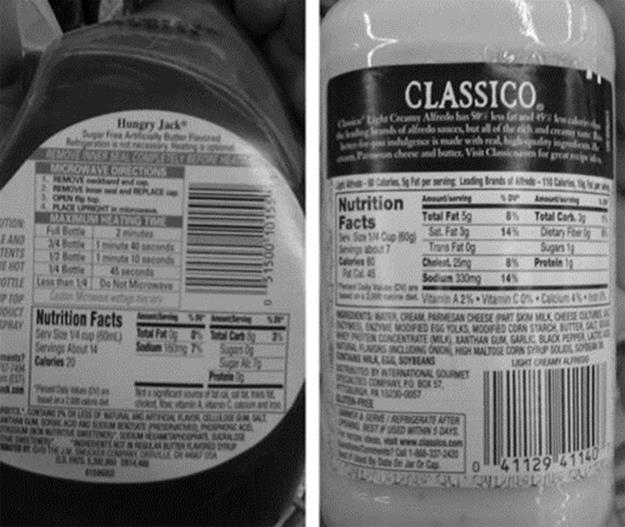
FIGURE 16 Irregular NL layouts.
5 Conclusions
We have made several interesting observations during our experiments. The row and column projects have two distinct patterns. The row projection tends to create evenly spaced short spikes for text in each line of text within the NL while the column projection tends to contain one very large spike where the NL begins at the left due to the sudden influx of detected text. We have not performed any in-depth analysis of these patterns. However, the projection data were collected for each processed image. We plan to do further investigations of these patterns, which will likely allow for run-time detection and corresponding correction of inputs of various rotations. For example, the column projections could be used for greater accuracy in determining the left and right bounds of the NL while row projections could be used by later analysis steps such as row division. Certain projection profiles could eventually be used to select customized localization approaches at run time.
During our experiments with and iterative development of this algorithm, we took note of several possible improvements that could positively affect the algorithm’s performance. First, since input images are generally not square, the HT returns more results for lines in the longer dimension, because they are more likely to pass the threshold. Consequently, specifying different thresholds for the two dimensions and combining them for various rotations may produce more consistent results.
Second, since only those Hough lines that are nearly vertical or horizontal are of use to this method, improvements can be made by only allocating bins for those Θ and ρ combinations that are considered important. Fewer bins means less memory to track all of them and fewer tests to determine which bins need to be incremented for a given input.
Third, both row and column corner projections tend to produce distinct patterns which could be used to determine better boundaries. After collecting a large amount of typical projections, further analysis can be performed to find generalizations resulting in a faster method to improve boundary selection.
Fourth, in principle, a much more intensive HT method can be developed that would divide the image into a grid of smaller segments and perform a separate HT within each segment. One advantage of this approach is to look for the skewed, curved, or even zigzagging lines between segments that could actually be connected into a longer line. While the performance penalty of this method could be quite high, it could allow for the detection and dewarping of oddly shaped NLs. Finally, a more careful analysis of the found Hough lines during the early rotation correction could allow us to detect and localize NLs of all possible rotations, not just skewed ones.
The U.S. Food and Drug Administration recently proposed some changes to the design of NLs on product packages [15]. The new design is expected to change how serving sizes are calculated and displayed. Percent daily values are expected to shift to the left side of the NL, which allegedly will make them easier to read. The new design will also require information about added sugars as well as the counts for Vitamin D and potassium. We would like to emphasize that this redesign, which is expected to take at least 2 years, will not impact the proposed algorithm, because the main tabular components of the new NL design will remain the same. The nutritional information in the new NLs will still be presented textually in rows and columns. Therefore, the corner and line detection and their projections will work as they work on the current NL design [16].
References
[1] Anding R. Nutrition made clear. Chantilly, VA: The Great Courses; 2009.
[2] Rubin AL. Diabetes for dummies. 3rd ed. Hoboken, NJ: Wiley, Publishing, Inc; 2008.
[3] Nutrition Labeling and Education Action of 1990. http://en.wikipedia.org/wiki/Nutrition_Labeling_and_Education_Act_of_1990.
[4] Food Labelling to Advance Better Education for Life. Available at www.flabel.org/en.
[5] Kulyukin V, Kutiyanawala A, Zaman T, Clyde S. Vision-based localization and text chunking of nutrition fact tables on android smartphones. In: Proceedings of the International Conference on Image Processing, Computer Vision, and Pattern Recognition (IPCV 2013); Las Vegas, NV: CSREA Press; 2013:1-60132-252-6314–320.
[6] Nicholson J, Kulyukin V. ShopTalk: independent blind shopping = verbal route directions + barcode scans. In: Proceedings of the 30th Annual Conference of the Rehabilitation Engineering and Assistive Technology Society of North America (RESNA 2007), June 2007, Phoenix, Arizona; 2007 Avail. on CD-ROM.
[7] Kulyukin V, Kutiyanawala A. Accessible shopping systems for blind and visually impaired individuals: design requirements and the state of the art. Open Rehabil J. 2010;2:158–168. doi:10.2174/1874943701003010158 ISSN 1874–9437.
[8] Kulyukin V, Kutiyanawala A, Zaman T. Eyes-free barcode detection on smartphones with Niblack’s binarization and support vector machines. In: Proceedings of the 16th International Conference on Image Processing, Computer Vision, and Pattern Recognition (IPCV 2012), Vol. 1; Las Vegas, NV: CSREA Press; 2012:284–290 July 16–19. ISBN 1-60132-223-2, 1-60132-224-0.
[9] Kulyukin V, Zaman T. Vision-based localization of skewed UPC barcodes on smartphones. In: Proceedings of the International Conference on Image Processing, Computer Vision, & Pattern Recognition (IPCV 2013); Las Vegas, NV: CSREA Press; 2013:1-60132-252-6344–350 314–320.
[10] Fog BJ. A behavior model for persuasive design. In: Proceedings of the 4th International Conference on Persuasive Technology, Article 40; New York, USA: ACM; 2009.
[11] Canny JF. A computational approach to edge detection. IEEE Trans Pattern Anal Mach Intell. 1986;8:679–698.
[12] Duda RO, Hart PE. Use of the hough transformation to detect lines and curves in pictures. Comm. ACM. 1972;15:11–15 January.
[13] Laganiere R. OpenCV 2 computer vision application programming cookbook. UK: Packt Publishing Ltd; 2011.
[14] Blay C. On mobile detection and localization of skewed nutrition fact tables. Department of Computer Science, Utah State University; 2013. M.S. Thesis http://digitalcommons.usu.edu/etd/2015/.
[15] Tavernise S. New F.D.A. nutrition labels would make ‘serving sizes’ reflect actual servings. In: New York Times; February 27, 2014.
[16] Kulyukin V, Blay C. An algorithm for mobile vision-based localization of skewed nutrition labels that maximizes specificity. In: Proceedings of the International Conference on Image Processing, Computer Vision, & Pattern Recognition (IPCV 2014); Las Vegas, NV: CSREA Press; 2014:1-60132-280-13–9.
All materials on the site are licensed Creative Commons Attribution-Sharealike 3.0 Unported CC BY-SA 3.0 & GNU Free Documentation License (GFDL)
If you are the copyright holder of any material contained on our site and intend to remove it, please contact our site administrator for approval.
© 2016-2026 All site design rights belong to S.Y.A.