Learning Highcharts 4 (2015)
Chapter 15. Highcharts Online Services and Plugins
In the previous chapter, you learned how to run Highcharts on the server side. This enables Highcharts to expand its reach to online services. We will visit these services in this chapter and explore what benefits we can gain from them. As well as that, we examine how we can extend Highcharts with plugins. In this chapter, we will cover the following topics:
· What service export.highcharts.com provides
· A step-by-step exercise to create an online chart from the new cloud service—cloud.highcharts.com
· What a Highcharts plugin is
· Two plugin examples – regression and draggable points
· Creating a new user experience by interoperating both plugins
· How to write a plugin – extend existing methods, export a new method, and handle events
Highcharts export server – export.highcharts.com
In the last chapter, we looked into running Highcharts on the server side. However, some users may not want to set up their own server operations. This is where export.highcharts.com comes in. Originally, it was only set up for the exporting module so that users running Highcharts on the Internet could export their charts freely. Later, the URL was expanded to support online services. This let users enter their own Highcharts configuration and download the resulting chart images.
The following is part of the export.highcharts.com web page:

As we can see, the user input indeed corresponds to the parameters of the server-side script, highcharts_convert.js, which we covered in a previous chapter. Both the web interface and server process are implemented in Java, which deliver the user's options to the PhantomJS/highcharts_convert.js process and exports it into SVG. Once the Java server receives the SVG result, it launches Batik to format into image files. The source for the whole web service solution is available in the exporting-server/java/highcharts-exportdirectory.
The downside to the online export service is that it is not WYSIWYG, and so can be unintuitive to use. For this reason, a new web service with much richer user experience was born— Highcharts Cloud Service. We will take a ride in the next section and see what difference it brings.
Highcharts Cloud Service
In this section, we will review a brand new online chart service developed by the Highcharts team, Highcharts Cloud Service (http://cloud.highcharts.com). The following screenshot shows the initial welcome screen:
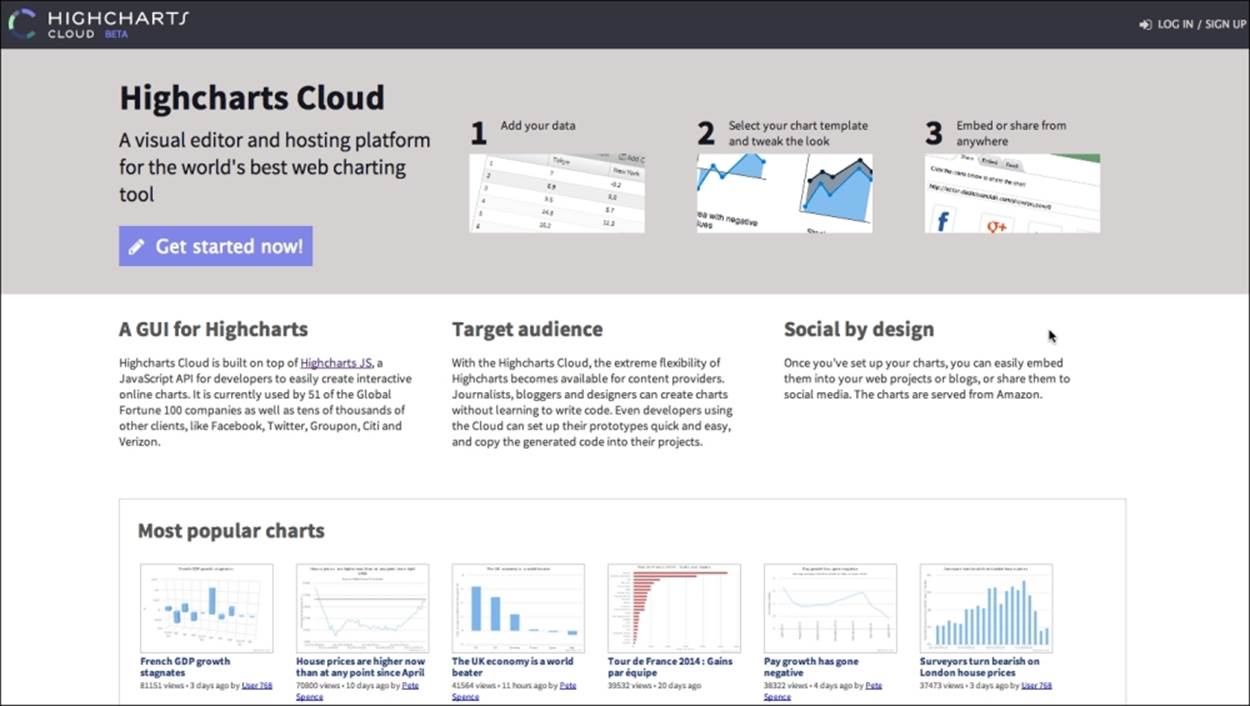
Highcharts Cloud Service is a major milestone in terms of expanding the product line. It is designed for users to:
· Create HTML5 charts even without any JavaScript or Highcharts knowledge (in SIMPLE mode)
· Prototype their charts interactively without any installation and setting up on the web server and Highcharts
· Embed charts in online articles, applications, or web pages with a simple hyperlink
· Store their charts in the cloud rather than locally
· Share their charts easily with other people
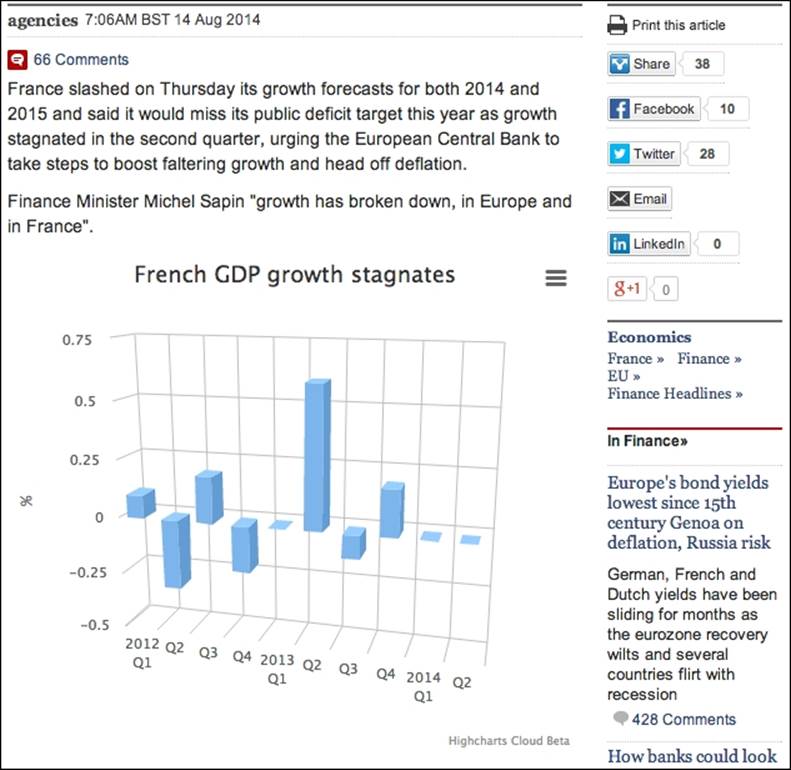
The following is a screenshot of a news website linking a chart created from the cloud service:
Let's try to create our first chart using the cloud service. The web interface is wizard-based and intuitive for any non-technical users. The following is the initial screen of the cloud service:
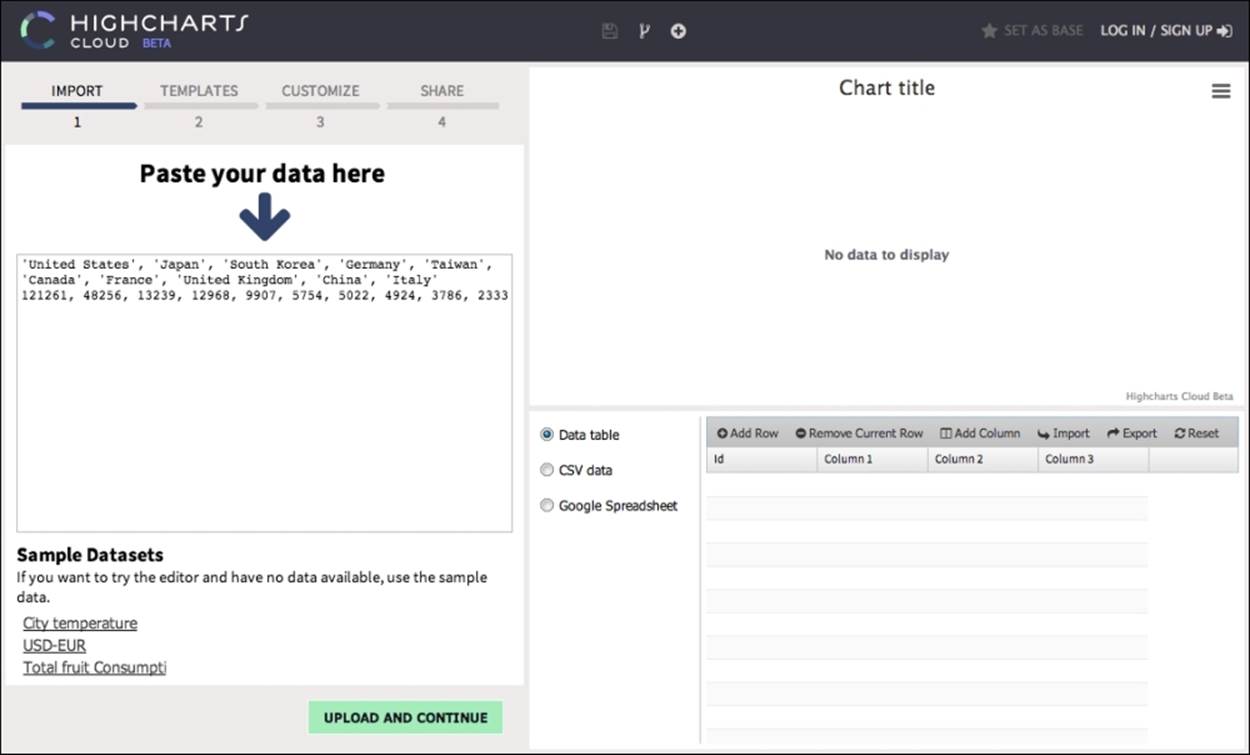
There are three major sections in the interface: the left wizard panel, the top-right result chart panel, and the bottom-right series data editor. At the top of the left wizard panel, it shows which stage we are currently in. At the first stage (IMPORT), we can either paste our CSV data into the text area and click on upload or manually enter series data through the bottom-right editor.
In the preceding screenshot, we have already pasted some data in the left panel. When we click on the Upload and Continue button, the application progresses to stage 2 (TEMPLATES). Here is the screenshot:
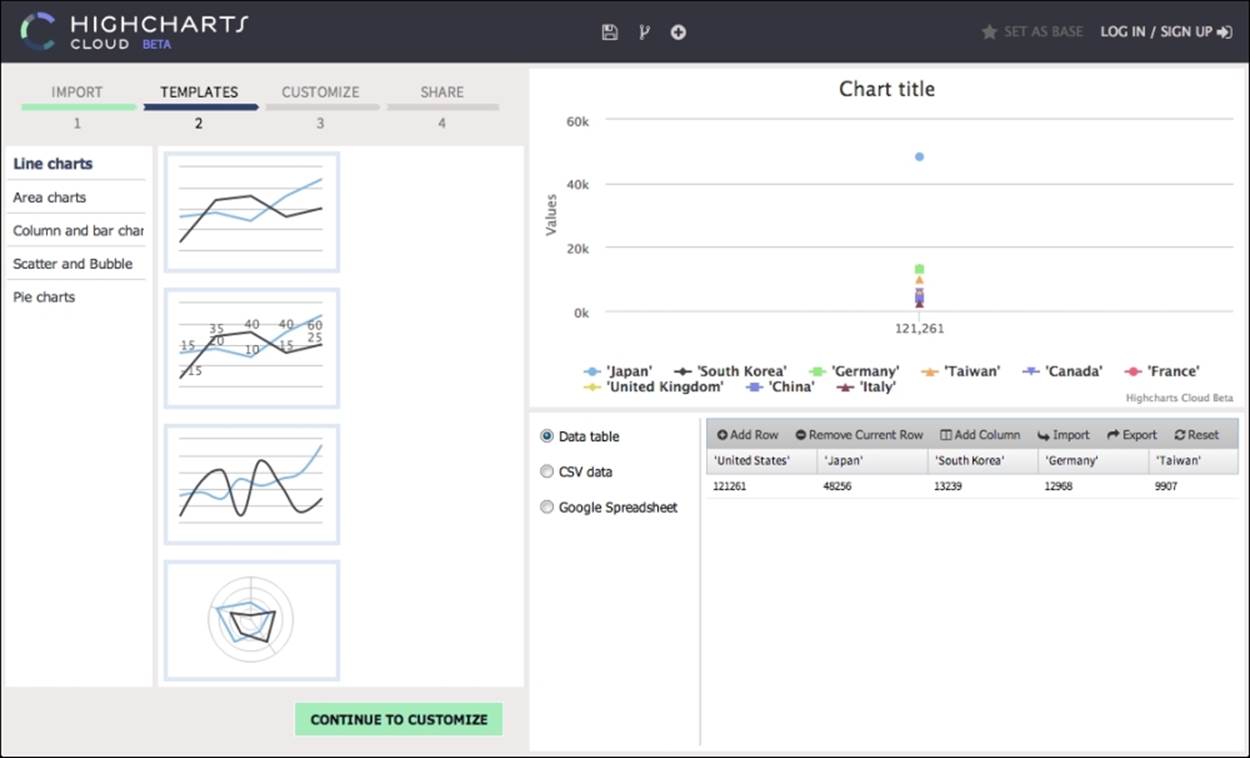
First, we can see the top-right panel updated with the default line series and the bottom-right editor panel is populated with the series data. Although the top-right chart doesn't show anything meaningful, it will become clearer as we configure the chart in a later stage. At this point, we can further edit the series data in the editor panel if we need to. Let's select a series in the left panel, 3D column chart, which immediately updates the top-right chart:
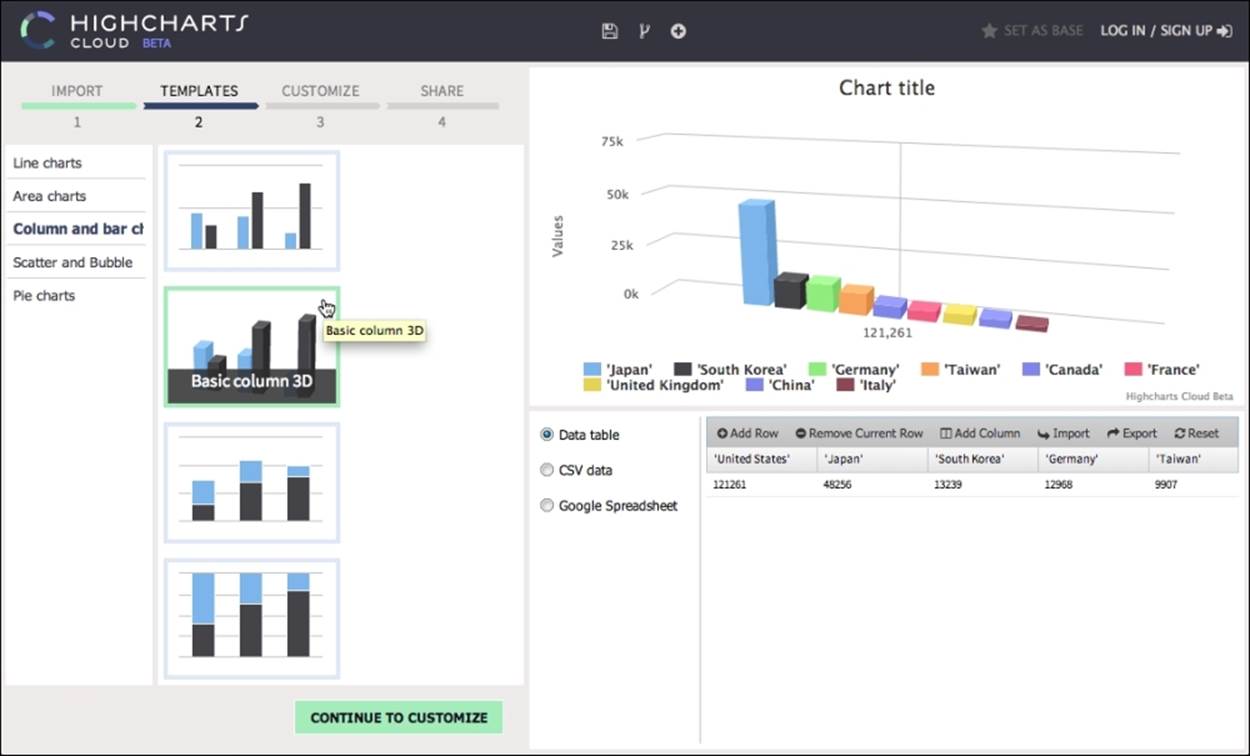
A 3D column chart is displayed in the top-right panel, but the axis and chart title are still incorrect. We can either click on the CONTINUE TO CUSTOMIZE button (shown in the preceding screenshot) or on CUSTOMIZE to go to the next stage and tune each component in the chart:
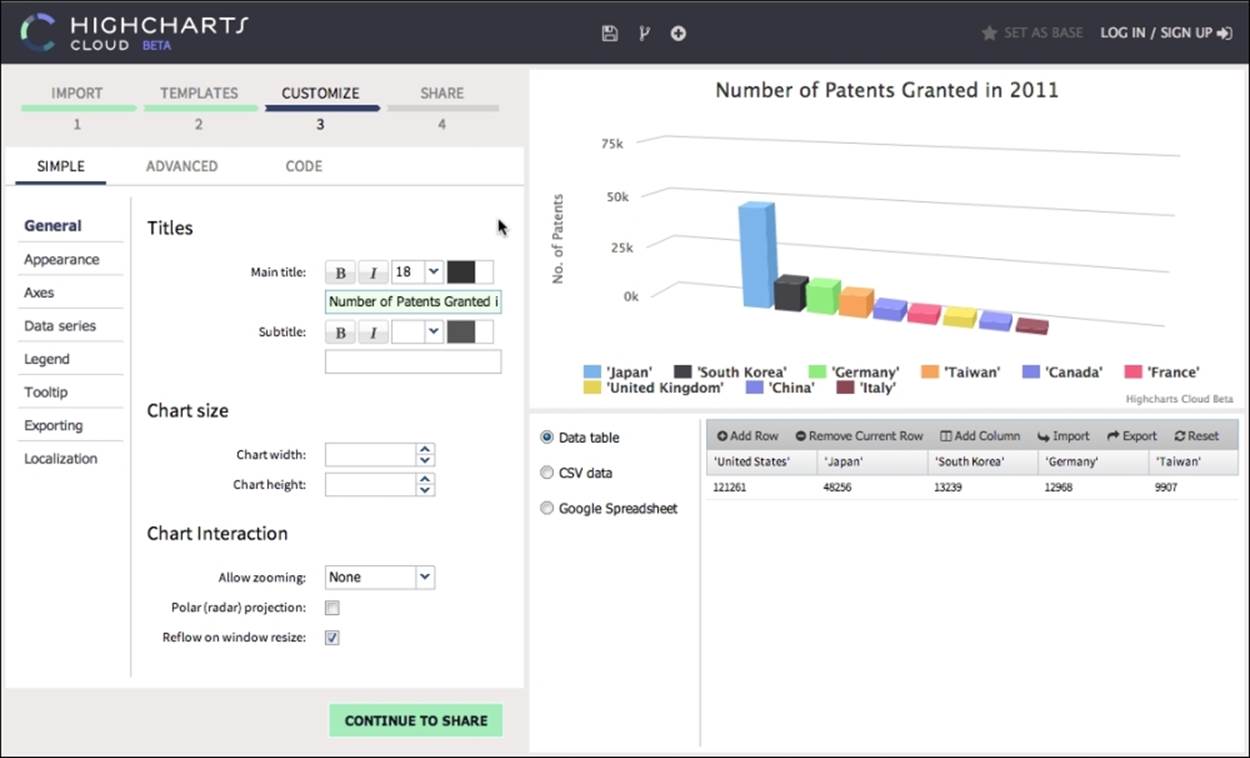
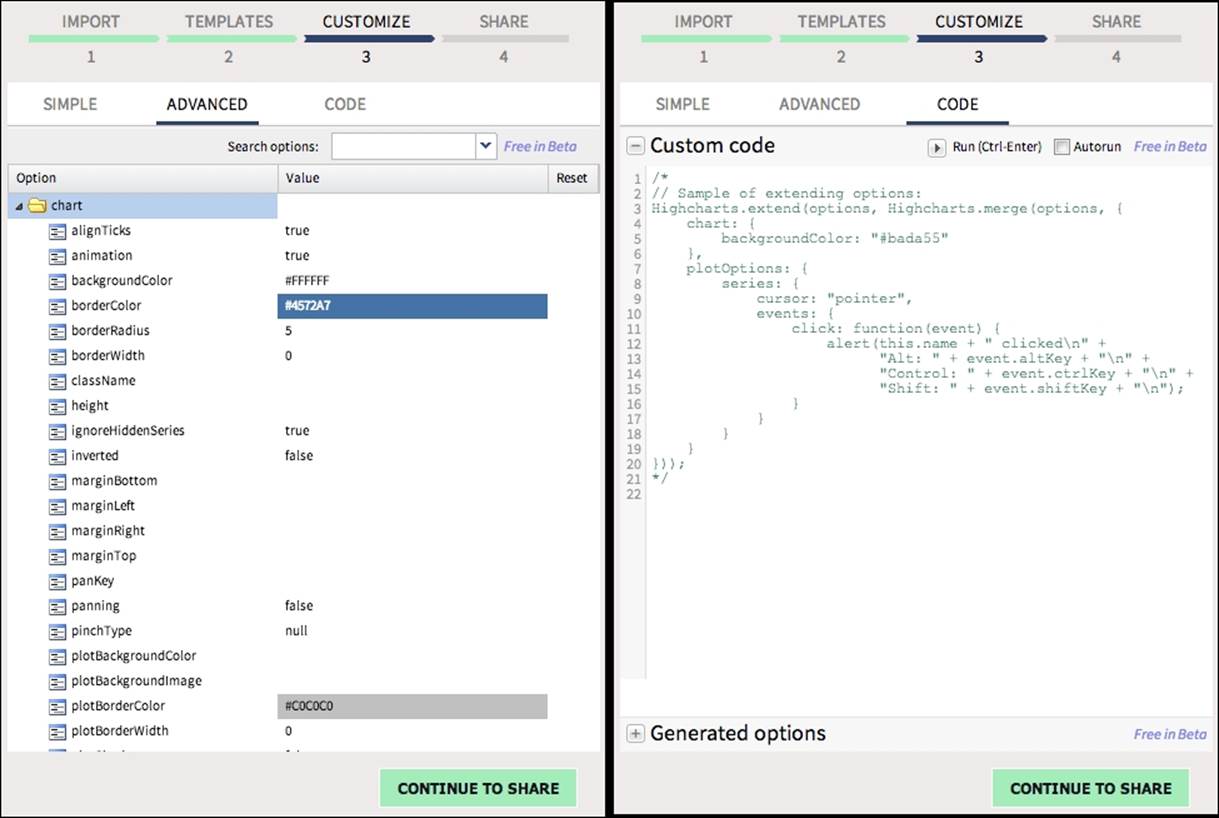
As we can see, there are different areas in the chart that we can choose to configure. In this example, we have changed the chart title, axis type, title, and label format. Note that at the CUSTOMIZE stage, there are three tabs shown underneath. This lets the user choose how to update the chart. SIMPLE is the most basic and is for non-technical users without any programming experience, or for quick simple changes. ADVANCED mode is for users who are familiar with Highcharts' options. The user interface is a simple properties update in name and value style. The CODE level is for users who wish to write JavaScript code for the chart, for example, the event handler. The following screenshot shows both the ADVANCED and CODE user interfaces:
Once we are happy with our final chart, we can click on CONTINUE TO SHARE to generate a hyperlink for the chart.
Highcharts plugins
Highcharts can be extended through plugins that allow us to add functionality without disturbing the core layer of code and are easy to share. There is a library of plugins available online contributed by Highcharts staff and other users athttp://www.highcharts.com/plugin-registry. One distinct advantage of developing features out of plugins is that we can pick and choose the plugin features and build a compressed JavaScript library from them. In fact, we can already do something similar with the Highcharts library on the download page.
In this section, we will take a tour of a couple of plugins that you may find handy.
The regression plot plugin
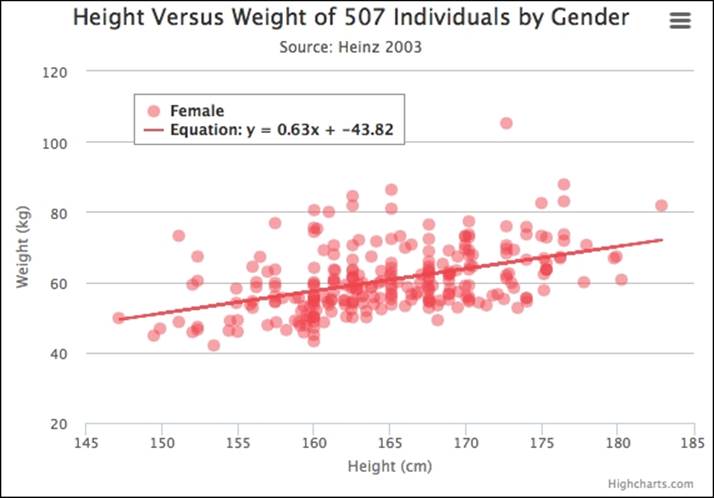
When we create a scatter plot with lots of data points, it is often worthwhile to overlay them with a regression line. Of course, we can always achieve this by adding a line series manually. However, we still need to write the code for regression analysis. It is much more convenient to include a plugin. The Highcharts regression plugin created by Ignacio Vazquez does the job nicely. First, we include the plugin:
<script src="http://rawgithub.com/phpepe/highcharts-regression/master/highcharts-regression.js"> </script>
Then, we create our scatter chart as usual. Since we include the regression plugin, it provides additional regression options:
series: [{
regression: true ,
regressionSettings: {
type: 'linear',
color: 'rgba(223, 83, 83, .9)'
},
name: 'Female',
color: 'rgba(223, 83, 83, .5)',
data: [ [161.2, 51.6], [167.5, 59.0],
....
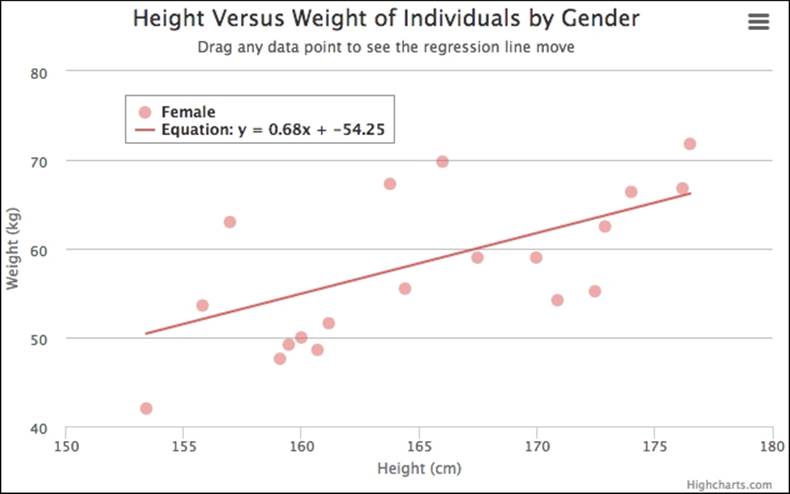
Here is the chart from the demo (http://www.highcharts.com/plugin-registry/single/22/Highcharts%20regression):
The draggable points plugin
Here is another remarkable plugin by Torstein that enables chart viewers to drag any series data points. We import the plugin with the following line:
<script src="http://rawgithub.com/highslide-software/draggable-points/master/draggable-points.js"></script>
This plugin brings two new point events, drag and drop, which we can define the handlers for via the plotOptions.series.point.events option (or the events option in a data point object). Here is the example code from the demo:
events: {
drag: function(e) {
// Update new data value in 'drag' div box
$('#drag').html(
'Dragging <b>' + this.series.name + '</b>, <b>' +
this.category + '</b> to <b>' +
Highcharts.numberFormat(e.newY, 2) + '</b>'
);
},
drop: function() {
$('#drop').html(
'In <b>' + this.series.name + '</b>, <b>' +
this.category + '</b> was set to <b>' +
Highcharts.numberFormat(this.y, 2) + '</b>'
);
}
}
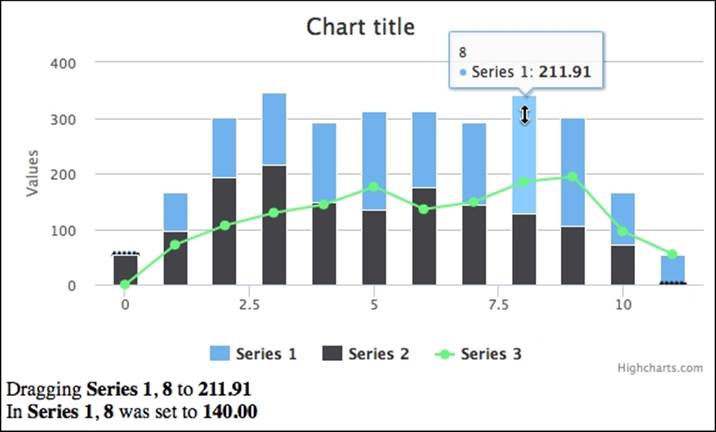
When we select a data point and move the mouse, a drag event is triggered and the demo code will update the textbox below the chart, as seen in the following screenshot. The plugin provides several new options to control how we can drag and drop the data points. The following is a usage example:
series: [{
data: [0, 71.5, 106.4, .... ],
draggableY: true,
dragMinY: 0,
type: 'column',
minPointLength: 2
}, {
data: [0, 71.5, 106.4, ....],
draggableY: true,
dragMinY: 0,
type: 'column',
minPointLength: 2
}, {
The Boolean option draggableX/Y notifies which direction the data points can be dragged in. Furthermore, the drag range can be limited by the dragMinX/Y and dragMaxX/Y options. The following screenshot shows a column being dragged:
Creating a new effect by combining plugins
So far, we have seen the effect of two individual plugins. It's time for us to create a new user experience by loading these two plugins and combining their effects. The idea is to create a regression chart with movable data points, so that the regression line automatically adjusts in real time as we drag a data point. When doing so, we need to slightly modify the regression plugin code. Here is part of the original code:
(function (H) {
H.wrap(H.Chart.prototype, 'init', function (proceed) {
....
for (i = 0 ; i < series.length ; i++){
var s = series[i];
if ( s.regression && !s.rendered ) {
// Create regression series option
var extraSerie = {
....
};
// Compute regression based on the type
if (regressionType == "linear") {
regression = _linear(s.data) ;
extraSerie.type = "line";
}
}
}
// Append to series configuration array
....
});
function _linear(data) {
....
}
....
})(Highcharts);
Basically, before the chart is created and rendered, the plugin scans the series data, computes the regression result, and formats the result into a line series option. To do that, the regression implementation is included as part of the init method for the Chart class, which is called when a Chart object is created. To extend an existing function in Highcharts, we call the wrap function on a method inside the object's prototype. In other words, when a Chart object is created, it will call the init function, which executes each function stacked internally (closure). We will further investigate this subject later.
For the purpose of updating the regression line at runtime, we need the ability to call _linear from outside the plugin. Here is a pseudo code of the new modification to add a new method, updateRegression:
(function (H) {
H.wrap(H.Chart.prototype, 'init', function (proceed) {
....
});
H.Chart.prototype.updateRegression = function(point) {
// Get the series from the dragged data point
var series = point.series;
var chart = series.chart;
// Get the regression series associated
// with this data series
var regressSeries = chart.series[series.regressIdx];
// Recompute based on the regression type and
// update the series
if (series.regressionType == "linear") {
regression = _linear(series.data) ;
}
regressSeries.update(regression, true);
};
function _linear(data) {
....
}
....
})(Highcharts);
Now we have a regression plugin with an accessible method, updateRegression, to call the inner scope function _linear. With this new plugin function, we can link the functionality with the drag event exported by the draggable plugin:
plotOptions: {
series: {
point: {
events: {
drag: function(e) {
// Pass the dragged data point to the
// regression plugin and update the
// regression line
Highcharts.charts[0]
.updateRegression(e.target);
}
}
}
}
}
In order to observe the new effect more clearly, we use a smaller set of scatter plots. Here is the series configuration with both plugin options:
series: [{
regression: true ,
regressionSettings: {
type: 'linear',
color: 'rgba(223, 83, 83, .9)'
},
draggableX: true,
draggableY: true,
name: 'Female',
color: 'rgba(223, 83, 83, .5)',
data: [ [161.2, 51.6], [167.5, 59.0], [159.5, 49.2],
[157.0, 63.0], [155.8, 53.6], [170.0, 59.0],
[159.1, 47.6], [166.0, 69.8], [176.2, 66.8],
....
In the configuration, we have the scatter points draggable in both x and y directions and the regression type is linear. Let's load our new improved chart. The following is the initial screen:
Let's hypothetically assume an overactive, unapproved slim-fast drug, "mouse down", has slipped onto the market, which has some unreported side effects. The unfortunate ones will shoot up and the really unfortunate ones have their heights gravitate. Here is the outcome of the new result:
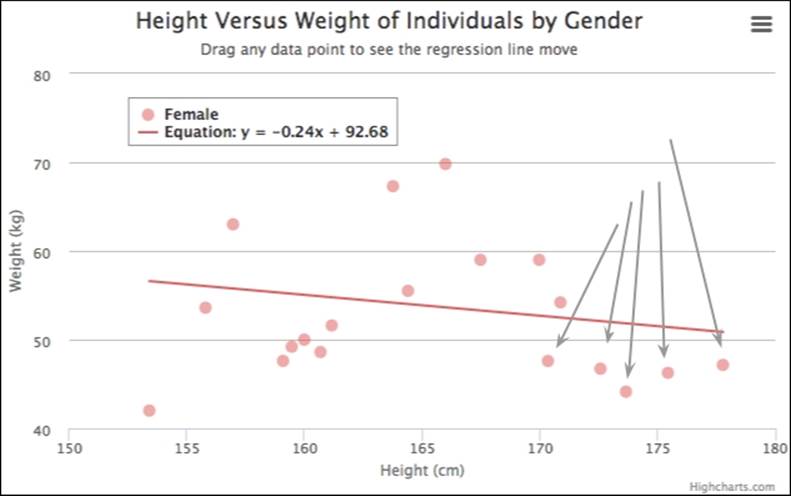
The regression line responds in real time as well as updating the top-left legend box as we mouse down those weights at the far-right data points.
Guidelines for creating a plugin
Some users create a plugin because certain tasks cannot be fulfilled by the API and the task is generic enough that it will be beneficial to other chart users. However, there is no standard API to create a plugin; developers have to be hands-on with their knowledge of Highcharts code. Nonetheless, there are a few guidelines that we can generalize from existing plugins.
Implementing the plugin within a self-invoking anonymous function
Always implement the plugin within a self-invoking anonymous function with Highcharts as the parameter. A self-invoking anonymous function is a pretty common technique in JavaScript. All the Highcharts plugins are implemented in this style. The following code shows an example:
(function (Highcharts) {
....
// what happens in anonymous function,
// stays in anonymous function
function hangoverIn(place) {
if (place === 'home') {
return 'phew';
} else if (place === 'hospital') {
return 'ouch';
} else if (place === 'vegas') {
return 'aaahhhhh!!';
}
}
})(Highcharts);
None of the named functions and variables declared in the plugin are accessible externally because they are declared within the scope of a self-invoking anonymous function (closure and module pattern). Hence, the implementation is private to the outside world unless we assign properties in the Highcharts namespace.
Using Highcharts.wrap to extend existing functions
Depending on the plugin task, some plugins need to extend an existing function. For instance, the regression plugin calls H.wrap to extend the init function, which is called from the Chart constructor. See the following code:
(function (H) {
H.wrap(H.Chart.prototype, 'init',
function (proceed) {
// Plugin specific code for processing
// chart configuration
....
// Must include this instruction for wrap
// method to work
proceed.apply(this,
Array.prototype.slice.call(arguments, 1));
}
);
})(Highcharts);
Highcharts.wrap is a commonly used function within plugins. The way wrap functions work is to overwrite the init function with a new function body that includes the previous implementation proceed. When we extend the method with our new plugin code in an anonymous function, we have to accept the proceed argument, which represents the parent function body. Before or after our plugin code, we must call proceed.apply on the same arguments in order to complete the chain of executions.
For reference, we can always extend methods for a particular series, for example, Highcharts.seriesTypes.column.prototype, where seriesTypes is an object containing all the series classes. Alternatively, if the plugin needs to be set up for all the series, we can invoke the wrap method on Highcharts.Series.prototype instead (all series classes are extended from Highcharts.Series).
Using a prototype to expose a plugin method
Sometimes we may need to export specific methods for a plugin. To do so, we should always define new methods inside the prototype property, such as:
(function (H) {
H.Chart.prototype.pluginMethod = function(x, y) {
....
};
})(Highcharts);
This is because any code declared within the anonymous function is not accessible from the outside. Therefore, the only way to create a callable method is bound to the object passed to the anonymous function, which is the top level Highcharts object in this case. The prototype property is the standard way in JavaScript to inherit properties and methods from objects. The reason for attaching the method within the prototype property is because we don't know how developers will use the plugin. For instance, they may decide to create a new Chart object and call the plugin method. In such cases, the plugin code will still work.
Defining a new event handler
Another type of action for plugins is to define new events, as we saw in the draggable plugin. Here is the problem: we need access to a chart element to bind the event handler, that is, after the chart is rendered. However, the class init method is executed prior to the chart being rendered. This is where the Highcharts.Chart.prototype.callbacks array comes in. It is a place designed to store external functions that require access to elements. For example, the exporting module uses this array to insert buttons into the chart. Here is some pseudo code to set up events:
(function (H) {
Highcharts.Chart.prototype.callbacks.push(function (chart) {
// A DOM element, e.g. chart, container, document,
var element = chart.container;
// DOM event type: mousedown, touchstart, etc
var eventName = 'mousedown';
// We can call fireEvent to fire a new event
// defined in this plugin
fireEvent(element, newEvent, evtArgs,
function(args) {
....
});
// Plugin event
function handler(e) {
// Plugin code
...
}
// Bind specific event to the defined handler
Highcharts.addEvent(element, eventName, handler);
});
})(Highcharts);
Highcharts has two event-related methods: addEvent and fireEvent. The former method is to bind an event to a chart element with a handler, whereas fireEvent triggers an event on an element.
The preceding code basically creates an anonymous function that organizes all the event(s) setup, such as defining the handler(s) and binding them to elements. The function must accept chart as the only parameter. Finally, we append the function into thecallbacks array. The function will be automatically executed once the chart is fully rendered.
Summary
In this chapter, we visited the Highcharts online export server and the new cloud service. We took a short tour of the cloud service and demonstrated how we can create a chart online without any prior knowledge of JavaScript and Highcharts. Another topic covered was the Highcharts plugin in which we experimented with two plugins: regression and draggable data points. We then demonstrated how to modify one plugin to make both plugins work together to provide a new user experience.
So far, all my knowledge and experience of Highcharts is enclosed in this journal. To achieve two editions in 3 years has been much tougher than I expected. Hence, my journey with Highcharts has come to an end, and I can put my time back to where it should always be, family. My utmost gratitude to you for purchasing and reading this book. My goal was to illustrate to you how dynamic and impressive Highcharts can be, and I hope I have achieved this and ended this book on a high note.
All materials on the site are licensed Creative Commons Attribution-Sharealike 3.0 Unported CC BY-SA 3.0 & GNU Free Documentation License (GFDL)
If you are the copyright holder of any material contained on our site and intend to remove it, please contact our site administrator for approval.
© 2016-2026 All site design rights belong to S.Y.A.