Learning Highcharts 4 (2015)
Chapter 14. Server-side Highcharts
The first edition of Learning Highcharts covered a number of approaches to run Highcharts on the server side. Since then, there has been significant development in this area. It turns out that Highcharts adopts PhantomJS (the headless webkit) for the server solution and PhantomJS/Batik for the server implementation in Java. We will also explore how we can create our own Highcharts server process using PhantomJS and how to use the official server-side script released by Highcharts.
In this chapter, we will cover the following topics:
· Why we want to run Highcharts on the server side
· Why PhantomJS and Batik are adopted by Highcharts
· The basics of PhantomJS and Batik
· Creating our own PhantomJS script to export charts
· How to use the Highcharts server-side script in both command-line and server modes
Running Highcharts on the server side
The main reason for running Highcharts on the server side is to allow the client-based graphing application to be automated and accessible on the server side. In some cases, it is desirable to produce graphs at the frontend as well as delivering automated reports with graphs at the backend. For the sake of consistency and development costs, we would like to produce the same style of graphs at both ends. Here are other scenarios where we may want to generate graphs on the server side:
· The application is required to run a scheduled task on the server side. It generates a regular summary report with graphs (for example, the Service Level Agreement report) and automatically e-mails the report to clients or users with a managerial role.
· The nature of the data means it requires a long time to compute for a graph. Instead, users send the parameters over to the server to generate a graph. Once it is finished, the chart setup is saved, then the users are notified to see a live Highcharts chart from the precomputed JSON setup.
· The application involves a vast amount of recurring data that is only kept for a certain period, such as data trend graphs that are automatically produced and stored in an image format for your records.
Highcharts on the server side
In the first edition of this book, we mentioned a number of technologies that can be used to produce chart images purely on the server side. Within those technologies, PhantomJS is the most prominent. In a nutshell, it is a standalone program that is capable of running JavaScript on the server. Besides this, it is easy to use, has minimum setup, and is programmable and robust.
The alternative approach was to use Rhino, a Java implementation of the JavaScript engine, to run JavaScript on the server side so that Highcharts can be run on the server side to export a chart into an SVG file. Then, the SVG file is forwarded to Batik, a generic Java-based SVG toolkit, to produce an image file from SVG.
Since then, Highcharts have extensively experimented with different approaches and concluded that incorporating PhantomJS is the solution moving forward. There are a number of reasons for this decision. First, Rhino has rendering problems compared to PhantomJS, which makes PhantomJS a better choice. Moreover, PhantomJS can also export images, although it has scalability issues in rendering charts when the number of data points increases to around 1,500. ImageMagick, the image converter, was also considered, but it also has specific performance and reliability issues. For details of the findings, please see http://www.highcharts.com/component/content/article/2-articles/news/52-serverside-generated-charts#phantom_usage.
For a server-side solution required to implement in Java, Batik is a more natural choice for formatting SVG, whereas PhantomJS is launched to run Highcharts for SVG content. As for a non-Java approach, PhantomJS itself is good enough to drive the whole server-side solution.
Batik – an SVG toolkit
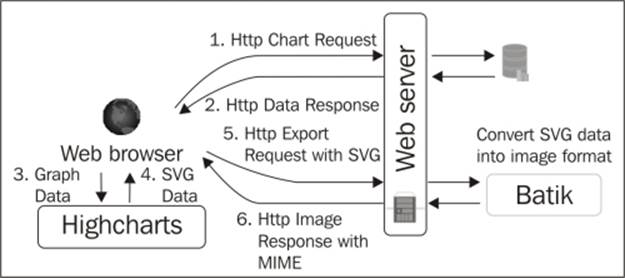
Batik is part of the Apache foundation projects, http://xmlgraphics.apache.org/batik/. Its purpose is to provide a web service to view, generate, and transform SVG data. For instance, Highcharts uses this third-party software to convert SVG data into an image format. When the user clicks on the export button, Highcharts internally forwards the chart's SVG data and the user-selected image format request to Batik.
Then, Batik receives the SVG data and transforms the data into the desired image format. The following diagram summarizes how a normal Highcharts chart uses the export service with Batik:
To install Batik, download the latest distribution from http://xmlgraphics.apache.org/batik/download.html#binary and follow the installation instructions. As for Ubuntu, simply do:
apt-get install libbatik-java
Out of the entire Batik package, we only need the image converter component, which is the batik-rasterizer.jar file. To transcode from an SVG to a PNG file, we can use the following command:
java -jar batik-rasterizer.jar chart.svg
The preceding command will convert chart.svg and create chart.png in the same directory.
PhantomJS (headless webkit)
A webkit is basically the backend engine that drives browsers such as Safari and Google Chrome. It implements almost everything in HTML5 except the browser's user interface. PhantomJS (found at http://phantomjs.org/, created and maintained by Ariya Hidayat) is a headless webkit, which means that the webkit engine can be run as a standalone program. It is useful in a number of ways, and one of them is server-side SVG rendering.
Creating a simple PhantomJS script
Although Highcharts released a PhantomJS script to export charts on the server side, it is worth understanding the concept of PhantomJS and how it works. Suppose we already have a web server and PhantomJS installed and running. To run an HTML page on PhantomJS from a command line, run the following command:
phantomjs loadPage.js
The loadPage.js page can be as simple as this:
var page = require('webpage').create();
page.onError = function(msg, trace) {
console.error(msg);
phantom.exit(1);
};
page.onConsoleMessage = function(msg) {
console.log(msg);
};
page.open('http://localhost/mychart.html', function(status) {
if (status === 'success') {
console.log('page loaded');
phantom.exit();
}
});
Inside the PhantomJS process, it first loads the webpage module and creates a page object.
Tip
This is only a short example for illustration. For a proper way of handling error messages, please refer to the PhantomJS API documentation.
The page.onError and page.onConsoleMessage methods redirect the page's error and output messages to the terminal output via console.log. Note that console.log in this instance is referring to our terminal console. If console.log is called inside a page, it will only stay within the page object life cycle and we will never see those messages unless page.onConsoleMessage is defined to redirect them.
The preceding script only opens the HTML page into a webpage object and then terminates, which is not particularly useful.
Creating our own server-side Highcharts script
Let's use PhantomJS in a slightly more advanced way. In PhantomJS, we don't need to rely on a web server to serve a page. Instead, we load a Highcharts page file locally and include the series data from another JSON file. Then, we render the result into an image file. So here is how we will run the server-side script on a command line:
phantomjs renderChart.js chart.html data.json chart.png
The chart.html page is just a simple Highcharts page that we would normally create. In this exercise, we will leave the series data as a variable, seriesData. The following shows how we structure the chart.html page:
<html>
<head>
<meta> ....
<script src='..../jquery.min.js'></script>
<script src='..../Highcharts.js'></script>
<script type='text/javascript'>
$(function () {
$(document).ready(function() {
chart = new Highcharts.Chart({
chart: {
....
},
plotOptions: {
....
},
....,
series: [{
name: 'Nasdaq',
data: seriesData
}]
});
});
});
</script>
</head>
<body>
<div id="container" ></div>
</body>
</html>
Then, data.json is just a simple JSON file containing the array of x and y series data. Here is some of the content:
[[1336728600000,2606.01],[1336730400000,2622.08],
[1336732200000,2636.03],[1336734000000,2637.78],
[1336735800000,2639.15],[1336737600000,2637.09],
....
For the PhantomJS file, renderChart.js, it is surprising how little extra code (highlighted in bold) we need to add to achieve the result:
var page = require('webpage').create(),
system = require('system'),
fs = require('fs');
// Convert temporary file with series data – data.json
var jsonData = fs.read(system.args[2]);
fs.write('/tmp/data.js', 'var seriesData = ' + jsonData + ';');
page.onError = function(msg, trace) {
console.error(msg);
phantom.exit(1);
}
page.onConsoleMessage = function(msg) {
console.log(msg);
};
// initializes the seriesData variable before loading the script
page.onInitialized = function() {
page.injectJs('/tmp/data.js');
};
// load chart.html
page.open(system.args[1], function(status) {
if (status === 'success') {
// output to chart.png
page.render(system.args[3]);
phantom.exit();
}
});
We first load the system and fs modules, which are used in this example to select command-line arguments and process file I/O on the JSON file. The script basically reads (fs.read) the content of the JSON file and converts the content into a JavaScript expression and saves (fs.write) it in a file. Then, we define the onInitialized event handler for the page object that is triggered before the URL is loaded. So, we insert (injectJs) the JavaScript expression of seriesData before the page object loads the chart.html page. Once the page is loaded, we export (page.render) the page content into an image file.
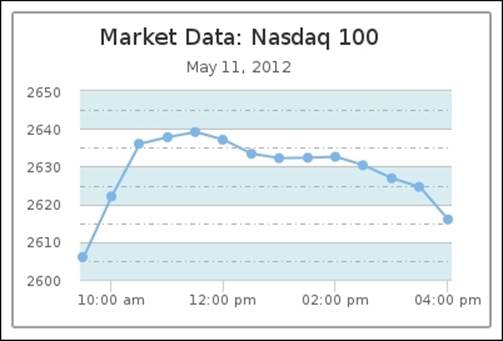
Notice that the resulting image file is not quite correct in that the line series is actually missing. However, if we observe the image more carefully, actually the line has just started being drawn (see the following screenshot):
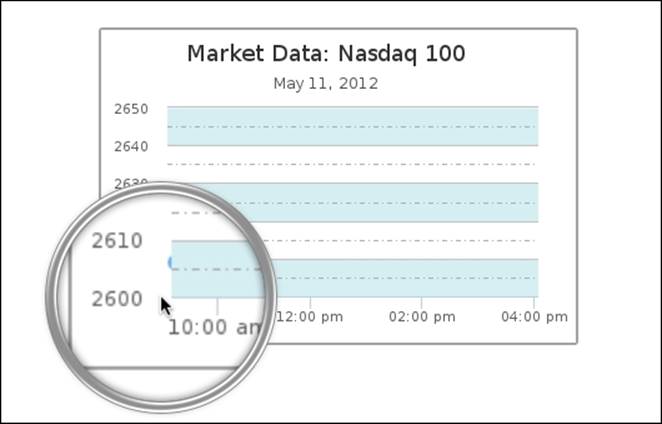
This is because of the chart default animation settings. After we turn the initial animation off by setting the plotOptions.series.animation option to false, the line series appears:
Running the Highcharts server script
So far, our script example is lacking in features and error checking functionality, and is far from perfect. Nonetheless, we can see how easy it is to create our own server-side Highcharts process to produce images. In this section, you will learn how to use the official server-side script by Highcharts, which has more features and can be used in different scenarios.
Server script usage
Since version 3, Highcharts is packaged with server-side script, highcharts_convert.js, which is located in the exporting-server/phantomjs directory. The script can be run as either a command line or as a listening server.
Tip
For a full description of usage and parameters, refer to https://github.com/highslide-software/highcharts.com/tree/master/exporting-server/phantomjs.
Running the script as a standalone command
Here is a typical command-line format for highcharts_convert.js:
phantomjs highcharts-convert.js -infile file
-outfile chart1.png | -type ( png | jpg | pdf | svg ) -tmpdir dir
[-scale num | -width pixels ] [ -constr (Highcharts | Highstocks) ]
[-callback script.js ]
The following is a list of parameters used in the preceding command:
· -infile: This is the input source for the script, which can be either a chart configuration in the JSON format (general usage) or an SVG file. The server script automatically detects the content type, and processes and exports the chart/content in the desired format.
· -outfile, -type, -tmpdir: The two ways to specify the output format are by -type or -outfile. With the -outfile parameter, the script will derive the image format from the extension name. Alternatively, -type, for example, type png, formats into a PNG image file and combines with -tmpdir to save the output file in a specific location.
· -scale, -width: There are two optional parameters to adjust the output image size, by -scale or by -width. As the name suggests, one is to adjust the size by scaling and the other is by the absolute size.
· -constr: The -constr parameter is to instruct the script whether to export the chart as a Highcharts or Highstock chart (another product for financial charts).
· -callback: The -callback parameter is to execute additional JavaScript code on the chart once it is loaded and before the chart is exported.
Let's apply the previous chart configuration file into this command line. Furthermore, we are going to superimpose a watermark, SAMPLE, on top of the chart with the callback argument.
First, we save the whole chart configuration object into a file including the series data:
{ chart: {
renderTo: 'container',
height: 250,
spacingRight: 30,
animation: false
},
. . . .
}
Then, we create a callback script with the following code to add the watermark, watermark.js:
function(chart) {
chart.renderer.text('SAMPLE', 220, 200).
attr({
rotation: -30
}).
css({
color: '#D0D0D0',
fontSize: '50px',
fontWeight: 'bold',
opacity: 0.8
}).
add();
}
Finally, we run the following command:
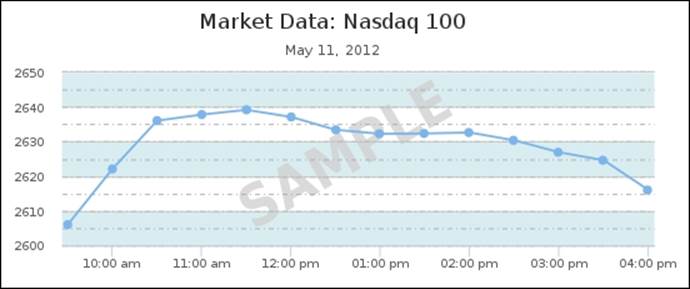
phantomjs highcharts-convert.js -infile options.json -outfile chart.png -width 550 -callback watermark.js
The command generates the output as it runs:
Highcharts.options.parsed
Highcharts.cb.parsed
Highcharts.customCode.parsed
/tmp/chart.png
It also produces the following screenshot:
Running the script as a listening server
To run the script as a server listening for HTTP requests, we launch the script with the following command:
phantomjs highcharts-convert.js -host address -port num
-type ( png | svg | jpg | pdf )
Let's start a Highcharts export server with the following command:
phantomjs highcharts-convert.js -host 127.0.0.1 -port 9413 -type png
This starts a server listening only to local incoming connections on port 9413, and the following message outputs to the screen:
OK, PhantomJS is ready.
Passing options to the listening server
Once the server process is ready, we can start sending POST requests embedded within the Highcharts configuration data. The Highcharts options used inside the request are the same ones we used in the command line. Let's reuse the configuration from the last exercise and pack them into a POST request.
First, we need to "stringify" the whole chart configuration as a value for the infile option. Next, we treat the callback method in the same manner. Then, we put the rest of the options into one JSON format and save it in a file called post.json:
{ "infile" : " { chart: { .... }, series { .... } } " ,
"callback" : "function(chart) { .... } ",
"scale" : 1.2
}
The next task is to package this data into a POST query. Since the purpose of this chapter is the server-side process, we should operate in a command-line style. Hence, we use the curl utility to create a POST request. The following command can do the job:
curl -X POST -H "Content-Type: application/json" -d @post.json http://localhost:9413/ | base64 -d > /tmp/chart.png
The preceding curl command is to create a POST request with the JSON content type. The -d @ argument notifies the curl command about which file contains the POST data. Since HTTP is an ASCII protocol, the response of the result binary image data is returned in base-64 encoding. Therefore, we need to pipe the POST response data to another utility, base64, to decode the data and write it to a file.
Summary
In this chapter, we described the purpose of running Highcharts on the server side and you learned which technology Highcharts has opted to use on a server. You learned the basics of PhantomJS and the role of Batik. You extended your understanding of PhantomJS to create your own server-side script for Highcharts. Besides that, we experimented with how to run the official PhantomJS script released by Highcharts in both single command-line and server mode.
In the next chapter, we will take a glimpse at which online services Highcharts offer and explore some of the Highcharts plugins.
All materials on the site are licensed Creative Commons Attribution-Sharealike 3.0 Unported CC BY-SA 3.0 & GNU Free Documentation License (GFDL)
If you are the copyright holder of any material contained on our site and intend to remove it, please contact our site administrator for approval.
© 2016-2026 All site design rights belong to S.Y.A.