Using JMP 12 (2015)
Chapter 6. Reshape Data
Create Subsets, Sort Data, and More
This chapter covers the following tasks that you can perform on JMP data:
•create a new data table from a subset of rows and columns
•sort by any number of columns
•stack multiple columns into a single column
•split a column into two or more columns
•transpose rows and columns
•concatenate multiple tables end to end
•join two tables side by side
•update columns in a table with values from another table
•anonymize the data
Figure 6.1 Creating a Subset Data Table from a Report

Contents
Create a Subset Data Table
Stratified Subsets
Create a Subset Data Table from a Report
Sort Data Tables
Stack Columns
Example of Stacking into One Column
Example of Stacking into More than One Column
Split Columns
Examples of Splitting Columns
Transpose Rows and Columns
Examples of Transposing Rows and Columns
Concatenate Data Tables
Example of Concatenating Data Tables
Example of Concatenating Data Tables and Table Variables
Join Data Tables
Examples of Joining Data Tables
Update Data Tables
Example of Updating a Data Table
Anonymize Data
Create a Subset Data Table
You can produce a new data table that is a subset of all rows and columns, only highlighted rows and columns, or randomly selected rows from the active data table.
To create a subset
1.Select Tables > Subset.
Figure 6.2 The Subset Window
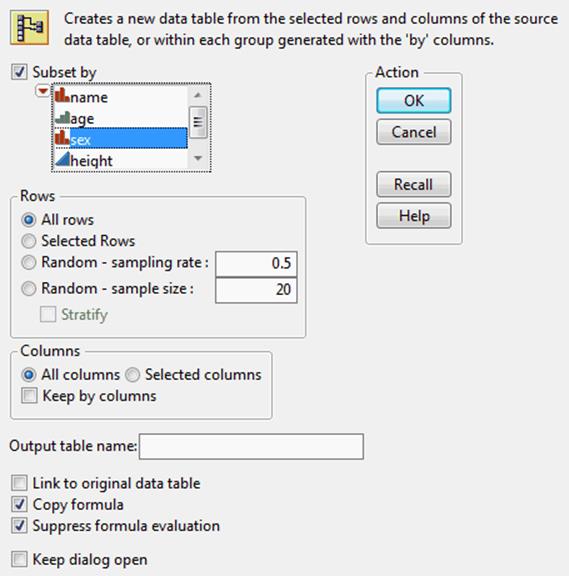
2.Specify the content that you want to subset. Select any combination of the following:
‒Subset by (the levels within selected columns)
‒Rows (all, selected, or random)
‒Columns (all or selected)
For descriptions of these options, see Table 6.1.
3.Customize your subset table further using the additional options. SeeTable 6.1.
4.ClickOKto create the subset table.
|
Table 6.1 Description of the Subset Window |
|
|
Subset by |
To subset by the levels of a column, select Subset by and select the columns that you want to categorize for the subset. Consider the fact that many new data tables might be created. A new data table appears for each level of the column that you specified in the Subset window. |
|
All Rows |
Creates a subset table that contains all rows from the active table. |
|
Selected Rows |
Creates a subset table that contains only the selected rows from the active table. |
|
Random - sampling rate |
Creates a subset table whose data is a random proportion of the active data table. Enter the proportion of the sample that you want in the text box. For example, if you want a random 50% of the data to be included in the new table, enter 0.5 in the text box. |
|
Random - sample size |
Creates a subset table whose data is a random sample of the active data table. Enter the size of the sample that you want in the text box. For example, if you want 16 random rows to be included in the new table, enter 16 into the text box. If you select a random sample that is the entire source table, the result is a random shuffle of the rows of the data table. If you specify columns to stratify, the result is a random shuffle of each of the rows for each group. See “Stratified Subsets”. |
|
All columns |
Creates a subset table that contains all columns from the active table. |
|
Selected columns |
Creates a subset table that contains only the selected columns from the active table. |
|
Keep by columns |
Retains the column that you subsetted by in the output data tables. |
|
Output table name |
To give a name to the subset table, type a name in the box beside Output table name. |
|
Link to original data table |
To keep the subset table linked to the original table, click the box beside Link to original data table. When you change values in one table, the other table is updated. |
|
Copy formula |
To include formulas from the original table in the output columns, click the box beside Copy formula. Include all columns needed for the calculation of the formula. |
|
Suppress formula evaluation |
To prevent JMP from evaluating columns’ formulas when the new table is created, click the box beside Suppress formula evaluation. |
|
Keep dialog open |
To keep this window open after clicking OK, check the box beside Keep dialog open. |
Stratified Subsets
If you specify a sample size and add stratification columns, the sample size represents the size per stratum, rather than the size of the whole subset.
Figure 6.3 Stratified Subsets
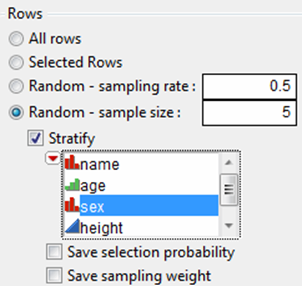
For stratified random samples with a specified sample size, two columns can be saved: Selection Probability and Sampling Weight. Check the corresponding check box to save these columns.
Create a Subset Data Table from a Report
These two methods produce linked subsets of a data table.
Use a Histogram
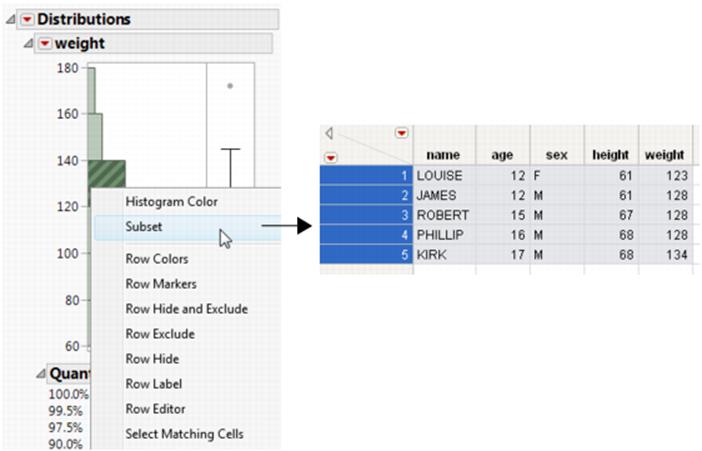
Once you have produced output that contains a histogram (by selecting Analyze > Distribution), you can use the histogram to create a new data table. The new data table contains the data in the histogram’s highlighted bars.
To create a subset, double-click a highlighted bar. Or, right-click anywhere in the histogram and select Subset from the menu. The subset table appears, as shown in Figure 6.4.
Figure 6.4 Subset Created from a Histogram
Using a Pareto Plot
Once you have produced output that contains a Pareto Plot (by selecting Analyze > Quality and Process > Pareto Plot), you can use the Pareto Plot to create a new data table. The new data table contains the data in the Pareto Plot’s highlighted bars. To create a subset, double-click a highlighted bar.
Sort Data Tables
You can sort a JMP data table by columns in either ascending or descending order. By default, columns sort in ascending order. You can either create a new table that contains the sorted values, or you can replace the original table with the sorted table.
If columns contain value labels, sorting is based on the actual data values, not the value labels. (See “Value Labels” in the “The Column Info Window” chapter.) However, the value labels are displayed in the sorted data table.
If your sorted column uses either the Value Ordering property or the List Check property, the column is sorted according to that order.
Example of Sorting Data Tables
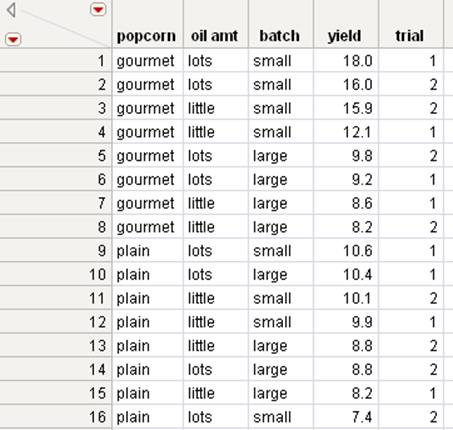
1.Open the Popcorn.jmp sample data table.
2.SelectTables > Sort.
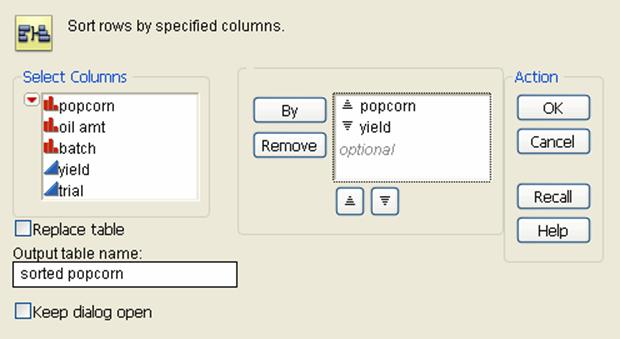
Figure 6.5 The Sort Window
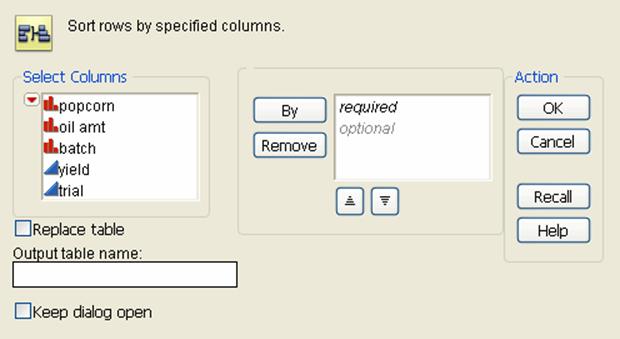
3.Highlight the names of the columns that you want to sort by. For this example, selectpopcornandyield.
4.ClickByto add the columns to the sort list.
The columns that you add to the list establish the order of precedence for sorting. The first column in the list is the major sort field. Each variable thereafter is sorted within the previous variable in the sort list. You can drag and drop within the By list to change the sort order.
5.Customize your sort further using the additional options. For this example, highlightyieldand click the descending button.
For a complete list of options, see Table 6.2.
6.Type a name for the new sorted table in the box besideOutput table name. For this example, type sorted popcorn.
Figure 6.6 Completed Sort Window
7.ClickOK.
Figure 6.7 Sorted in Ascending and Descending Order
|
Table 6.2 Description of the Sort Window |
|
|
Select Columns Filter Menu |
Contains options to search and filter through columns. See “Columns Filter Menu” in the “JMP Platforms” chapter. |
|
Replace Table |
To replace the original data table with the sorted table instead of creating a new table with the sorted values, click the box beside Replace Table. This option is not available if there are any open report windows generated from the original table. |
|
Output table name |
(Optional) To give a name to the sorted table, type a name in the box beside Output table name. |
|
Keep dialog open |
To keep this window open after clicking OK, check the box beside Keep dialog open. |
|
By |
Adds the columns that you want to sort by. The columns that you add to the list establish the order of precedence for sorting. The first column in the list is the major sort field. Each variable thereafter is sorted within the previous variable in the sort list. |
|
Remove |
Removes any highlighted columns. |
|
ascending and descending buttons ( |
To change the list order (ascending or descending) of the values for the grouping variables, in the By variable list, select a variable and click the appropriate ascending or descending button. The icon beside the variable changes to indicate the sorting order. |
Stack Columns
You can rearrange your data table by stacking two or more columns into a single new column, preserving the values from the other columns. Or, you can stack a set of columns into multiple groups. The various ways that you can stack columns are explained in Table 6.3.
To stack columns:
1.Select Tables > Stack.
Figure 6.8 Stack Window
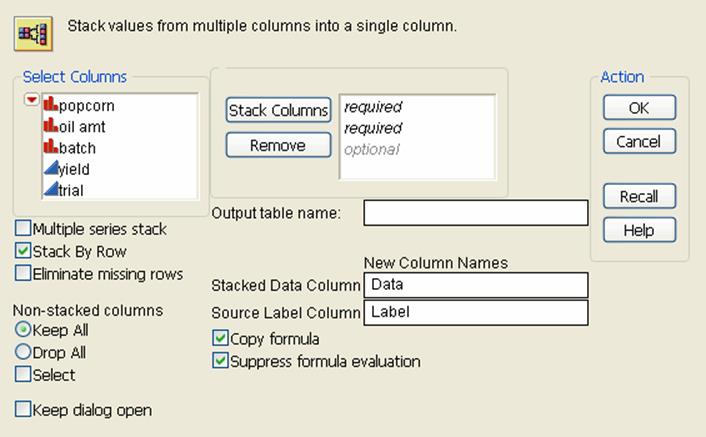
2.Highlight the names of the columns that you want to stack and clickStack Columns.
3.Customize your stacking further using the additional options. SeeTable 6.3.
4.ClickOK.
|
Table 6.3 Description of the Stack Window |
|
|
Select Columns Filter Menu |
Contains options to search and filter through columns. See “Columns Filter Menu” in the “JMP Platforms” chapter. |
|
Multiple series stack |
To stack selected columns into two or more columns, check the box beside Multiple series stack. Specify the number of columns into which you want the selected columns to be stacked by entering the number into the Number of Series box. This box appears when you check the box beside Multiple series stack. Select the Contiguous option if the series consists of adjacent columns. See “Example of Stacking into More than One Column”. Note: The order in which you add columns to the box on the right determines the group to which they belong. |
|
Stack by Row |
Leaving Stack by Row unchecked stacks one column underneath another. Checking it stacks columns by rows. |
|
Eliminate missing rows |
To eliminate missing data from the new table, check the box beside Eliminate missing rows. If Stack by Rows is checked also, only rows with all data missing are eliminated. |
|
Non-stacked columns |
Includes or drops non-stacked columns from the new data table. Select one of these options: Keep All select this option if you want the new table to contain all of the non-stacked columns from the original table. Drop All select this option if you want to include only the stacked columns in the new table, and you do not want to include any non-stacked columns. Select Choose the non-stacked columns that you want to include or drop in the new table. |
|
Keep dialog open |
To keep this window open after clicking OK, check the box beside Keep dialog open. |
|
Stack Columns |
Adds the columns that you want to stack. |
|
Remove |
Removes any highlighted columns. |
|
Output table name |
(Optional) To name the new table, type a name in the box beside Output table name. |
|
Stacked Data Column |
To assign a name to the column that will contain the data for the stacked columns, enter a name in the Stacked Data Column box. Leave the box empty if you do not want this column to appear in the new table. |
|
Source Label Column |
To assign a name to the column that will contain the original table’s column names, enter the name in the Source Label Column box. The default name is Label. Leave the box empty if you do not want this column to appear in the new table. |
|
Copy formula |
To include formulas from the original table in the output columns, click the box beside Copy formula. |
|
Suppress formula evaluation |
To prevent JMP from evaluating columns’ formulas when the new table is created, check the box beside Suppress formula evaluation. |
Example of Stacking into One Column
A researcher has two columns in their data table representing yield, and they want to stack the two columns into a single column. (This new single column would be called Data by default.)
1.Open the Popcorn Trials.jmp sample data table.
2.SelectTables > Stack.
3.Selectyield1andyield2and clickStack Columns.
4.ClickOK.
Figure 6.9 Stacked Data Table
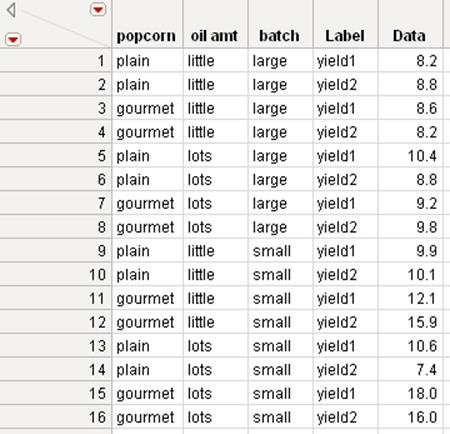
The Label column represents the Source Label Column that identifies the source of the data. Its values are the column names in the original table from which the stacked values originated.
Example of Stacking into More than One Column
Suppose that a researcher has data on blood pressure readings. The readings were taken over three days: Monday, Wednesday, and Friday. Three readings were taken each day, at 8am, 12pm, and 6pm.
1.Open the Blood Pressure.jmp sample data table.
Each BP (blood pressure) column is delineated according to the date and time. The BP 8M column corresponds to readings that were taken at 8am on Monday. The BP 12W column corresponds to readings that were taken on 12pm on Wednesday, and so on. The researcher wants to stack all of the blood pressure columns into three columns that correspond to each day: Monday, Wednesday, and Friday.
2.SelectTables > Stack.
3.Select all of the BP readings and clickStack Columns.
The order of the columns reflects the way that the columns in the series should be grouped.
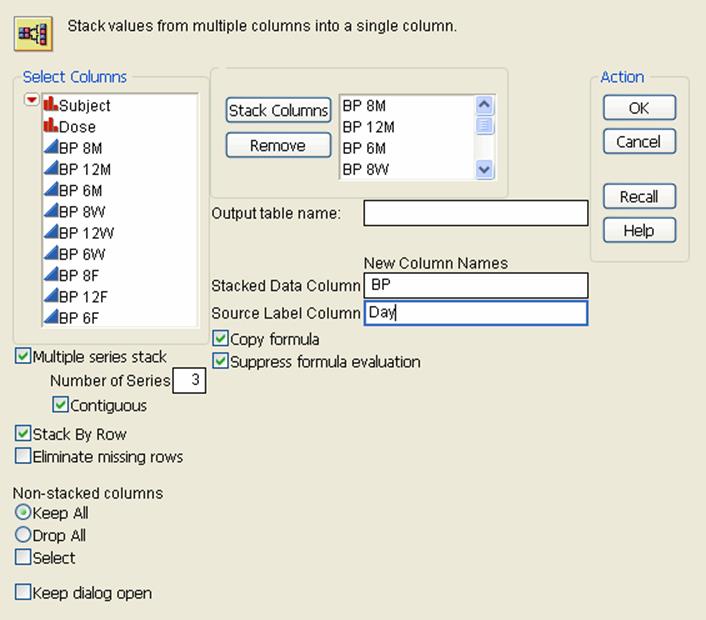
4.SelectMultiple series stack.
5.Next toNumber of Series, type 3.
6.Because you want to stack the columns vertically, selectContiguous.
7.Rename theStacked Data ColumnfromDatatoBP(for blood pressure).
8.Rename theSource Label ColumnfromLabeltoDay.
Figure 6.10 Completed Stack Window
9.ClickOK.
Figure 6.11 Stacked Data Table
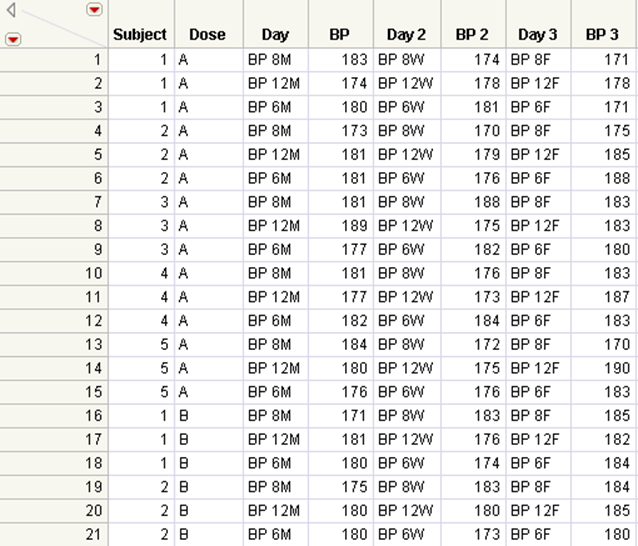
In the stacked data table, note the following:
•The first Day column represents Monday.
•The Day 2 column represents Wednesday.
•The Day 3 column represents Friday.
Split Columns
You can create a new data table from the active table by splitting one column into several new columns. This column is split according to the values found in another column, referred to as the Split By column. You can also split columns according to the values of one or more grouping variables.
To split columns:
1.Select Tables > Split.
Figure 6.12 Split Window
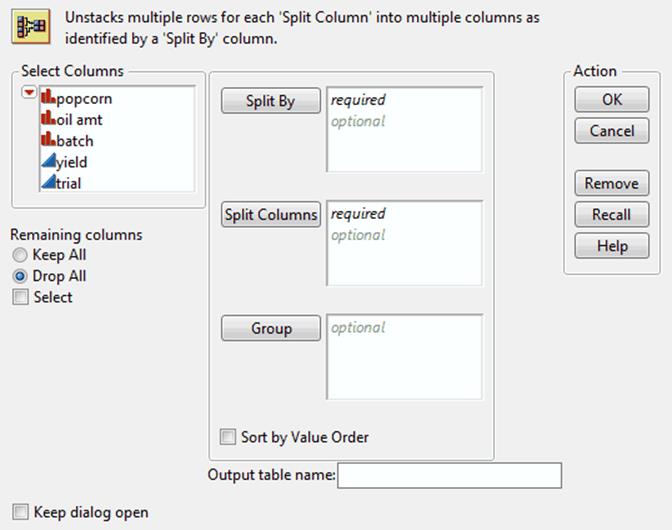
2.Highlight the names of the column or columns that you want to split and clickSplit Columns.
3.Highlight a column whose values you want to use as the basis for splitting the column.
4.ClickSplit By.
5.Customize your splitting further using the additional options. SeeTable 6.4.
6.ClickSplit.
|
Table 6.4 Description of the Split Window |
|
|
Select Columns Filter Menu |
Contains options to search and filter through columns. See “Columns Filter Menu” in the “JMP Platforms” chapter. |
|
Keep All |
To include all columns in the new table, click the Keep All option in the Remaining Columns area. |
|
Drop All |
To include only columns used in the split in the new table, click the Drop All option in the Remaining Columns area. |
|
Select |
To select which columns to keep in the new table, click the Select option in the Remaining Columns area. Then select which columns to keep in the new table. |
|
Keep dialog open |
To keep this window open after clicking OK, check the box beside Keep dialog open. |
|
Split By |
Adds the column whose values you want to use as the new column names, and as the basis for splitting the column. |
|
Split Columns |
Adds the column or columns that you want to split. |
|
Group |
Specify a Group variable when you want your data to be split within each group of the selected variable. Each group results in a row in the output table. Note: You must also specify the required variables, Split By, and Split Columns. If your grouping variable contains unequal groups, or if your grouping variable is not grouped in order (is random), then you must specify a Group variable. The Group variable ensures that your data is restructured properly. |
|
Sort by Value Order |
Sorts the order of the output columns by a Value Ordering property. Before using this option, you must have a Value Ordering property assigned to the column that you want to split by. |
|
Output table name |
(Optional) To assign a name to the new table, enter the name in the box beside Output table name. |
|
Copy formula |
(Only appears if there is a formula in the data table) To include formulas from the original table in the output columns, click the box beside Copy formula. |
|
Suppress formula evaluation |
(Only appears if there is a formula in the data table) To prevent JMP from evaluating columns’ formulas when the new table is created, click the box beside Suppress formula evaluation. |
Examples of Splitting Columns
This section contains two examples using the Split command:
•In the first example, one column is split by a second column. See “Split a Column: Basic Example”.
•The second example uses a Group variable. See “Split a Column: Grouping Rows Example”.
Split a Column: Basic Example
In the Popcorn.jmp data table, the data in the trial column shows that there are two trials, 1 and 2. In this example, split the yield column into two new columns: one for trial 1 and one for trial 2. Proceed as follows:
1.Open the Popcorn.jmp sample data table.
2.SelectTables > Split.
3.Select theyieldcolumn and clickSplit Columns.
4.Select thetrialcolumn and clickSplit By.
5.UnderRemaining columns, selectKeep All.
The default is Drop All, which omits any columns that are not in the Split By, Split Columns, or Group fields. Selecting Keep All includes these columns in the new table.
6.(Optional) TypeYield column split by Trial columnin theOutput table namefield.
7.ClickOK.
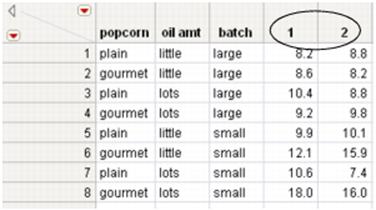
A new data table is created. See Figure 6.13. Notice the following:
‒The yield and trial columns are gone.
‒The data table has two new columns, named after the unique values (1 and 2) from the original trial column.
‒The values from the original yield column are now split into the new columns named 1 and 2.
‒The columns other than trial and yield are exactly the same as they were in the original table.
8.(Optional) Rename the new columns to give them meaningful names. For example, rename 1 toyield (trial 1)and rename 2 toyield (trial 2).
Figure 6.13 New Table Created by Splitting yield Column by trial Column
Split a Column: Grouping Rows Example
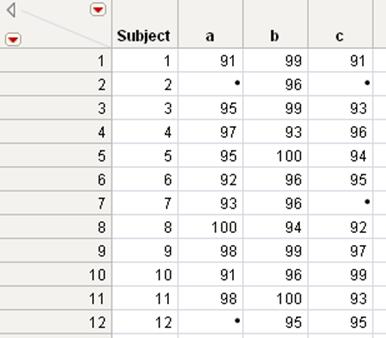
The Drug Measurements.jmp sample data table contains measurements of three different drugs (a, b, and c) administered to 12 different subjects. You want to split the measurement into different columns, one for each drug type. You also want to group the measurements by subject.
1.Open the Drug Measurements.jmp sample data table.
2.SelectTables > Split.
3.SelectDrug Typeand clickSplit By.
4.SelectMeasurementand clickSplit Columns.
Notice that the Subject variable contains unequal groups. Most of the subjects were given all three drugs, but subject 2 was given only one drug, and subjects 7 and 12 were given only two drugs. In this situation, to ensure that the correct measurements are associated with the correct subject, specify Subject as the Group variable.
5.SelectSubjectand clickGroup.
6.ClickOK.
Figure 6.14 Drug Measurements.jmp Split by a Grouping Variable
You can see that the appropriate missing values appear for subjects 2, 7, and 12.
Transpose Rows and Columns
You can create a new JMP table that is a transposed version of the active data table. The columns of the active table are the rows of the new table, and its rows are the new table’s columns.
When you transpose columns, you do the following:
•Select the columns to be transposed.
•Specify a “label” column, from which the new columns get their names (optional).
•Specify “by” columns, which tells JMP to transpose data within groups (optional).
Note: Columns that you want to transpose must have the same data type. Also, if columns contain value labels, transposing uses the actual data values, not the value labels. (See “Value Labels” in the “The Column Info Window” chapter.)
To transpose rows and columns
1.Open a data table that contains the rows and columns that you want to transpose.
2.SelectTables > Transpose.
Figure 6.15 Transpose Window
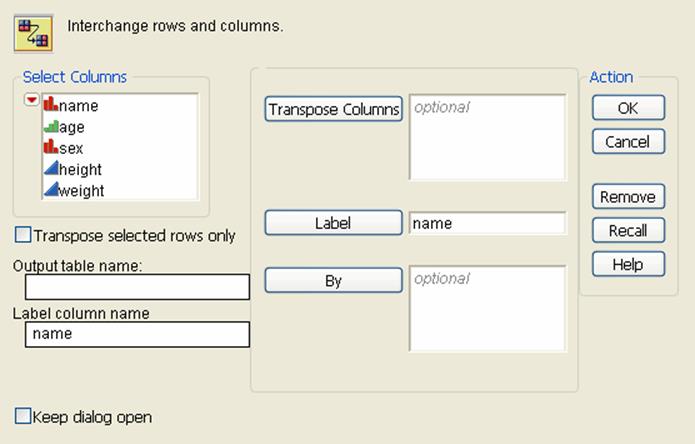
3.Highlight the column name(s) you want to transpose in theSelect Columnsbox on the left.
4.ClickTranspose Columns.
5.(Optional) Customize your transposed table further using the additional options. SeeTable 6.5.
6.ClickOK.
|
Table 6.5 Description of the Transpose Window |
|
|
Select Columns Filter Menu |
Contains options to search and filter through columns. See “Columns Filter Menu” in the “JMP Platforms” chapter. |
|
Transpose selected rows only |
To transpose only rows that are currently highlighted in the active table, click the box beside Transpose selected rows only. |
|
Output table name |
(Optional) To name the subset table, type a name in the box beside Output table name. |
|
Label column name |
(Applicable only if you have specified a Label column.) Specify an alternative name for the Label column. Otherwise, the default column name is Label. |
|
Keep dialog open |
To keep this window open after clicking OK, check the box beside Keep dialog open. |
|
Transpose Columns |
Adds the columns that you want to transpose. |
|
Label |
To use the data from a column in the original table as the column names in the new table: 1.Highlight a column from the Select Columns box on the left. 2.ClickLabel. The column name appears in theLabelbox. The default column name is Label. You can specify an alternative name for the column using the Label column name option. Only one column is created for each distinct value in the label column. Therefore, if there are duplicate values in the label column, JMP creates only one column for the duplicated value using the value from the last duplicated row. |
|
By |
To organize the transposed columns into groups based on the columns that you put into the By box: 1.Highlight the column name(s) in the Select Columns box whose values you want to see as a group. 2.ClickBy. |
Table 6.6 describes the rules that apply to transposing.
|
Table 6.6 Rules for Transposing |
|
|
If |
Then |
|
The original table has columns but no rows |
The new table contains one column that lists those column names. |
|
The original table has one column and it is assigned to Label |
Its values become the column names in the transposed table. |
|
The original table has multiple columns and contains a label column |
JMP automatically inserts the label column into the Label box when the window appears. You can remove this column if you do not want it to appear. |
|
There is no label column in the original table |
The column names in the transposed table are Row 1, Row 2, …, Row n where n is the number of rows in the original table. |
Examples of Transposing Rows and Columns
This section contains three examples: a simple example of transposing, an example using the Label option, and an example using a By group.
Simple Example of Transposing
1.Open the Materials1.jmp sample data table.
2.SelectTables > Transpose.
3.Selectplastic,tin, andgoldand clickTranspose Columns.
4.ClickOK.
Figure 6.16 Simple Transposed Table
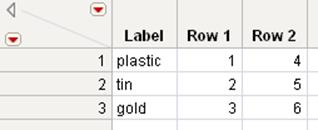
The original table in Figure 6.16 has two rows and three continuous columns called plastic, tin, and gold. The transposed table has a row for each of the three columns in the original table, and columns named Row 1 and Row 2 for the original table’s rows. The additional column calledLabel has the column names (plastic, tin, and gold) from the original table as values.
Example Using the Label Option
1.Open the Materials2.jmp sample data table.
2.SelectTables > Transpose.
3.Selectplastic,tin, andgoldand clickTranspose Columns.
4.Selectitemand clickLabel.
5.ClickOK.
Figure 6.17 Transpose with a Label
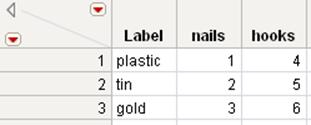
The values from the item column in the original table are used as column labels in the transposed table.
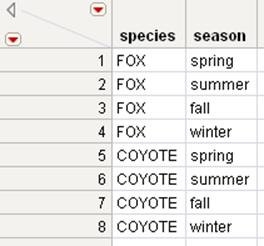
Example Using a By Group
1.Open the Animals Subset.jmp sample data table.
2.SelectTables > Transpose.
3.Selectsubjectandmilesand clickTranspose Columns.
4.Selectseasonand clickLabel.
5.Selectspeciesand clickBy.
6.ClickOK.
Figure 6.18 Transpose Using a By Group
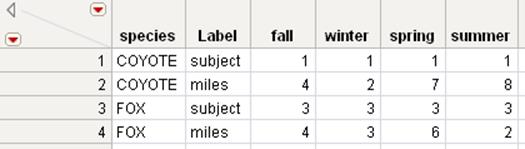
The transposed table contains values that have been transposed in groups.
Concatenate Data Tables
When you concatenate data tables in JMP, you combine rows from two or more data tables. You can create a new data table or you can append rows to the first data table. If a column name is the same in the data tables that you want to concatenate, then the column in the new data table lists the values from all of the data tables in the order of concatenation. If the two original data tables have columns with different names, those columns are included in the new data table showing missing values.
To concatenate two data tables with the same column names:
1.Select Tables > Concatenate.
Figure 6.19 Concatenate Window
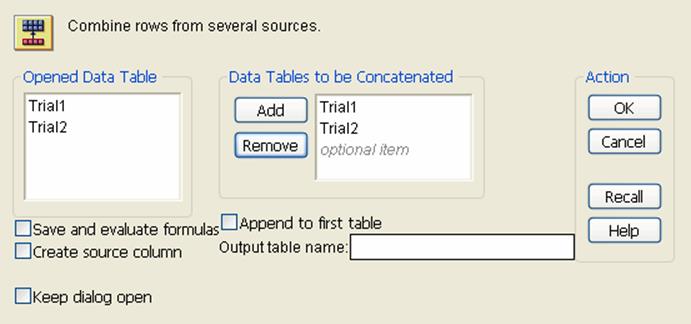
2.Highlight the names of the data tables that you would like to combine, and clickAdd.
You can concatenate as many data tables as you choose, and you can also add the same data tables multiple times. The number of rows in the new data tables is the sum of the number of rows in all the data tables.
3.(Optional) Click theSave and evaluate formulaschoice to request that JMP include all formulas.
If you do not select this option, no formulas are included in the new data table.
Note: If columns with the same name have different formulas, then the formula from the first data table is saved in the concatenated data table.
4.(Optional) Click theCreate source columnchoice to add a column calledSource Tableto the new data table.
This column identifies the name of the source data table in the corresponding rows.
5.(Optional) Select theAppend to first tablechoice to append rows to the data table listed first in theData Tables to be Concatenatedfield instead of creating a new data table.
6.(Optional) Type a name for the new data table in theOutput table namefield.
If you do not type a name, JMP names the data table Untitled# (for example, Untitled1). The Output table name field is not available if you selected the Append to first table choice.
7.ClickOK.
Example of Concatenating Data Tables
Suppose you want to concatenate two data tables (Trial1 and Trial2) into a new data table.
1.Open the Trial1.jmp and Trial2.jmp sample data tables.
2.From theTrial1.jmptable, selectTables > Concatenate.
3.In theOpened Data Tablelist, selectTrial2and clickAdd.
4.ClickOK.
The data tables combine into a new concatenated table with all of the rows from the first data table followed by all of the rows from the second data table. See Figure 6.20.
Figure 6.20 Result of Concatenating Two Data Tables
Concatenated data tables always have a column for every column name found in the original data tables. However, if the column names do not match exactly, they are not merged. For example, if the yield column was instead named yield1 and yield2, a separate column would be created for each in the concatenated data table.
When you concatenate two or more data tables containing table variables, separate columns are created for each table variable. This ensures that important distinctions are not lost when concatenating data tables.
Note: Columns are not created for table variables that begin with the name Notes.
Example of Concatenating Data Tables and Table Variables
For example, suppose that two cancer trials were conducted at two different hospitals. One of the trials’ data is in the Cancer1.jmp data table, and the other trial’s data is in the Cancer2.jmp data table.
Consolidate the data and the variables into one table, as follows:
1.Open the Cancer1.jmp and Cancer2.jmp sample data tables.
Notice that there are two distinct table variables: Dosage Amount and Location. In the concatenated table, columns will be created for these two table variables.
2.From theCancer1.jmpdata table, selectTables > Concatenate.
3.SelectCancer2and clickAdd.
4.ClickOK.
Figure 6.21 Data and Variables Concatenated
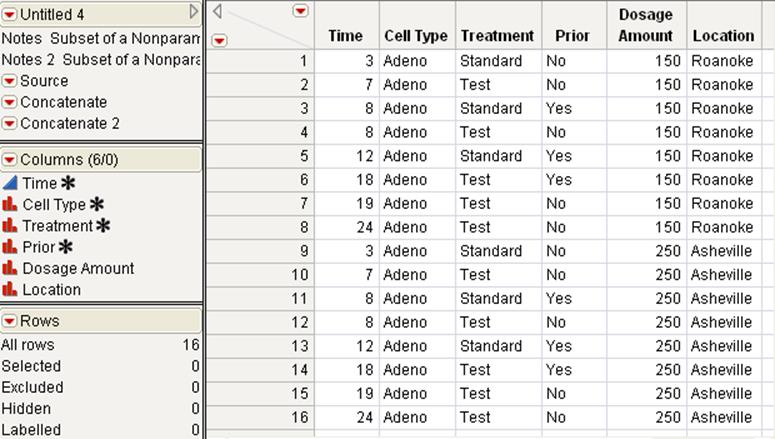
The data and the variables are concatenated. The variables appear as columns in the concatenated table. The notes from each data table are added to the new data table as table variables.
Join Data Tables
You can combine two data tables into one new table by selecting Tables > Join. For an overall description of how to join two data tables, see “To join two data tables into a new data table”. Tables can be joined in three different ways:
•By combining them according to row number. See “Example of Joining by Row Number”.
•In a Cartesian fashion, where you form a new table consisting of all possible combinations of the rows from two original tables. See “Examples of a Cartesian Join”.
•By matching the values in one or more columns that exist in both data tables, or in a single data table. See “Examples of Joining by Matching Columns”.
To join two data tables into a new data table
1.Open the two data tables that you want to join.
2.SelectTables > Join.
In the window that appears, the names of all open tables appear below Join...with, as shown in Figure 6.22.
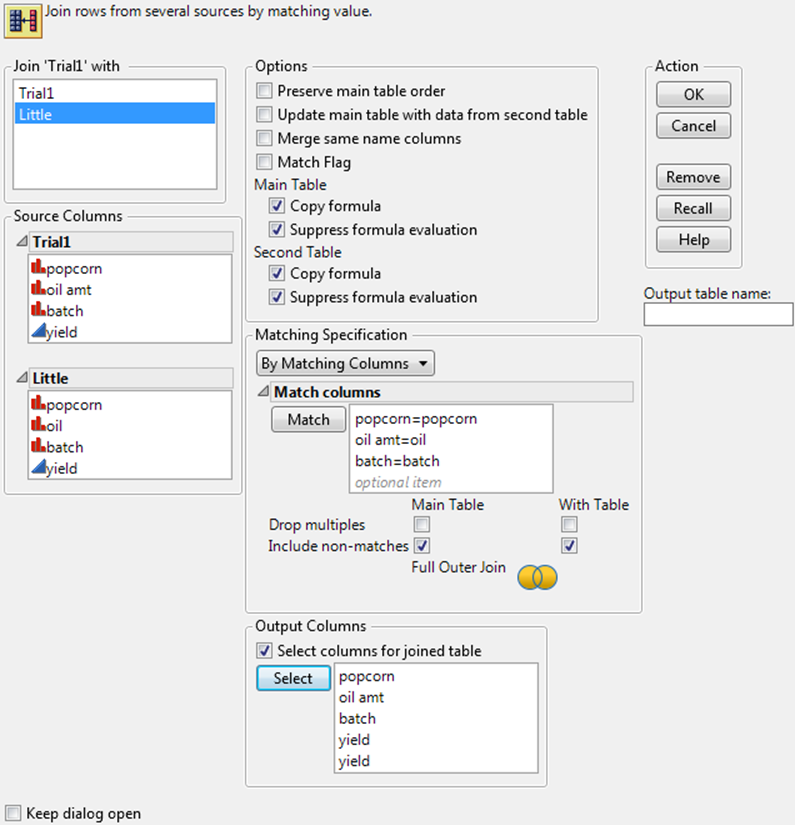
Figure 6.22 The Join Window
3.In theJoin...withbox, select the table to join with the active table.
4.From theMatching Specificationarea, select the option that specifies how to join the tables.
5.Type the name of the new table in the text box besideOutput table name.
6.(Optional) Customize the join procedure further using the additional options. SeeTable 6.7.
7.ClickOKto create the joined data table.
|
Table 6.7 Description of the Join Window |
|
|
Keep dialog open |
To keep this window open after clicking OK, check the box beside Keep dialog open. |
|
Preserve main table order |
Maintains the order of the original data table in the joined table, instead of sorting by the matching columns. |
|
Update main table with data from second table |
When Update main table with data from second table is checked, column data from the second table change the data of the same name columns in the original table. Note the following: •JMP does not replace data with missing values. •The output table uses the same columns as the original table. Thus, when you use Update main table with data from second table, Select Columns for joined table is not applicable. •The Update main table with data from second table option is available only when joining by row number or by matching columns. |
|
Merge same name columns |
Click the box beside Merge same name columns if you want the data from the second table to replace the data of the same name columns in the original table. Note that missing values in the first table are replaced by nonmissing values in the second. If you are matching by column, Match Flag is selected when you select Merge same name columns. The new joined table contains a nominal column named Match Flag: •If a one (1) appears in this column, the data originated from the first (active) table. •If a two (2) appears in this column, the data originated from the second table. •If a three (3) appears in this column, the data was found in both the first and second tables. |
|
Match flag |
Deselect this option to omit the Match Flag column from the joined data table when you are matching by column. |
|
Copy formula (Main Table and Second Table) |
Click the box beside Copy formula to include formulas from the main table and/or the second table in the output columns. |
|
Suppress formula evaluation (Main Table and Second Table) |
To prevent JMP from evaluating columns’ formulas during the creation of the new table, click the box beside Suppress formula evaluation for the main table and/or the second table. |
|
By Matching Columns |
To join rows, select columns in both tables whose values and data types match. You should: 1.Highlight a column name from each list in the Source Columns area. The first highlighted column in the top list pairs with the first highlighted column in the bottom list, the second columns are paired, and so on. Rows join only if values and data types match for all the column pairs. 2.ClickMatch. The selected pair of columns appears in theMatch columnsbox. Matching columns do not have to have the same names and do not have to be in the same relative column position in both tables. 3.(Optional) To only include the first match found, check the boxes associated withDrop multiplesin both tables. Only the first match found is written to the new table. If you specify this option for one table, the first match value is joined with all matches in the other table. If you do not check the boxes associated withDrop multiplesin either table, a Cartesian join is performed within each group of matching column values. 4.(Optional) To include all rows from the data table, even when there is no matching value, check the boxes associated withInclude non-matches. You can specify this option for either or both data tables being joined. |
|
By Row Number |
Joins the two tables side by side. |
|
Cartesian Join |
Joins two tables using a Cartesian fashion, where it forms a new table consisting of all possible combinations of the rows from two original tables. JMP crosses the data in the first table with the data in the second to display all combinations of the values in each set. |
|
Select Columns for joined table |
Select the Select Columns for joined table option if you want to select a subset of columns from either table for inclusion in the output table. Follow these steps: 1.In the Source Columns area, highlight the columns from each table that you want to include in the new table. 2.ClickSelectin theOutput Columnsarea. |
|
Output table name |
To give a name to the joined table, type a name in the box beside Output table name. |
Examples of Joining Data Tables
The following sections provide examples using the Join command.
Example of Joining by Row Number
Joining tables by row number joins the two tables side by side. The new table has all of the columns from both tables, unless you specify to include only certain columns.
To join tables with an unequal number of rows
If the two tables that you want to join have an unequal number of rows, the new table contains values for the rows found in both tables.
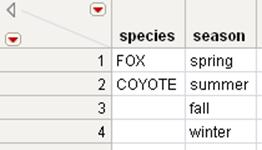
1.Open the Species1.jmp and Species2.jmp sample data tables.
Notice that the Species1.jmp table has two rows, and the Species2.jmp table has four rows.
2.From theSpecies1.jmptable, selectTables > Join.
3.In theJoin...withbox, selectSpecies2.
4.From theMatching Specificationarea, selectBy Row Number.
5.ClickOK.
Figure 6.23 Joined Tables by Row Number
If one table with two rows is joined with a table with four rows, then the new table contains four rows.
To join columns with the same name
If the two tables have column names that are the same, the names of these columns in the new table appear as “column name of table name.” For example, suppose that you want to combine the eight rows from the Trial1.jmp and Trial2.jmp data tables shown in Figure 6.24 into a single table. You want to combine them so that the new table contains all of the columns from both tables.
1.Open the Trial1.jmp and Trial2.jmp sample data tables.
2.From theTrial1.jmpdata table, selectTables > Join.
3.In theJoin...withbox, selectTrial2.
4.From theMatching Specificationmenu, selectBy Row Number.
5.ClickOK.
Figure 6.24 Original Tables and the Joined Table
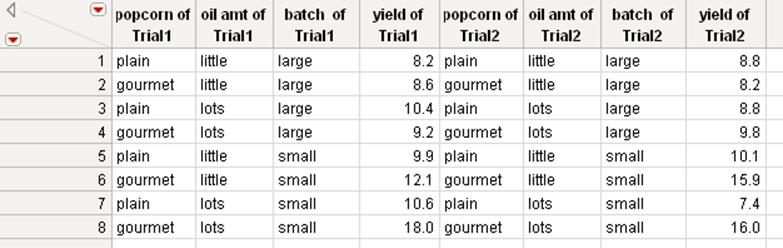
If a column name is the same in the two original tables, the output column name is qualified by the source table name (For example, the column names in the new table appear as <variable name> of table name).
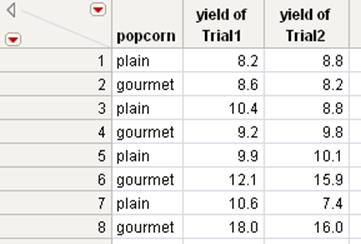
To join only specified columns
Suppose that you do not want all of the columns from the original data tables to be in the joined table. Proceed as follows:
1.Open the Trial1.jmp and Trial2.jmp sample data tables.
2.From theTrial1.jmpdata table, selectTables > Join.
3.In theJoin...withbox, selectTrial2.
4.From theMatching Specificationmenu, selectBy Row Number.
5.ClickSelect columns for joined tableto specify the subset of columns that you want to include.
6.In the Source Columns list, selectpopcornandyieldfrom theTrial1list and selectyieldfrom theTrial2list.
Because identical data exists in the popcorn column of both tables, you need to select only one column.
7.ClickSelect.
8.ClickOK.
Figure 6.25 Joining Only Specified Columns
Examples of a Cartesian Join
When doing a Cartesian join, JMP joins two tables in a Cartesian fashion, where a new table is created that consists of all possible combinations of the rows from two original tables. This creates cases in the output table where there are one case for each combination of column values.
Simple Example
1.Open the Species1.jmp and Species2.jmp sample data tables.
2.From theSpecies1.jmptable, selectTables > Join.
3.In theJoin...withbox, selectSpecies2.
4.From theMatching Specificationmenu, selectCartesian Join.
5.ClickOK.
Figure 6.26 Joining Tables Using Cartesian Join
The data in Species1.jmp is crossed with the data in Species2.jmp to produce the joined table, which shows all combinations of the values in each set.
Complex Example
In this example, use the Tables > Join command twice:
•The first join combines the Oil Amount.jmp table with the Batch.jmp table using the Cartesian option.
•The second join combines the resulting table (Cartesian oil amount + batch) with the Popcorn Type.jmp table and produces a final table with all tables joined.
1.Open the Oil Amount.jmp, Batch.jmp, and Popcorn Type.jmp sample data tables.
2.From theOil Amount.jmptable, selectTables > Join.
3.In theJoin...withbox, selectBatch.
4.From theMatching Specificationmenu, selectCartesian Join.
5.UnderOutput table name, typeOil Amount and Batch.
6.ClickOK.
Figure 6.27 Oil Amount and Batch Joined Table
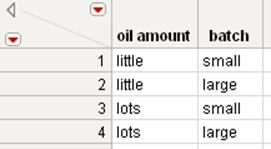
The joined table contains all of the columns from the Oil Amount.jmp and Batch.jmp tables. Add the Popcorn Type.jmp columns, as follows:
7.From theOil Amount and Batchtable that you just created, selectTables > Join.
8.In theJoin...withbox, selectPopcorn Type.
9.From theMatching Specificationmenu, selectCartesian Join.
10.ClickOK.
Figure 6.28 Oil Amount and Batch Joined with Popcorn Type
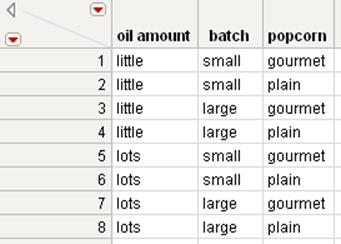
The final table contains all of the columns from all three original tables. Keep in mind that the number of rows produced by a Cartesian join is the product of the number of rows in the original tables.
Examples of Joining by Matching Columns
When you select to join data tables by matching columns, JMP finds specified column(s) values that exist in both tables and combines all values associated with the specified column(s) values into a new data table.
In order to join by matching columns, the columns must have the same data type (numeric, character, or row state).
You can also join a data table to itself, in order to remove duplicate values or rows from the data table.
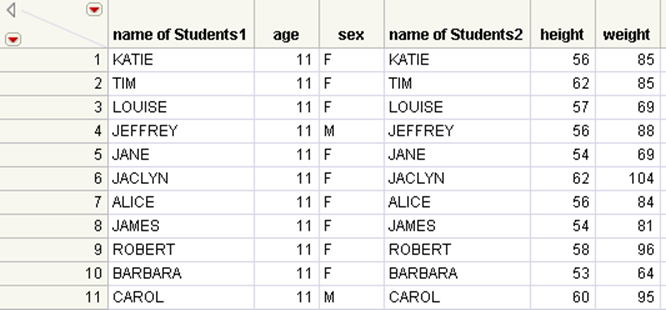
To join tables with the same rows in a different order
1.Open the Students1.jmp and Students2.jmp sample data tables.
The Students1.jmp data table contains names, ages, and sexes of the students. The Students2.jmp data table contains names, height, and weight of the students. Instead of working with two separate tables, you would like to combine the tables into one. Notice that the students’ names are not in the same order in both tables. For example, Alice is in row 7 and row 9.
2.From theStudents1.jmpdata table, selectTables > Join.
3.In theJoin...withbox, selectStudents2.
Because both tables have one column (name) that contains the same values, you need to tell JMP that they are matches. JMP then examines each of the values in the name column of the first table to determine whether there was a corresponding value in the second table’s name column. For example, it detects that Alice is located in both tables. It creates a name column in the new table with Alice as a value. It then takes the age and sex of Alice from table one and puts it in the new table. Then it takes the height and weight of Alice and puts them in the new table.
4.SelectBy Matching Columnsin the Matching Specification area.
5.From theStudents1andStudents2lists, selectname.
6.ClickMatch.
7.You want the new table to contain only one row for each name, so check theDrop multiplesboxes for both tables.
8.ClickOK.
Figure 6.29 Joined Table
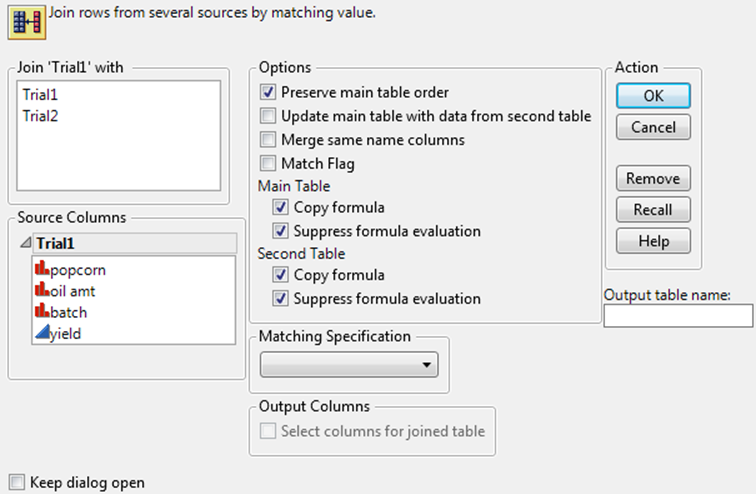
To join tables with different numbers of rows and different column names
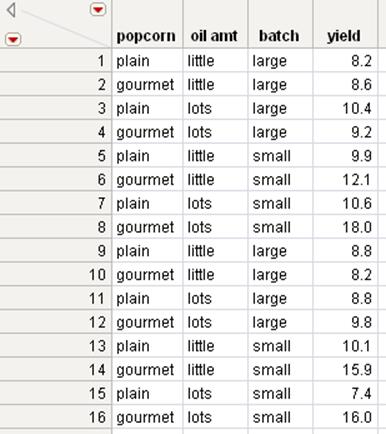
Suppose that Sarah and Joe are performing a popcorn experiment. They are popping different types of popcorn (gourmet and plain) in different amounts of oil. They are recording the amount (yield) of popcorn that is produced. Sarah gave you the first trial data in a file named Trial1.jmp. Joe gave you the second trial data in a file named Little.jmp. You want to combine the two tables into one table.
1.Open the Trial1.jmp and Little.jmp sample data tables.
2.From theTrial1.jmptable, selectTables > Join.
3.In theJoin...withbox, selectLittle.
You can see that three of the columns (popcorn, oil amt/oil, and batch) contain the same values in both tables. Identify these columns as matches. Also, because Sarah and Joe gave the oil and oil amt columns different names, you can tell JMP that oil amt and oil match.
4.DeselectPreserve main table order.
The joined table will be sorted by matching columns, not by the order of data in Trial1.jmp,
5.SelectBy Matching Columnsin the Matching Specification area.
6.From theTrial1list, selectpopcorn,oil amt, andbatch.
7.From theLittlelist, selectpopcorn,oil, andbatch.
8.ClickMatch.
Looking at the two data tables, you can see that they have different numbers of rows. Trial1.jmp has values for eight experimental conditions, and Little.jmp has values for only four of those conditions. Sarah completed her experiment, but Joe only partially completed his experiment. You want the joined table to contain all of the rows in Trial1.jmp. even if that row in the Little.jmp table contains a missing value.
9.Select theInclude non-matchesboxes for both tables.
In the joined table, you only want one column for popcorn, one column for oil, and one column for batch. However, you want two columns for yield: one representing the yield from Trial1.jmp, and another representing the yield from Little.jmp.
10.Select the box besideSelect columns for joined table.
11.From theTrial1list, select all of the columns.
12.ClickSelect.
13.From theLittlelist, selectyield.
14.ClickSelect.
Figure 6.30 Completed Join Window
15.ClickOK.
Figure 6.31 Trial1.jmp and Little.jmp Joined
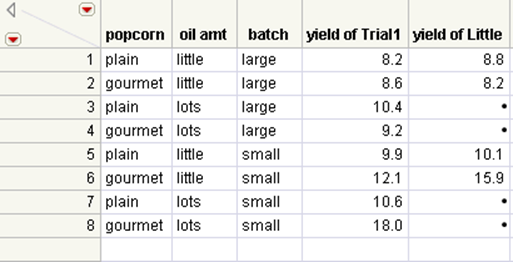
The joined table is sorted by the matching columns. Note that the yield column from the Little.jmp table (Yield of Little) has missing values indicating no matching values with the Trial1.jmp table.
To join a table to itself (to remove duplicate entries)
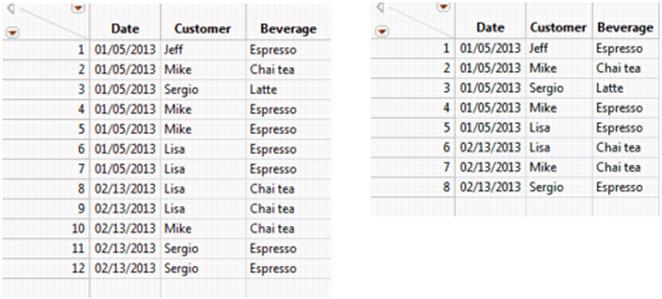
1.Open the Coffee Shop Purchases.jmp sample data table.
You can see that some of the customers had the same drink on the same date. You want to consolidate these duplicate rows using Join.
2.SelectTables > Join.
3.In theJoin...withbox, selectCoffee Shop Purchases.
4.SelectBy Matching Columnsin the Matching Specification area.
5.From both Coffee Shop Purchases lists, select all three columns:Date,Customer, andBeverage.
6.ClickMatch.
7.Select theDrop multiplesboxes for both tables (the Main Table and the With Table).
8.TypeCoffee Shop Purchases Finalfor theOutput table name.
9.ClickOK.
Figure 6.32 Original and Joined Coffee Shop Purchases Data Tables
Update Data Tables
If you have two data tables and would like to update your original table with data from a new table, select Tables > Update. The Update command is a special case of Join in place. It is a Join with the Update option checked, and it does not result in a new table.
Before you update a table, make sure that the name of the column containing the values that you want to replace is the same as the name of the column containing the data that you want to replace it with.
To replace values in the active table with those found in another open table
1.Click on the original table that you want to update (this is the table whose values you want to replace) to make it the active table.
2.SelectTables > Update.
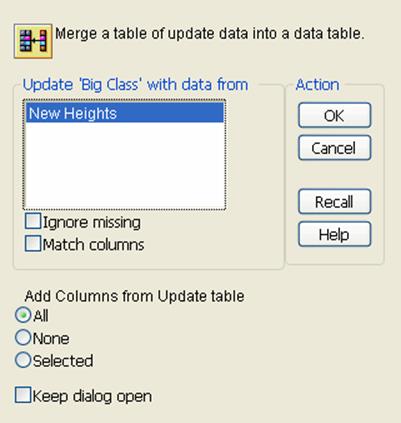
Figure 6.33 Updating a Table
3.Highlight the new table containing the data that you want to transfer to the original table.
4.(Optional) If you do not want JMP to replace the values in the original table with any missing values found in the new table, select the box next toIgnore missing. The original table retains its original values if they correspond to missing values in the new table.
5.If the two tables have one or more columns whose values uniquely describe each row, JMP uses those columns as thematch column values. That is, JMP updates the rows whose match column values coincide. JMP uses these columns to preserve the sorted order of the data. If your tables do not have matching column values, you can incorporate the updated values according to their row order by continuing here. To proceed with tables containing matching column values, see“To update a table using matching columns”.
6.From theAdd Columns from Updatetable area, select an option. Using these options, you can add columns (that do not exist) from the new table into the original table.
‒Choose All to add all columns from the new table into the original table.
‒Choose Selected to add only columns that you have selected from the new table into the original table.
‒Choose None if you do not want to add any non-existent columns from the new table into the original table.
7.ClickOK.
To update a table using matching columns
1.Follow the first three steps outlined in the previous section, “To replace values in the active table with those found in another open table”.
2.SelectMatch columns.
Figure 6.34 This Window Appears When You Click Match Columns
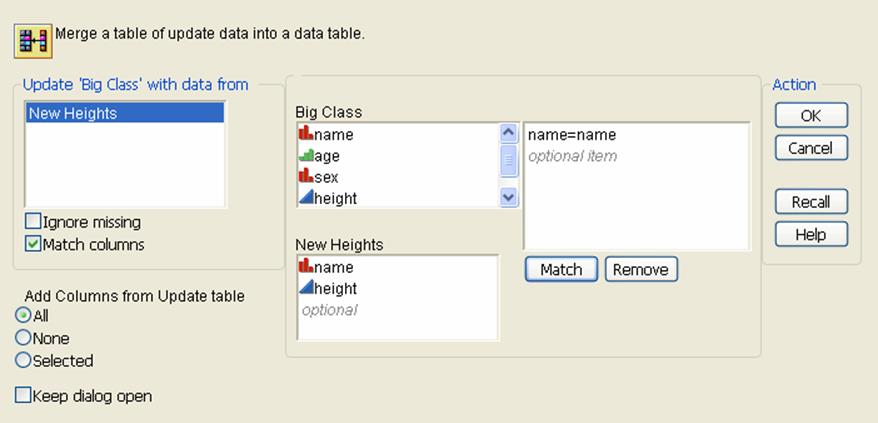
3.Highlight the two column names (in the respective tables) that you want to match.
4.ClickMatch.
5.(Optional) Repeat to match more columns.
6.ClickOK.
Note: Unless the None option is selected in the Add Columns from Update table area, any columns that have different names from the columns in the table that you are updating (and that have not been assigned matches) are appended as separate columns.
Example of Updating a Data Table
Suppose a researcher has a data table containing height measurements for students. The researcher receives an updated table that contains more recent measurements of the students’ heights. The researcher wants to avoid scrolling through the data tables to find the students whose height has changed, and copying and pasting the new values. Using the Update command, the researcher can quickly update the original data table with the new height values.
1.Open the Big Class.jmp and New Heights.jmp sample data tables.
The Big Class.jmp table contains the original data, and the New Heights.jmp table contains the updated data.
2.From theBig Class.jmptable, selectTables > Update.
3.In theUpdate...with data frombox, selectNew Heights.
4.SelectMatch columns.
5.In theBig ClassandNew Heightslists, selectname.
6.ClickMatch.
This tells JMP to use name as the match column value, since it is the column whose values uniquely describe each row.
7.ClickOK.
Figure 6.35 The Updated Big Class.jmp Table
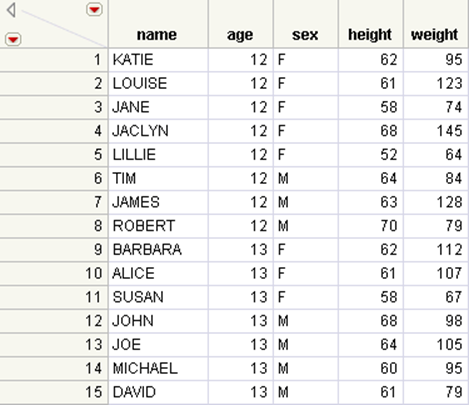
You can see that the height values in the updated table no longer match the values in the original table. The values have been updated to use the newer values from the New Heights.jmp table.
Anonymize Data
The Anonymize Data feature enables you to create a new data table in which certain unique identifiers have been removed.
Data are updated as follows:
•Column headings, character data, and value labels are modified.
•Data in nominal columns are modified.
•Modified data in ordinal columns appear in the same order as in the original data table.
•Data in continuous columns are not modified.
Note: Table scripts and some table variables cannot be anonymized. If your data table contains content that cannot be anonymized, a warning message appears.
Notes column properties are removed. Other column properties are modified based on changes in the data table. For example, Value Ordering properties are renamed, and formulas are updated. Some column properties might no longer have the desired affect on the column.
To rename data
•To rename data in specific columns, select the columns and then select Tables > Anonymize.
•To rename data in the entire data table, select Tables > Anonymize.
The data appear in a new data table.
|
DISCLAIMER: The Anonymize Data utility is provided merely to assist Users in removing certain unique identifiers from a data table as described above. The Anonymize Data utility might not remove all sensitive or personally identifiable information from a data table. Users should not rely exclusively on the Anonymize Data utility to remove such information where complete anonymization, pseudo-anonymization, or de-identification of data is desired or required by law or policy (such as where data are or might be disclosed to other parties). SAS does not represent, and specifically disclaims, that use of the Anonymize Data utility will by itself result in the User’s compliance with any national, state, local or international laws, regulations, or policies that pertain to the privacy, de-identification, or anonymization of sensitive or personally identifiable information. |