Pentaho Analytics for MongoDB (2014)
Chapter 3. Using Pentaho Instaview
In the previous chapter, we reviewed the MongoDB clickstream database and how we query it using the mongo shell. Now, we begin to gain insight into this data by connecting Pentaho to MongoDB. This chapter focuses on Instaview, a component of Pentaho Data Integration, designed to instantly parse, model, and analyze data from Big Data technologies such as MongoDB, Hadoop, and Cassandra. We will use Instaview with the sample MongoDB database to analyze and visualize the website clickstream data.
The following topics are covered in this chapter:
· Accessing and connecting Instaview to MongoDB
· Parsing and profiling a MongoDB collection
· Adding a MongoDB query expression
· Creating and saving an analysis view and Instaview
By the end of this chapter, you will have Instaview connected to the clickstream data for visualizing web session duration by browser and referring URL.
Accessing and connecting Instaview to MongoDB
In Chapter 1, Getting Started with Pentaho and MongoDB, you installed both the Pentaho server and client components on a single Windows computer. Instaview is one of those client components; it is exposed as a perspective through PDI. There are a couple of ways to access Instaview, either directly from your Windows Start menu or from the Instaview perspective inside PDI.
You will notice both Instaview and Data Integration in the following Start menu screenshot:
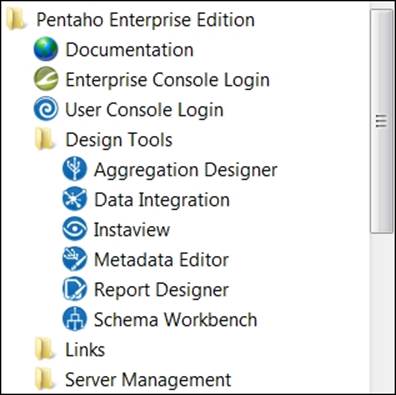
Both links launch PDI; however, the Instaview link launches you directly into the Instaview perspective of PDI. Alternatively, you can launch Instaview or PDI from their respective Windows batch files, Instaview.bat and Spoon.bat, located at {Pentaho Install Directory}/design-tools/data-integration.
The Instaview perspective allows PDI developers to quickly and easily connect to a single MongoDB collection and parse the document hierarchy into a set of fields for analysis. You can then analyze the data with Instaview without ever leaving PDI. After you define the connection, detect the fields, and refine the query, Instaview will launch into an automated, three-step process consisting of the following tasks:
1. Auto-build a PDI transformation to extract data from MongoDB, and load a sample dataset into an in-memory database.
Note
PDI transformations are usually manually created in PDI to define the extraction, transformation, and loading of data. Instaview automates the creation of these transformation files, thus reducing the time to insight and the complexity for developers.
2. Auto-build a cube model consisting of dimensions and measures.
3. Execute the PDI transformation to extract and load the data into an in-memory database for analysis.
After completing the preceding steps, Instaview will launch Analyzer to analyze the data.
Parsing and profiling a MongoDB collection
In this exercise, we'll launch Instaview from the Start menu and connect to the MongoDB database to build an Analyzer Report, showing total session duration by browser and referring URL.
1. Click Instaview from the Windows Start menu.
2. Instaview will take a few seconds to launch, and then you will be presented with two buttons. Click on the Create New button.
3. You have the option to choose which Big Data technology to analyze. Select MongoDB and click on OK.
4. The MongoDB Input step will appear and expose four important tabs for configuration to retrieve records from a single collection. These four tabs are described in the following bullets:
· Configure connection: Configure a server connection with the following default information:
Host name: localhost and Port: 27017
· Input options: Configure a database and collection by clicking on the Get buttons and selecting the following values:
Database: pentaho and Collection: sessions_events
· Query: This tab is used to add a query expression to refine a read request. Leave this tab blank for now; we will revisit it later in this section.
· Fields: Parse the collection document hierarchy into fields. Pentaho's Schema on Read functionality parses fields, paths, and data types and profiles the collection. The profile results are displayed as document statistics. You can then review and adjust the field configurations as needed.
Note
Uncheck Output single JSON field and then click on Get Fields. Enter 10000 for the Number of documents to sample, and then click on OK.
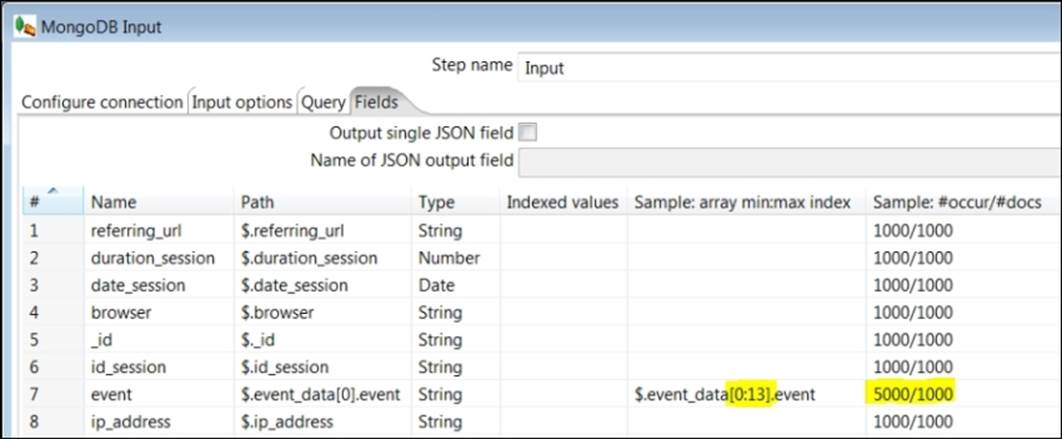
5. Review the paths and document statistics provided for each field, as shown in the following screenshot:
Note
The Path column indicates the JSON path of the field. The event path in line 7, $.event_data[0].event, contains brackets, indicating that this field is an array. The bracketed part of the array holds a zero—the first key value of the array.
The Sample: array min:max column for the event field highlighted in line 7 shows a minimum of zero array values to a maximum of thirteen array values within at least one document.
The Sample: #occur/#docs column for the event field is also highlighted in line 7 shows that Pentaho detected at total of 5000 array values within 1000 documents.
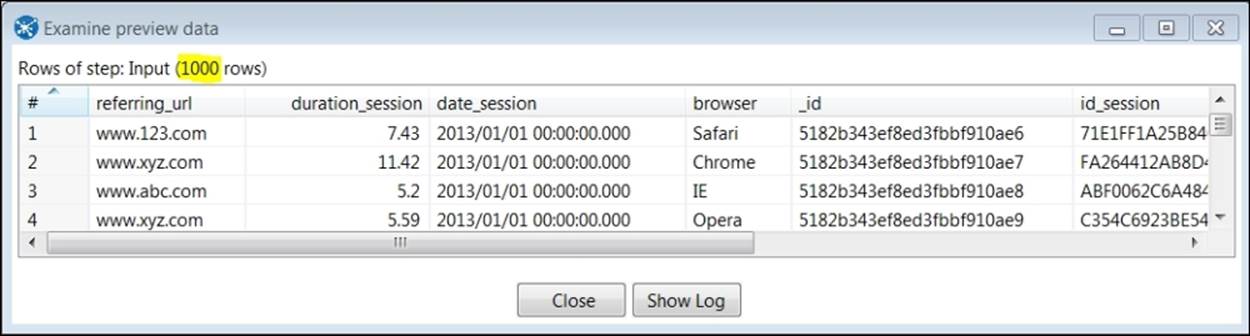
6. The MongoDB Input step is now configured to retrieve records into the field structure defined in the Fields tab. Click on the Preview button at the bottom, enter a preview size of 3000 records, and then click OK. You will see only 1000 rows appear in the preview output, as highlighted in the following screenshot:
Note
We expect 1000 to rows because the statistical data on the Fields tab indicates that the sessions_events collection contains a total of 1000 documents. It also indicates that the events_data array holds 5000 total events. SQL queries will need 5000 rows, one row for each event to interpret the data, yet our preview query returns only the first array value for each of the 1000 documents. This is a good example of why hierarchical document structures are problematic for SQL-based reporting tools. In the next section, we will examine how to add a query expression to the MongoDB Input step to fix this problem.
7. Close the preview output box and click on the Query tab.
Adding a MongoDB query expression
Pentaho allows you to enter a MongoDB query expression to restrict and process the incoming stream of data. MongoDB provides a very useful query operator, $unwind, to help downstream reporting interpret MongoDB document hierarchies. The $unwind operator works by denormalizing (that is, duplicating) the document information for each array value.
Pentaho can leverage the $unwind operator to duplicate the session document fields for each available event in the array. So, a document with five events becomes five documents. Each document is identical except for the value of the event, which is one of the values in the original event_data array. The steps for this are as follows:
1. Enter the query, {$unwind : "$event_data"}, in the Query expression (JSON) textbox.
2. Check Query is aggregation pipeline and then return to the Fields tab.
Note
The aggregation pipeline is a MongoDB framework for data aggregation. We check this option because $unwind is part of that framework.
3. Click on the Get fields button, enter 10000 for Number of documents to sample, and then click on OK.
Note
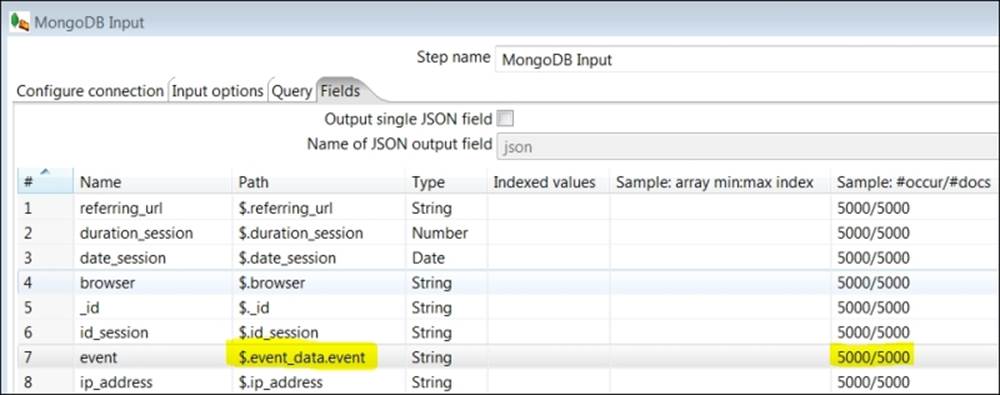
You will notice a couple of changes to the event field after clicking on OK. As shown in line 7 of the following screenshot, the Path field does not contain brackets and the Sample: array min:max value disappears. Most importantly, theSample:#occur/#docs values changed to 5000/5000, indicating that the query aggregation pipeline using the $unwind operator will deliver 5000 documents as rows in the query output.
4. Click on the Preview button, enter 10000 for Number of rows to preview:, and then click on OK.
Note
A total of 5000 rows will be displayed. You will see several duplicate id_session values, one record for each event from that session's array of events. For example, if id_session = 71E1FF1A25B840458-64FCEC447F8D012, there are a total of nine records for the nine events in that session.
5. Close the Examine preview data window, and you are now ready for Instaview to query MongoDB and prepare a cube model for analysis.
6. Click on the OK button on the MongoDB Input step to execute the three-step Instaview process to load 5000 rows into the in-memory cache.
Note
The three boxes represent these steps, and each shows a checkmark and Done if the process executes error-free as highlighted in the following screenshot:
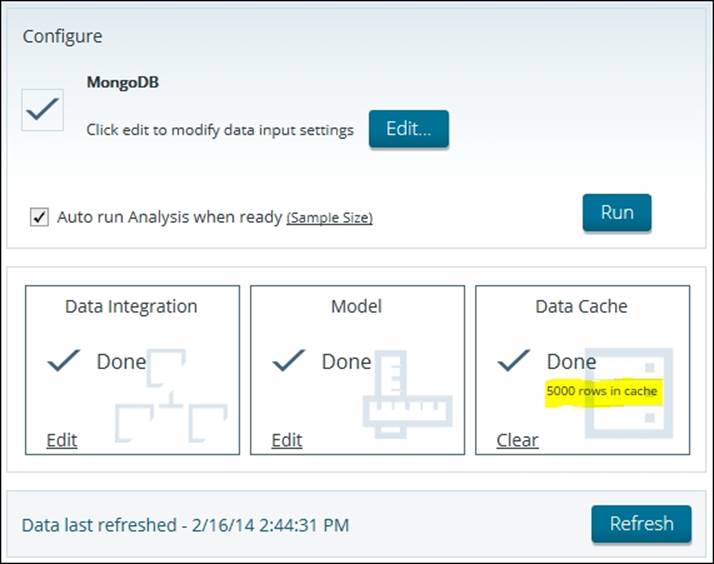
After the three-step process successfully completes, Instaview automatically launches the Pentaho Analyzer interface to analyze the data using the generated cube model.
7. Review the cube measures and dimensions displayed in Analyzer.
Note
Instaview makes a determination of measures and dimensions based on the source field data types. Integers and numbers are added as both measures and dimensions, while string and date fields are added as dimensions.
Creating and saving an analysis view and Instaview
Pentaho bundles its popular and widely-used OLAP interface, Analyzer, into Instaview. Analyzer gives users a simple, drag-and-drop interface to create advanced crosstabs and visualizations of data. It is used for data exploration and creating analysis views for reporting and use in dashboards.
1. To build an Analyzer Report, you drag-and-drop the available fields into the Layout drop zones for Rows, Columns, and Measures.
· Drag Browser to Rows and Analyzer returns a single browser column with a distinct list of available browsers as rows.
· Drag Referringurl to Columns. Analyzer returns three referring URLs as columns.
· Drag Durationsession to Measures. Analyzer returns the sum of Durationsession in minutes into the crosstab cells.
2. Click on the Report Options button.

3. Check the following three items: Show Grand Totals for Rows, Show Grand Totals for Columns, and Show drillthrough links on Measure cells.
4. Click on OK and review your new report. Your report should resemble the following screenshot:
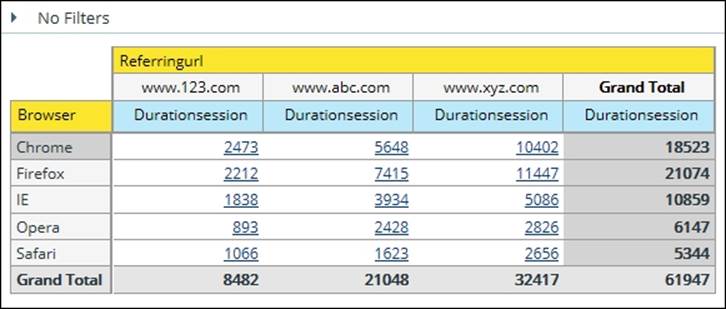
5. Click on the drillthrough link on 893—the cell representing session duration for sessions using Opera and referred by the site www.123.com.
Note
The drillthrough to the detail window will display 72 session records over four pages. The sum of Durationsession will equal the 893 cell's value.
6. Hover over the Durationsession column header and a dropdown icon will appear. Click on the icon and select Sort Descending. Notice the longest session duration for this dataset is 19.84 minutes.
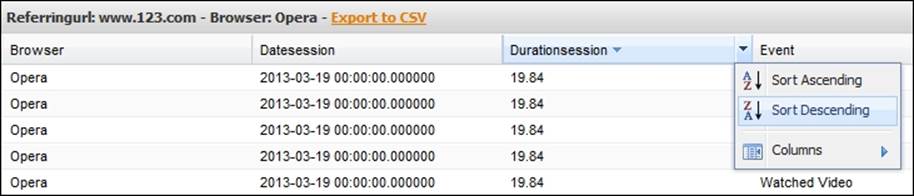
7. Click on the Export to CSV link in the top left corner of the drillthrough window. This will export 72 session records to the .csv format.
8. Validate the total session duration by opening the CSV file in a spreadsheet application and adding sum (C2:C73) to an empty cell. You will get the same 893 value that you drilled into from the Analyzer crosstab.
Note
You may have noticed the session duration values repeating for each event in a session. This is a problem that will cause our total session duration to be artificially inflated when summarized for every record in the session. For example, the Idsession =95C4D9E016E74A89B0ABBBB40-8C30642 represents a session that lasted 12.31 minutes. However, because there are five events in that session, the duration is repeated five times for incorrect total session duration of 61.55 minutes (5 x 12.31).
Don't worry about this issue for now! We will fix the session duration values in the next chapter by editing the cube model. For this chapter, just remain focused on using Instaview for quick prototyping and instant analysis.
9. Close your spreadsheet application without saving, and then return to your Analyzer report.
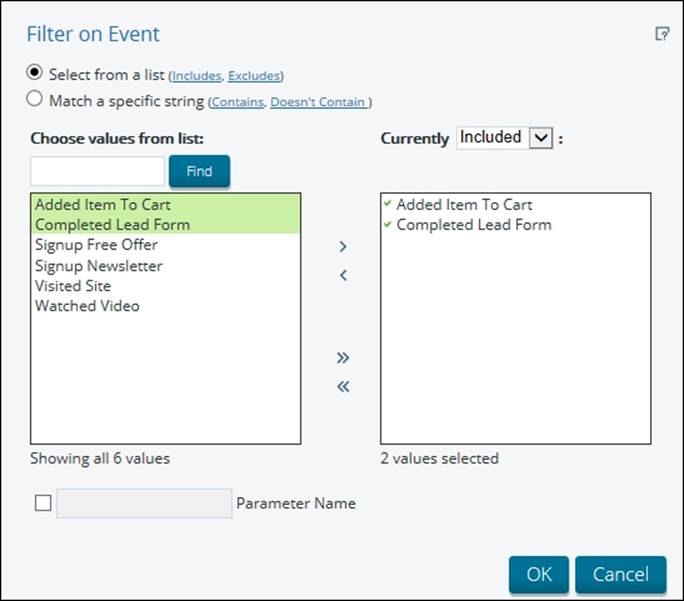
10. There are multiple ways in Analyzer to filter data. Suppose, you want to filter the report for sessions that have at least one Added Item to Cart or Completed Lead Form event. Hover over the Event dimension in the Available fields section, right click on it, and select Filter. The filter utility will display a distinct list of available events to filter your report.
11. Select Added Item To Cart and Completed Lead Form by keeping the Shift key and then click on the right arrow to add it to the Currently Included area, as shown in the following screenshot:
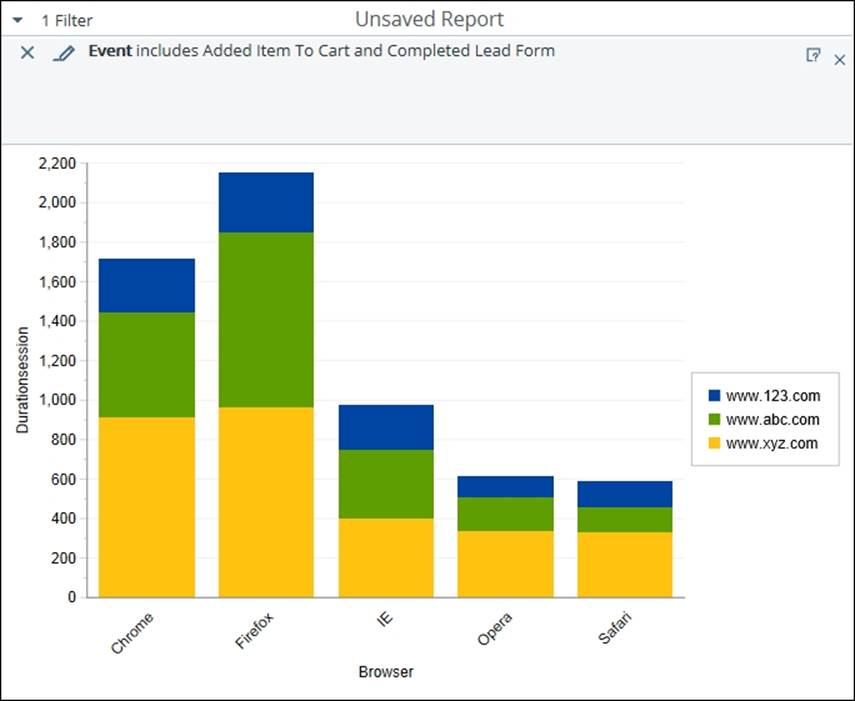
12. Select OK and return to your report. To visualize the crosstab data in a chart, click on the dropdown arrow to the right of the chart icon and select Stacked Column.
13. The resulting stacked column chart in the following figure shows that Firefox is the most used browser for the current subset of data. Click on Save View to save this view as Top Browsers by URL.
14. Click on Save to save your Instaview as Clickstream. When you save an Instaview, you are saving the connection definition, PDI transformation, metadata model, and any saved Analyzer views together. After saving your Clickstream Instaview, you can close it and reopen again as needed to continue development or perform a data refresh.
Summary
You are now well on your way to gaining insight from the MongoDB clickstream database using Instaview. In this chapter, we established a connection to MongoDB and parsed the events_sessions collection into a set of fields. This involved using the $unwind query operator to duplicate session information for each event array value. This result of this query operation was similar to the query results you would expect from a one-to-many join between two relational tables. We then used Analyzer to analyze the resulting data and create a stacked column chart. In the next chapter, we will continue working with Instaview to learn how to edit the metadata for additional metrics and analysis views.