Pentaho Analytics for MongoDB (2014)
Chapter 4. Modifying and Enhancing Instaview Transformations
Pentaho Data Integration (PDI) is a graphical ETL tool used by Instaview to extract data from various data sources into the Instaview data cache for analysis. PDI transformations are created by Instaview to define this flow of data from source to target. Instaview gives users the ability to modify the underlying PDI transformation that is automatically generated during the initial data load process. This chapter shows users how to edit the default PDI transformation and add a new data source to create an enriched dataset for analysis.
The topics that we will cover in this chapter are as follows:
· Open an existing Instaview
· Data integration
· Add a new data source
· Create a new analysis view from the blended data
By the end of this chapter, you will have enhanced an Instaview by adding a new data source that contains geographic information. The new data source will give users the ability to analyze the sample clickstream data by geography.
Opening an existing Instaview
At this point, you should have created, saved, and closed the Clickstream Instaview. We need to reopen Clickstream to make modifications to the initial design. To open a saved Instaview, launch Instaview, and on the Welcome screen, you will see an Open Existingbutton. Click on Open Existing and choose the Clickstream Instaview file you created in the previous chapter. You can have only one Instaview file open at any one time. The Instaview file contains the following six objects:
1. A new data source connection to MongoDB
2. A defined sample size
3. A data integration transformation to extract data from MongoDB and load it into the in-memory data cache
4. A metadata model to define dimensions and measures
5. An in-memory database table containing the data cache
6. Analyzer views for visualizing data in a table or chart
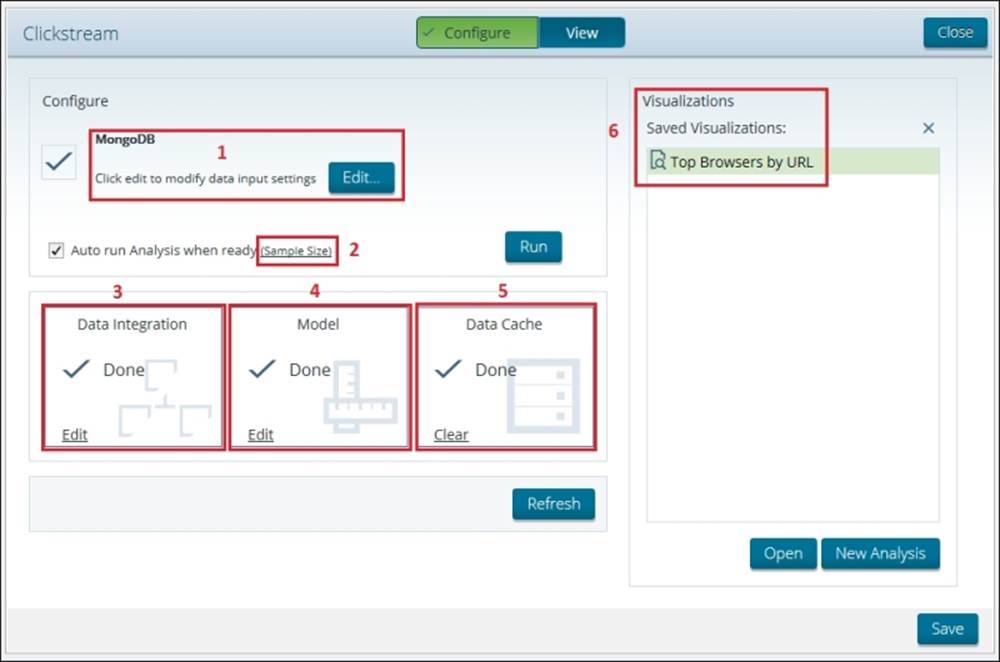
These six objects are bundled together into a single Instaview file. The corresponding object locations are highlighted red and numbered in the following screenshot of Instaview in the Configure mode:
Data integration
PDI is a powerful ETL tool that is used for a broad set of data integration use cases such as data warehouse development, data migration, data cleansing, and more. We focus on the graphical designer, Spoon, and cover only a small portion of PDI functionality in this book. Spoon is an easy-to-use, drag-and-drop environment with over 100 out-of-the-box steps that are used to create transformations. When you are ready to learn PDI in-depth, there are excellent books for learning PDI that cover each and every feature.
The Instaview build process creates a PDI transformation file. Transformations describe the ETL data flows such as reading source data, transforming the data, and loading the data to a target output. A transformation can be edited by clicking on Edit in the Data Integration section of Instaview, shown inside the third red box in the previous screenshot. After editing a transformation, you have to run the Instaview data load process again for the updates to be applied to the data. The next section describes how to add a second data source to your Instaview.
Adding a new data source
The zip_codes.csv flat file provided with this book contains a mapping of IP addresses to geographies down to the ZIP code level. If you don’t already have this file, it can be downloaded at http://www.packtpub.com/support. We will use PDI to link ip_address from the ZIP code file to ip_address in the clickstream data. By blending geographic data such as country, state, city, and ZIP code with clickstream data, we will be able to analyze clickstream metrics by geography. In addition, once the data is blended with geographic data, you are able to visualize it on Google or Open Street Maps within Instaview.
The data integration Edit hyperlink takes you to the Data Integration perspective of PDI. This perspective gives you the full set of available steps for creating powerful transformations. The screenshot for this is as follows:
![]()
Notice that the default Clickstream transformation is opened and contains three steps, Input, Do Not Edit, and Output, which are connected by arrows called hops. Hops define the direction of the streaming data from one step to the next, shown as follows:
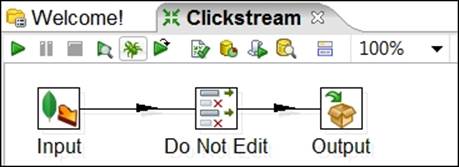
This simple transformation retrieves data from MongoDB and the specification we defined in the Instaview data source connection and then loads the data into an in-memory database for analysis.
The Design tab to the left organizes all of the available steps into 24 folders. These folders can be expanded to see a list of steps for that category. At first, the sheer number of available steps can be intimidating, but after some experience building transformations, you will start to know which steps are best for a particular transform requirement. A full list of transformation steps and descriptions are available via the Transformation Steps Documentation link on the Welcome tab, which takes you to the following Pentaho wiki page: http://wiki.pentaho.com/display/EAI/Pentaho+Data+Integration+Steps.
The search input box at the top of the folder list is a handy search feature for finding steps. By typing lookup into the search box, you will see a list of steps that have this search term in the step name or description. A step’s description appears by hovering over the step name with your mouse pointer. Hover your mouse over the Stream lookup step, and read the step description.
We will be using this Stream lookup step along with the CSV file input step to lookup data incoming from the zip_codes.csv flat file. The resulting transformation from the next exercise will match the one shown in the following screenshot:
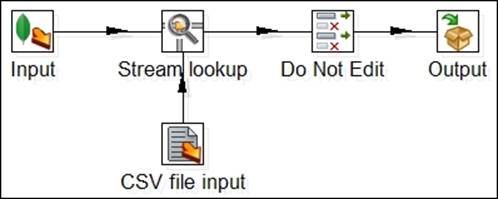
Completed Transformation
CSV file input
In this first part of the exercise, we add the CSV file input step and configure the step properties:
1. Make sure you are in the Data Integration perspective of PDI. If you are still in Instaview’s Configure mode, click on the Edit hyperlink in the Data Integration section to switch to PDI.
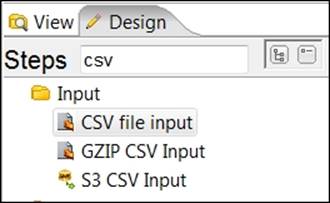
2. Under the Design tab, type csv into the steps search box and find the CSV file input step from the list of steps.
3. Select and drag the CSV file input step onto the canvas.
4. Double-click on the CSV file input step and the Edit properties’ dialog box appears.
Note
This area is used to specify the location of the zip_codes.csv file and configure properties for the step and incoming fields.
5. Click on the Browse button inside the properties’ dialog box and browse to the zip_codes.csv file saved on your local disc. Select the file and click on Open.
6. Click on the Get Fields button at the bottom of the properties’ dialog box to scan the incoming records and detect all available fields.
7. Enter 2000 for the sample size entry box and click on OK.
Note
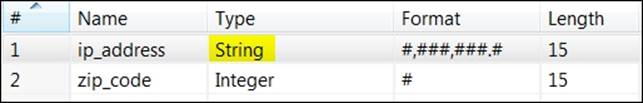
Pentaho will scan all of the file records to determine field name, data type, format, and length. The Scan results dialog box appears after the scan is complete to display a summary of scan results. Upon reviewing the scan results, you will notice theip_address field is interpreted as a numerical data type. We need to change this field’s data type to string to match the ip_address field data type in MongoDB.
8. Click on Close to return to the properties’ dialog box.
9. Under the Type column, select String for the ip_address row.
10. Lastly, uncheck Lazy conversion? and then click on OK.
Tip
Lazy conversion delays or avoids data conversion of raw binary format data from flat files to improve transformation performance when conversion is not necessary. We uncheck Lazy Conversion in our transformation to allow it to be converted and joined to the MongoDB string data encoded in UTF-8.
Stream lookup
The next series of instructions tells to you add the Stream Lookup step to the canvas and connect it to the Input, Do Not Edit, and CSV file input steps using hops. You can refer back to the completed transformation in Completed Transformation figure to confirm your hops are set up correctly.
1. Select and drag the Stream Lookup step onto the canvas.
2. While dragging the step onto the canvas, hold your left mouse button down and move the Stream Lookup step directly over the hop arrow between the Input and Do Not Edit steps. This will split the existing hop into two separate hops.
3. Release your mouse while the hop is highlighted to connect the Stream lookup step to newly split input and output hops.
Tip
Two other methods for creating a hop are to select two steps using the Lasso tool on the canvas, right-click on one of the selected steps, and choose New Hop. Alternatively, you can keep the Shift key pressed and click a step and move the mouse towards the downstream step. This will paint a hop arrow with the mouse pointer until you click on a downstream step. Upon clicking on the downstream step, select Main output of step to finalize the hop connection.
4. Select the Stream lookup using the Lasso tool and CSV file input steps to highlight them both.
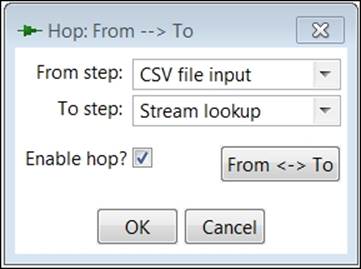
5. Right-click on one of the highlighted steps and select New Hop from the menu.
6. Make sure the From step option is set to CSV file input and the To Step option is set to Stream lookup as shown in the following screenshot, and then click OK:
7. Double-click on the Stream Lookup step and the Edit properties’ dialog box appears.
Note
Stream lookup properties are used to define the key field used to join the two datasets and the lookup fields that will be retrieved from joined records in the zip_codes.csv file.
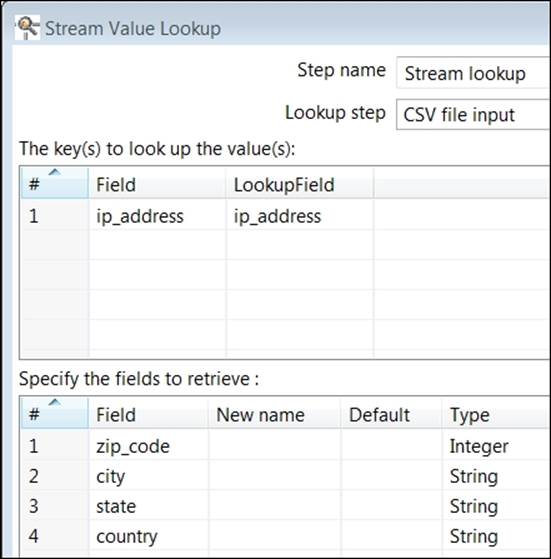
8. In the Lookup step drop-down box, select CSV file input.
9. In The key(s) to look up value(s): section, click on the Field column and select ip_address from the list of available fields. Then, click on the LookupField column and choose ip_address from that list of fields.
10. Click on the Get lookup fields button at the bottom right of the properties’ dialog box. This will populate the Specify the fields to retrieve section with all fields from the zip_codes.csv file.
11. Right-click on the ip_address (row 1) in the Specify the fields to retrieve section and select Delete selected lines from the menu. The resulting Edit properties’ dialog box should resemble the following screenshot.
12. Click on OK and then click on the Save icon ![]() on the PDI toolbar to save your changes.
on the PDI toolbar to save your changes.
13. Click on the Instaview perspective icon ![]() to return to Instaview Configure mode.
to return to Instaview Configure mode.
14. Click on the Run button to execute your updated data integration transformation and blend the two sources of data.
Once the Instaview build process completes successfully, it will launch you back in the analysis interface to create a new analysis on the blended data.
Creating a new analysis view from blended data
Now that Instaview has successfully blended our clickstream and geographic data, let’s visualize the data on a Google map:
1. Make sure you are connected to the Internet so the Google mapping feature will work.
2. If you are in the Instaview Configure mode instead of the analysis interface, click on the New Analysis button.
Note
The measures and dimensions are updated in the Available fields section to include the Country, State, City, and Zipcode fields from the zip_codes.csv file.
3. Drag Durationsession to the Measures drop zone in the Layout section.
4. Drag Country to the Rows drop zone in the Layout section.
5. Drag State to the Rows drop zone in the Layout section.
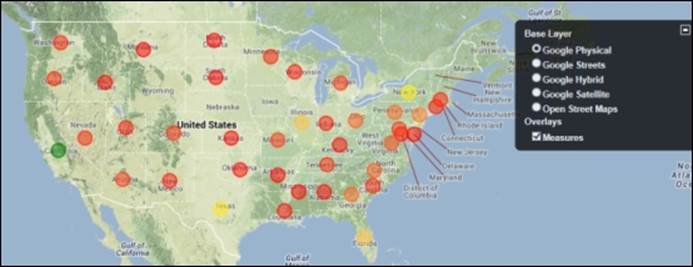
6. In the View As section, click on the dropdown next to the chart icon and then select Geo Map:
![]()
7. Expand the small plus icon on the right-hand side of the map and select the Google Physical base layer so that your visualization matches the following screenshot:
8. Click on the Save View button and name the visualization Chapter04-GeoMap. Click on OK.
Summary
We now have an updated Clickstream Instaview with blended data and a couple of saved visualizations. However, the default metadata model, which was automatically generated by Instaview, does not give us an accurate view of the data. It needs significant model enhancements to create a better dimensional model for analysis. The next chapter explains dimensional modeling concepts and provides exercises for building a model that will give us an accurate and improved insight of our blended dataset.