Learning Nagios 4 (2014)
Chapter 10. Advanced Monitoring
The previous chapter provided information about Simple Network Management Protocol (SNMP) and how it can be used to monitor various devices with Nagios.
This chapter describes solutions that can be used to monitor a Microsoft Windows host and its services by installing and configuring a dedicated agent in the operating system. It shows how to communicate from the Nagios server to Windows machines, as well as the other way around.
This chapter also talks about how Nagios can be configured so that it notifies other Nagios instances about the current status of all hosts and services. These techniques can be used to create a central Nagios server that receives notifications from other machines.
In addition, this chapter covers the basics of setting up Nagios so that it handles problems when receiving information from other Nagios instances. If one of your Nagios monitoring systems is down or unreachable, you will want another Nagios instance to detect this and report it to you.
In this chapter, we will cover the following settings:
· Setting up NSClient++, an agent for Microsoft Windows machines that allows them to be monitored from Nagios
· Running tests using the check_nt plugin and using the NRPE protocol
· Scheduling checks from NSClient++ and sending results using the NSCA protocol
· Setting up multiple Nagios instances for monitoring
· Sending notifications about host and/or service status changes from one Nagios instance to another
· Using templates to ease the process of configuring multiple Nagios instances
Monitoring Windows hosts
Nagios was originally designed to monitor UNIX operating systems. The plugins package developed along with Nagios cannot be used on Microsoft Windows systems. As mentioned in the previous chapter, SNMP can be used to monitor Windows, and this requires the installation of an SNMP agent on the system.
The SNMP agent on a Microsoft Windows system allows you to check for a large number of parameters. There are, however, things that cannot be easily checked using SNMP and cannot be monitored remotely using the standard Nagios plugins. This includes running external processes, gathering information unavailable via SNMP, and checking the status of multiple parameters in a single check.
An alternative to SNMP on Microsoft Windows workstations and servers is to install a dedicated agent that is used to monitor these systems from Nagios. The most commonly used agent is NSClient++ (http://www.nsclient.org/), the first Windows agent to be designed to work strictly with Nagios.
This agent allows you to query various parameters from Nagios using a special plugin. NSClient++ can also report results directly to Nagios using the Nagios Service Check Acceptor (NSCA) protocol described in Chapter 7, Passive Checks and NSCA. It is possible to set up the types of checks that should be performed, the frequency of the checks, and whether they should be reported as host or service checks. The agent will also need to know the hostname of the Nagios server, the NSCA port, the encryption method, and the password.
Setting up NSClient++
NSClient++ (NSCP) is a project that is based on and extends the NSClient concept. The original concept was to create an agent for Windows that, once installed, allows the querying of system information. NSClient has created a de facto standard protocol that offers the ability to query variables with parameters. NSClient++ uses the same protocol, but also offers the ability to perform more complex checks using the NRPE protocol.
Installing NSClient++ requires you to pass the path where it will be installed and choose the features to install. Unless you need to install NSClient++ in a specific location, it is best to use the default path of C:\Program Files\NSClient++. The next step is to choose the features that you want installed. The following image shows the setup with choice of features to install:
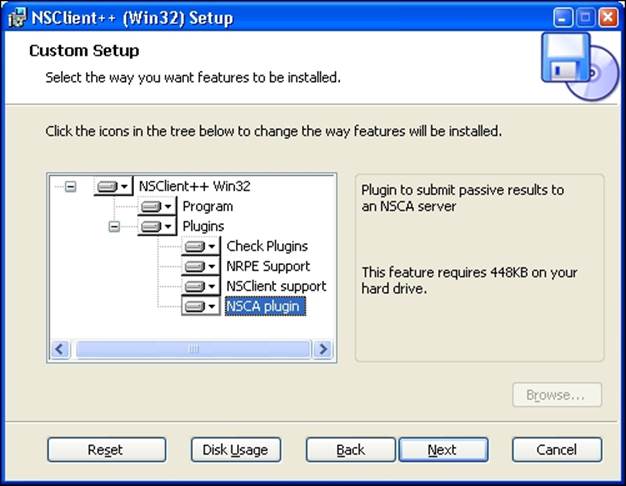
NSClient++ comes with multiple features, such as various plugins, that can be installed. NSClient++ can also be set up to act as the NRPE daemon and run external checks. It is also possible to make it send results over NSCA. This option is mainly useful if your network is set up in such a way that it is not possible to establish outgoing connection to the workstations. If not, it is better for the Nagios daemon to query NSClient++.
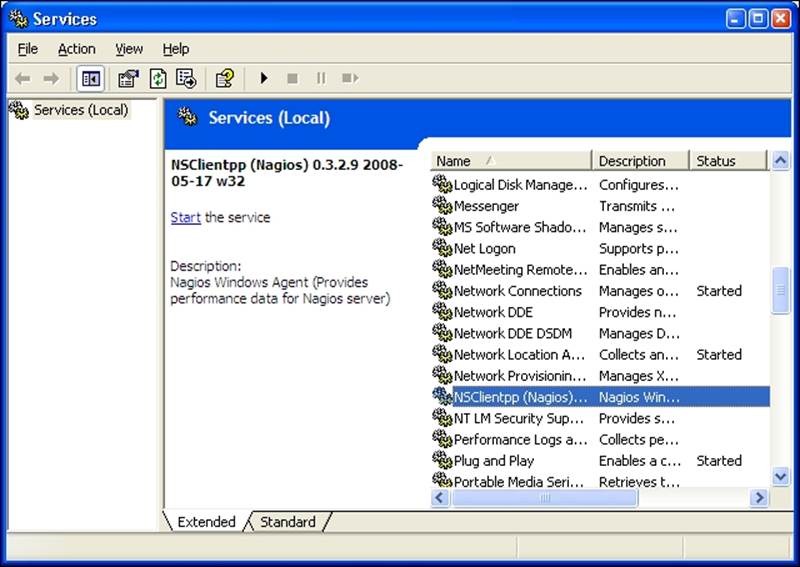
After a successful installation, NSClient++ registers itself as a Windows service. The service will be started after rebooting the system, or by going to the Services management console in Administrative Tools, finding the NSClient++ service and starting it, as shown in the following screenshot:
Note
The screenshots are taken using Windows 2003/XP, but the look and feel of the installer as well as the Services management console in Administrative Tools is the same across all Windows versions.
In order to start the service, select the NSClientpp service and click on the Start the service action on the left. NSClient++ comes with the main engine, the plugin that accepts checks over the network, the NRPE daemon, and the ability to perform checks and report results automatically via NSCA. It is best to select all of the features at the time of installation. These features need to be explicitly enabled in the configuration file.
Once installed, NSClient++ needs to be configured. By default, the configuration file NSC.ini is located in the application folder, that is, C:\Program Files\NSClient++\NSC.ini. After a fresh installation, a default configuration is installed. This configuration file contains a list of all the available parameters along with comments for them. It also has all of the features disabled, so enable only the ones you need. We will now enable the features we want to use.
The configuration is split into several sections. Each section begins with a section name enclosed in brackets; for example, the first section begins with [modules]. This section defines which modules should be loaded by simply specifying each DLL. The Settingssection is used to specify global parameters. The most important is allowed_hosts, which is a list of IP addresses or IP ranges that can connect to the agent. The password option specifies the password that will be used to authenticate Nagios checks. If a password is not specified, then all checks will be accepted. The NSClient and NRPE sections are used to configure the acceptance of requests from the Nagios daemon.
If you plan to use NSCA, then the NSCA Commands section allows the definition of one or more checks that should be performed and reported to the Nagios daemon over NSCA. Connectivity with the NSCA daemon can be configured in the NSCA Agent section.
The following is a sample configuration file that loads all types of checks, loads the NSCA agent, and sets up NSClient and NSCA:
[modules]
FileLogger.dll
CheckSystem.dll
CheckDisk.dll
CheckEventLog.dll
CheckHelpers.dll
CheckWMI.dll
CheckExternalScripts.dll
NSClientListener.dll
NRPEListener.dll
NSCAAgent.dll
[Settings]
allowed_hosts=192.168.0.0/16
use_file=1
[NSClient]
port=12489
[NRPE]
port=5666
[NSCA Agent]
interval=60
encryption_method=1
password=mysecret
hostname=windows1
nsca_host=192.168.2.51
nsca_port=5667
[NSCA Commands]
CPU Usage=checkCPU warn=80 crit=90 time=20m time=10s time=4
If you are not interested in using NSCA, all you need to do is to comment out the NSCAAgent.dll line in the modules section.
Performing tests using check_nt
NSClient++ offers a uniform mechanism to query system information. Basic system information can be retrieved using the check_nt command from a standard Nagios plugins package.
The syntax and options of the command is as follows:
check_nt -H <host> [-p <port>] [-P <password>] [-w level]
[-c level] -v <variable> -l <arguments>
|
Option |
Description |
|
-H , --hostname |
This option must be specified to denote the hostname or IP address of the machine to connect to. |
|
-p , --port |
This specifies the TCP port number to connect to. For NSClient++, it should be set to 1248, which is the default port. |
|
-P , --password |
This specifies the password to use for authentication. This is optional and is needed only if a password is set up on the Windows agent. |
|
-v , --variable |
This is the variable to query. The possible variables are described further in this section. |
|
-l , --arguments |
This is the arguments to be passed to the variable and is optional. |
|
-w , --warning |
This specifies the return values above which a warning state should be returned. |
|
-c , --critical |
This specifies the return values above which a critical state should be returned |
The variables that can be checked are predefined. Most checks return both the string representation and an integer value. If an integer value is present, then the -w and -c flags can be used to specify the values that will indicate a problem.
The first variable is CPULOAD that allows the querying of processor usage over a specified period of time. The parameters are one or more series of <time>, <warning>, and <critical> levels, where time is denoted in minutes and the warning/critical values specify, in percentage, the CPU usage that can trigger a problem, as seen in the following example:
# check_nt –h 192.168.2.11 -v CPUUSAGE –l 1,80,90
CPU Load 2% (1 min average) | '1 min avg Load'=2%;80;90;0;100
The USEDDISKSPACE variable can be used to monitor space usage. The argument should be a partition letter. The -w and -c options are used to specify the percentage of used disk space that can trigger a problem, as seen in the following example:
# check_nt –h 192.168.2.11 -v USEDDISKSPACE –l C –w 80 –c 90
C:\ - total: 24.41 Gb - used: 17.96 Gb (74%) - free 6.45 Gb (26%) | 'C:\ Used Space'=17.96Gb;0.00;0.00;0.00;24.41
System services can also be monitored using the SERVICESTATE variable. The arguments must specify one or more internal service names, separated by commas. Internal service names can be checked in the Services management console, as seen in the following example:
# check_nt –h 192.168.2.11 -v SERVICESTATE -l NSClientpp,Schedule
OK: All services are running.
The same as with monitoring services, it is also possible to monitor processes running on a Windows machine. The PROCSTATE variable can be used to achieve this. The variable accepts a list of executable names separated by commas, as seen in the following example:
# check_nt –h 192.168.2.11 -v PROCSTATE -l winword.exe
OK: All processes are running.
Similarly, the monitoring of memory usage can be checked. Use the MEMUSE variable to perform this kind of check. This does not require any additional arguments. The -w and -c arguments are used to specify the warning and critical limits, as seen in the following example:
# check_nt –h 192.168.2.11 -v MEMUSE -w 80 -c 90
Memory usage: total:5891.77 Mb - used: 846.01 Mb (14%) - free: 5045.75 Mb (86%) | 'Memory usage'=846.01Mb;4713.41;5302.59;0.00;5891.77
Another thing that can be checked is the age of a file using the FILEAGE variable. This variable allows the verification of whether a specified file has been modified within a specified time period. The arguments, -w and -c, are used to specify the warning and critical limits. Their values indicate the number of minutes within which a file should have been modified—a value of 240 means that a warning or critical state should be returned if a file has not been modified within the last four hours, as seen in the following example:
# check_nt –h 192.168.2.11 -v FILEAGE -l \
"C:\\Program Files\\NSClient++\\NSC.log" -w 5 -c 10
0 years 0 mon 0 days 0 hours 0 min 0 sec
It is also possible to check the version of the agent. This makes the maintenance of upgrades and new versions much easier. The CLIENTVERSION variable allows the retrieval of version information, as seen in the following example:
# check_nt –h 192.168.2.11 -v CLIENTVERSION
NSClient++ 0.3.2.9 2008-05-17
It is also possible to use check_nt to query the Windows counters for information. However, this method has deprecated as querying Windows Management Instrumentation (WMI) (http://en.wikipedia.org/wiki/Windows_Management_Instrumentation), which is available as NRPE, is a much more powerful feature. We describe NPRE in the next section.
WMI is a mechanism that allows applications to access the system management information using various programming languages. WMI offers an extensive set of information that can be retrieved. It describes the hardware and operating system as well as the currently-installed applications and the running applications. WMI also offers a query language (http://en.wikipedia.org/wiki/WQL) very similar to the Structured Query Language (SQL) (http://en.wikipedia.org/wiki/SQL) that makes the retrieval of specific information very easy.
Performing checks with NRPE protocol
Another way to communicate with NSClient++ is over NRPE (detailed in Chapter 8, Monitoring Remote Hosts). UNIX machines offer a way to run external commands via NRPE. In this case, the protocol can be used to query internal functions as well as run external commands or scripts.
NSClient++ requires the modification of the NSC.ini configuration file in order to query data over NRPE. First, enable NRPEListener.dll and CheckExternalScripts.dll in the modules section. NRPEListener.dll is responsible for handling the NRPE protocol, whileCheckExternalScripts.dll allows the creation of aliases for internal commands and external scripts.
NSClient++ can be configured to use both internal commands and external scripts to perform actual checks. Internal commands define aliases for checks that will be done internally, without launching external applications. NSClient++ allows the definition of aliases that are used later on when invoking the check_nrpe command from the Nagios server. The External Alias section in the NSClient++ configuration allows the definition of aliases for the actual commands.
The following are some examples of the aliases:
[External Alias]
check_cpu=checkCPU warn=80 crit=90 time=5m time=1m
check_mem=checkMem MaxWarn=80% MaxCrit=90% ShowAll type=physical
check_no_ie= CheckWMI -a 'Query:load=SELECT Caption FROM Win32_Process' +filter-string:Caption=iexplore.exe MaxCrit=1
The check_no_ie alias needs to be put in a single line in the configuration file. The first alias is used to monitor CPU usage. The second one allows the monitoring of memory. The third example uses the WMI command to list processes and find iexplore.exe. The command will return a critical state if at least one iexplore.exe process is found.
In order to perform a check from Nagios, the following command can be used:
# check_nrpe –h 192.168.2.11 -c check_cpu
OK CPU Load ok.|'5m'=48;80;90; '1m'=45;80;90; '30s'=45;80;90;
The $IP argument is the IP address of the remote host against which a check should be performed. It is also possible to use direct NSClient++ NRPE commands without aliases. This requires you to set the allow_arguments option to 1 in the NRPE section in the NSC.inifile.
With the arguments enabled for NRPE, it is possible to do the following:
# check_nrpe –h $IP -c check_cpu –a warn=80 crit=90 time=5m time=1m
OK CPU Load ok.|'5m'=48;80;90; '1m'=45;80;90; '30s'=45;80;90;
This will pass arguments specified after -a argument to the check command. The commands that can be used both directly and when defining aliases in the External Alias configuration section can be found in the commands' documentation (http://trac.nakednuns.org/nscp/wiki/CheckCommands).
NSClient++ also allows the execution of external commands, similar to the UNIX NRPE implementations. This can be used to run various types of scripts as well as executables. The default configuration comes with some sample definitions.
The following are a few examples that show how to use the various scripting languages:
[External Scripts]
check_vbs_sample=cscript.exe //T:30 //NoLogo scripts\check_vb.vbs
check_tcl_test=tclsh.exe scripts\check_tcl.tcl
check_python_test=python.exe scripts\check_python.py
The first check uses the standard Windows Script Host mechanism to run a Visual Basic script. In order to run Tcl or Python scripts on Windows, a distribution of these languages needs to be installed. The most popular ones are ActiveTcl (available for download athttp://www.activestate.com/Products/activetcl/) and ActivePython (available for download at http://www.activestate.com/Products/activepython/), both maintained by the ActiveState company.
Running external commands does not differ from running internal ones. This makes it possible to dynamically change between internal checks and external scripts when necessary.
For example an external command is run similarly to internal one by specifying check name with -c:
# check_nrpe –h $IP -c check_tcl_test
OK from Tcl 8.4.19 as C:/Tcl/bin/tclsh.exe (pid 1234)
As with other NRPE implementations, NSClient++ allows the passing of parameters to commands that are to be executed.
For example, the following alias allows the monitoring of the CPU adaptively by specifying warning and critical values:
[External Alias]
check_cpu2=checkCPU warn=$ARG1$ crit=$ARG2$ time=5m time=1m
The following command needs to be run to perform the check:
# check_nrpe –h $IP -c check_cpu2 –a 80 90
OK CPU Load ok.|'5m'=48;80;90; '1m'=45;80;90; '30s'=45;80;90;
Performing passive checks using NSCA Protocol
NSClient++ offers a way for Windows machines to send results to the Nagios server using the NSCA protocol. This is done by incorporating the sending mechanism in the agents. A very common situation is where network routers or firewalls filter out communication to the Windows machines. It is impossible to communicate using the check_nt and check_nrpe plugins. In such cases, the only option is to send results over NSCA.
Setting up the NSCA functionality is very simple. First, enable the NSCAAgent.dll library in the modules section. It is also necessary to configure the NSCA Agent section. This configures the intervals (in seconds) at which the checks will be performed and the connection options—encryption, password, NSCA host, and port. For details on the NSCA connectivity, please refer to Chapter 7, Passive Checks and NSCA.
The NSCA section of the configuration file also specifies the local hostname that should be used when reporting to the NSCA daemon. The NSCA Commands section specifies the list of commands to be checked and the services they should be reported as. The hostname and services need to reflect the actual names used in the Nagios configuration. Otherwise, the reports from NSClient++ will be discarded by Nagios.
The following is an example of such a configuration:
[NSCA Agent]
interval=300
encryption_method=1
password=test
hostname=windows1
nsca_host=192.168.2.51
nsca_port=5667
[NSCA Commands]
check_cpu=checkCPU warn=80 crit=90 time=20m time=10s time=4
check_no_ie= CheckWMI -a 'Query:load=SELECT Caption FROM Win32_Process' +filter-string:Caption=iexplore.exe MaxCrit=1
The alias definitions of an NSCA check are the same as the NRPE aliases. The commands that can be used in NSClient++ to define the NSCA commands can be found in the commands documentation at http://trac.nakednuns.org/nscp/wiki/CheckCommands.
In order for Nagios to accept information from the Windows machine, we need to create a corresponding service for it.
The following is an example that has active checks disabled and allows only passive checks to be received:
define service
{
use generic-service
host_name windows1
service_description check_cpu
active_checks_enabled 0
passive_checks_enabled 1
}
We also need to have the NSCA server running on the Nagios server. This is detailed in Chapter 7, Passive Checks and NSCA.
Understanding distributed monitoring
There are many situations in which you may want to have more than one Nagios instance monitoring your IT infrastructure. One reason can be a firewall blocking all but a few machines in your company. Another reason could be the need to load balance all checks so that they don't require an enterprise-class server. Others may need to monitor machines in different physical locations from separate machines to check what is wrong within a branch, even if the links to the central servers are temporarily down.
Regardless of the reason, you may want or need to have the execution of checks split across multiple computers. This type of setup might sound complicated and hard to configure, but it is not as hard as it seems. All that's necessary is to set up multiple Nagios instances along with the NSCA agents or daemons.
There are subtle differences in how various instances need to be configured. Usually, there are one or more Nagios instances that report information to a central Nagios instance. An instance that reports information to another Nagios machine will be referred to as aslave. A Nagios instance that receives reports from one or more slaves will be called a master.
Let's consider a simple organization that has four branches and a headquarters. Each branch is connected to the main office and has a local set of computers. A typical scenario is that a local instance of Nagios monitors the computers and routers in a single branch. The results are then sent to the central Nagios server over an NSCA protocol. These are instances of slave Nagios. If a connection to one of the branches is broken, the local administrators will continue to have access to the status of the local machines. This information is not propagated to the master Nagios server. Setting up the services on the central Nagios server to use freshness checks will cause the central Nagios server to generate an alert when no results are received within a predetermined time frame. Combining this with parent configurations will allow Nagios to accurately determine the root cause of the problems.
The following figure shows how a typical setup in a multiple branch configuration is done. It shows the network topology: which machines are checked by which Nagios servers, and how this information is reported to the central Nagios server.
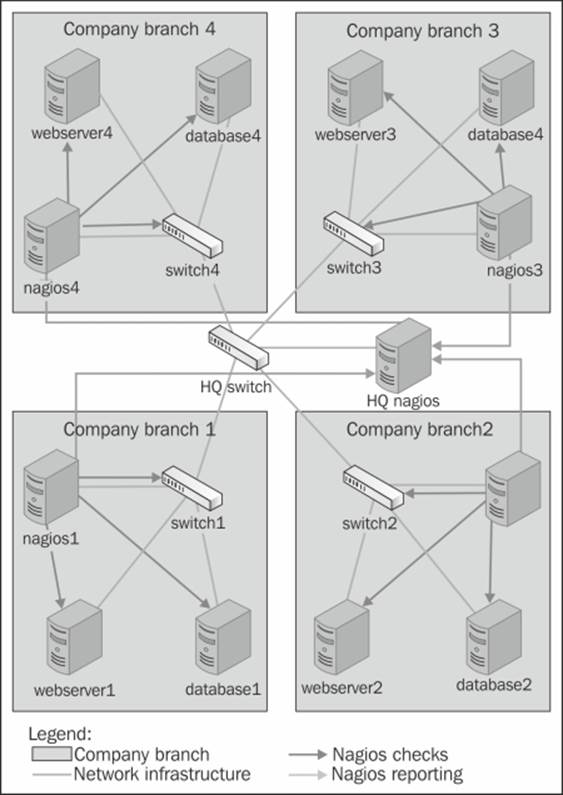
In this example, each branch has a Nagios slave server that monitors and logs information on the local computers. This information is then propagated to the master Nagios server.
Introducing obsessive notifications
Monitoring IT infrastructure using multiple Nagios instances requires a way to send information from slave servers to one or more master servers. This can be done as event handlers that are triggered when a service or a host state changes, however, this has a huge drawback: it necessitates the setup of an event handler for each object. Another disadvantage is that the event handlers are only triggered on actual changes and not after each test is done.
Nagios offers another way to do this through obsessive notifications. These provide a mechanism to run commands when a host or service status is received, regardless of whether it is a passive or an active check result. The mechanism is also set up across the system, which means that the object definitions do not need to be changed in any way for Nagios to send information about their status changes.
Setting up obsessive notifications requires a couple of changes in your configuration. The first one is to define a command that will be run for each notification. An example of this is shown as follows:
define command
{
command_name send-ocsp
command_line $USER1$/send-ocsp 192.168.1.4 $SERVICESTATE$
$HOSTNAME$ '$SERVICEDESC$' '$SERVICEOUTPUT$'
}
The code needs to be entered in a single line in your configuration file. Also, put the actual IP address of the central Nagios server instead of 192.168.1.4 in the preceding example.
We now need to write commands that simply pass the results to the other server over NSCA.
A sample script is as follows:
#!/bin/sh
# args: nsca-server status hostname svcname output
# map status to return code
RC=-1
case "$2" in
OK)
RC=0
;;
WARNING)
RC=1
;;
CRITICAL)
RC=2
;;
esac
echo -e "$3\t$4\t$RC\t$5" | /opt/nagios/bin/send_nsca \
-H $1 -c /etc/nagios/send_nsca.cfg
exit 0
The script first converts the status from text (OK, WARNING, or CRITICAL) to exit codes. It then passes the hostname, service name, exit code, and output from the check to the send_nsca command that sends it to Nagios. The name of the host to send it to is passed as the first argument.The next step is to enable obsessive notifications for services and set up the correct commands to be run in the main Nagios configuration file.
The following are the required parameters along with the sample values that should be set in the main Nagios configuration file (nagios.cfg):
obsess_over_services=1
ocsp_command=send-ocsp
The command name should match the name in the command definition.
That's it! After reloading your Nagios configuration, the send-ocsp script will be run every time a check result comes in.
Configuring Nagios to send host status information is very similar to setting up a service status to be sent. The first thing to do is set up the command that will be run for each notification, which is as follows:
define command
{
command_name send-ochp
command_line $USER1$/send-ochp 192.168.1.4 $HOSTSTATE$ $HOSTNAME$ '$HOSTOUTPUT$'
}
Please note that the command_line directive in the preceding example needs to be specified in a single line.
The script to send information will look exactly like the one for sending the host status information, except that the actual command sent over NSCA will be generated a bit differently. It also converts the status from text to exit codes and passes the hostname (without the service name), exit code, and output from the check to the send_nsca command that sends it to Nagios by sending only the hostname to indicate that it's a host check result:
echo -e "$3\t$RC\t$4" | /opt/nagios/bin/send_nsca \
-H $1 -c /etc/nagios/send_nsca.cfg
In order for Nagios to send notifications to another Nagios instance, we need to enable obsessing over hosts and specify the actual command to use.
Here are some sample directives in the main Nagios configuration file (nagios.cfg):
obsess_over_hosts=1
ochp_command=send-ochp
Restart Nagios after these changes have been made to the configurations. When it restarts, Nagios will begin sending notifications to the master server.
A good thing to do is to verify the nagios.log file to see if notifications are being sent out after a check has been made. By default, the file is in the /var/nagios directory. If the notifications are not received, it may be a good idea to make the scripts responsible to send messages to log this information in either the system log or in a separate logfile. This is very helpful when it comes to debugging instances where the notifications sent out by slave Nagios instances are lost. Writing information to the system log can be done using the logger command (for more details, visit http://linux.die.net/man/1/logger).
Configuring Nagios instances
Setting up multiple servers to monitor infrastructure using Nagios is not easy, but it is not too hard either. It only requires a slightly different approach as compared to setting up a single machine. That said, there are issues with the configuration of hosts and services. It is also necessary to set up all slave and master servers correctly and in a slightly different way.
Distributed monitoring requires a more mature change control and versioning process for Nagios configurations. This is necessary because both the central Nagios server and its branches need to have a partial or complete configuration available, and these need to be in sync across all machines.
Usually, it is recommended that you make the slave servers query both the service and the host status. It is also recommended that you disable service checks on the master Nagios server, but keep host checks enabled. The reason is that host checks are not usually scheduled and are done only when a service check returns a warning, critical, or unknown status. Therefore, the load required to only check the hosts is much lower than the load required to perform regular service checks. In some cases, it is best to also disable host checks. Either the host checks need to be performed regularly or the security policies should disallow checks by the central server.
To maintain Nagios configurations, we recommend that you set up a versioning system such as Git (http://git-scm.com/), Subversion (http://subversion.tigris.org/), or Concurrent Versions System (CVS) (http://www.cvshome.org/). This allows you to keep track of all the Nagios changes and makes it much easier to apply configuration changes to multiple machines. We can store and manage the configuration similar to how we had done it previously. Hosts, services, and the corresponding groups should be kept in directories and separate for each Nagios slave—for example, hosts/branch1 and services/branch1. All other types of objects, such as contacts, time periods, and check commands, can be kept in global directories and reused in all branches—for example, the single contacts,timeperiods, and commands directories.
It's also a good idea to create a small system to deploy the configuration to all the machines, along with the ability to test new configuration before applying it in production. This can be done using a small number of shell scripts. When dealing with multiple computers, locations, and Nagios instances, doing everything manually is very difficult and can get problematic over the long term. This will cause the system to become unmanageable and can lead to errors in actual checks caused by out-of-sync configurations between the slave and master Nagios instances. A very popular tool that is recommended for this purpose is cfengine (http://www.cfengine.com/). There are other tools that can be used for automating configuration deployment, such as Chef(http://www.getchef.com/), Puppet (http://www.puppetlabs.com/), or Ansible (http://www.ansible.com/). They can be used to automate configuration deployment and to ensure that Nagios is up-to-date on all the machines. It also allows for customization; for example, a set of files different from the set on the master server can be deployed on slave servers. If you are already familiar with such tools, we recommend that you use them to manage Nagios deployments. If not, try them out and choose one that best suits you.
The first step in creating a distributed environment is to set up the master Nagios server. This will require you to install Nagios from a binary distribution or build it from sources. Details related to Nagios installation are described in Chapter 2, Installing Nagios 4.
The main changes in a single Nagios set up for a master server are defined in the main Nagios configuration file—nagios.cfg. This file must contain the cfg_dir directives for objects related to all of the slave servers. If not, the master Nagios instance will ignore the reports related to hosts that it does not know about.
We'll also need to make sure that Nagios accepts passive check results for services and that the master Nagios instance does not independently perform active checks. To do this, set the following options in the main Nagios configuration file on the master server:
check_external_commands=1
accept_passive_service_checks=1
execute_service_checks=0
If you also want to rely on passive check results for host checks, you will also need to add the following lines to your main Nagios configuration:
accept_passive_host_checks=1
execute_host_checks=0
You will also need to set up the NSCA daemon on the master Nagios server. Details of how to set this up are described in Chapter 7, Passive Checks and NSCA.
The next step is to set up the first slave server that will report to the master Nagios instance. This also means that you will need to set up Nagios from a binary or source distribution and configure it properly.
All of the slave Nagios instances also need to have the send_nsca command from the NSCA package in order to communicate changes with the master instance. After setting up the NSCA client, we also need to create a configuration to send notifications. It is also a good idea to check whether the sending of dummy reports about an existing host and an existing service works is done correctly.
All of the slave instances need to be set up to send obsessive notifications to the master Nagios server. This includes setting up the OCSP and OCHP commands and enabling them in the main Nagios configuration file. (Obsessive notifications have already been described earlier in the chapter, in the Introducing obsessive notifications section.)
After setting up everything, it's best to run notification commands directly from the command line to see if everything works correctly. Next, restart the slave Nagios server. After that, it is good idea to check the Nagios logs to see if the notifications are being sent out.
It would also be a good idea to write down or automate all the steps needed to set up a Nagios slave instance. Setting up the master is done only once, but large networks may require you to set up a large number of slaves.
Performing freshness checking
We now have set up distributed monitoring set up and the slave Nagios instances should report the results to the master Nagios daemon. Everything should work fine, and the main web interface should report up-to-date information from all of the hosts and services being monitored.
Unfortunately, this is not always the case. In some cases, network connectivity can be down or, for example, the NSCA agents and daemon on the network might fail temporarily, and the master Nagios instance may not even know about it. Based on our assumption that the master Nagios instance is not responsible for monitoring the IT infrastructure, it needs to rely on other systems to do it. Configuration, as described earlier, does not take into account a situation where checks are not sent to the master instance.
Nagios offers a way to monitor whether results have come within a certain period of time. If no report comes within that period, we can specify that Nagios should treat this as a critical state and warn the administrators about it. This makes sense as obsessive notifications are sent out very frequently. So if no notification has come within half an hour, there is a problem with some part of the distributed monitoring configuration.
Implementing this in the master Nagios configuration requires a slightly different approach to the one mentioned in the previous section. The approach in the previous section was to disable service checks completely. This is why all services and/or hosts needed to have their active checks reconfigured for the new approach to work correctly. In this case, it is necessary to enable service checks (and host, if needed) on a global basis in the nagios.cfg file.
For the reasons given above, all of the services and/or hosts that receive notifications from slave Nagios instances need to be defined differently in the master configuration from the definitions that are set for the Nagios slaves.
The first change is that active checks for these objects need to be enabled, but should not be scheduled, that is, the normal_check_interval option should not be set. In addition, the check_freshness and freshness_threshold options need to be specified. The first of these options enables you to monitor whether results are up-to-date and the second one specifies the number of seconds after which the results should be considered outdated.
This means that Nagios will only run active checks if there has been no passive check result for a specified period of time. It is very important that the host and service definitions on both the master and slave instances have the same value specified for thecheck_period directive. Otherwise, the master Nagios instance will raise an alert only for services that are checked during specific time periods. An example could be the workinghours time period, which is not checked on weekends.
For example, the following service definition will accept passive checks but will report an error if they are not present:
define service
{
use generic-service
host_name linuxbox02
service_description SSH
check_command no-passive-check-results
check_freshness 1
freshness_threshold 43200
active_checks_enabled 1
passive_checks_enabled 1
}
The freshness_threshold option specifies the number of seconds after which an active check should be performed. In this case, it is set to 12 hours.
It is also necessary to define a command that will run if no passive check results have been provided.
The following command will use the check_dummy plugin to report an error:
define command
{
command_name no-passive-check-results
command_line $USER1$/check_dummy 2 "No passive check results"
}
It is important to make sure that all of the services and/or hosts are defined, so only dummy checks that report problems (and not actual active checks) are performed. This is different from our previous approach that made sure active checks were not performed.
Using passive checks for regular reporting, and performing active checks when no passive results have been provided, is described in more detail in Chapter 7, Passive Checks and NSCA. The main difference is that in our case, no actual checks will be performed if passive results are not available.
The main drawback of this approach is that it makes the management of configurations on master and slave instances more difficult. We need to maintain the configuration for the master Nagios instance with the service that contains only the dummy freshness checks. However, slave configurations need to have complete check definitions in place.
Using templates for distributed monitoring
In order to avoid reconfiguring all of the objects and managing two sets of configurations, it is possible to use multiple inheritances to manage the configurations efficiently. It can be used to separate parts that are common to both master and slave Nagios instances from information that is local to each Nagios instance. We'll assume each location will have a single Nagios instance, and it will either be a master or a slave.
For each location, there will be local and remote templates. Slave instances will load the local template for its own location and not load the configuration for other locations. Master instance(s) will load the remote template for each location that will report information to this machine.
The actual objects will inherit a template for a specific check—such as the CPU load or the service template monitoring the HTTP server. They will also inherit a location's template— local or remote, as they are the first items in the inheritance list. This will allow the location templates to override all the configuration options.
The local and remote templates will define whether regular checks will be done or if the passive check results should be used. Each Nagios instance will load the local or remote definition of the location template.
For the example mentioned in previous sections, the following would be loaded in branch 1:
cfg_dir=global_configuration
cfg_dir=branch1
cfg_dir=branch1_local
This will cause Nagios to load the definition for the global configuration, which may include users, time periods, generic hosts, and service templates. It will also load the local templates and the definition of objects for branch1. All other branches' configurations will load their respective branch objects.
For master Nagios instances, the loaded configurations will be as follows:
cfg_dir=global_configuration
cfg_dir=branch1
cfg_dir=branch1_remote
cfg_dir=branch2
cfg_dir=branch2_remote
cfg_dir=branch3
cfg_dir=branch3_remote
cfg_dir=branch4
cfg_dir=branch4_remote
This will load the global configuration objects, definitions of objects for all branches, and each branch's remote templates.
Creating the host and service objects
For the example mentioned in previous sections, a typical host definition will be in the branch1 directory and will look as follows:
define host{
use branch1-server
host_name branch1:webserver
hostgroups branch1-servers
address 192.168.0.1
}
The branch1-server will be defined in both the branch1_local and branch1_remote directories. The definition in the branch1_local directory will be as follows:
define host{
register 0
use generic-server
name branch1-server
contact_groups branch1-admins
obsess_over_host 1
}
The definition for the remote location will be as follows:
define host{
register 0
use remote-server
name branch1-server
contact_groups branch1-admins
}
The generic-server can be a typical host template. The remote-server uses this definition, but disables active checks and enables the accepting of passive check results. An example definition of generic-server is as follows:
define host{
register 0
use generic-server
name remote-server
active_checks_enabled 0
passive_checks_enabled 1
notifications_enabled 0
}
With this definition, the host for a local branch will perform active checks if it is alive. The obsess_over_host will cause results to be sent to the master Nagios instance. For remote locations, it will only accept remote check results and will not send any notifications, so each host that is down is only reported from the local Nagios instance.
A typical service is defined as follows:
define service{
use branch1-service,service-http
host_name branch1:webserver
service_description HTTP
}
The service-http service will define a check using check_http and optionally additional options for the check itself.
The local definition for branch1-service will be similar to the following code:
define service{
register 0
name branch1-service
contact_groups branch1-admins
obsess_over_service 1
}
For the remote, it should be as follows:
define service{
register 0
name branch1-service
use remote-service
contact_groups branch1-admins
}
The local definition does not perform many changes in the service. It specifies the default contact group to use for all services and enables obsession over the service—so status updates are sent to the master Nagios instance.
The remote directory uses the remote-service definition, which will disable active checks unless no passive check result is received. For example a remote-service definition can be as follows:
define service{
register 0
name remote-service
active_checks_enabled 0
check_freshness 1
freshness_threshold 43200
check_command check_dummy!3!No recent passive check result
notification_options u
event_handler_enabled 0
}
This runs an active check in case no passive result is received for 12 hours. The active check will simply report an unknown status.
Notification for remote services is only enabled for an unknown status. This send out notifications whenever no active check results are received by the master Nagios instance, but prevents sending of notifications to statuses sent by the slave server as passive check results.
The check_dummy command simply invokes the check_dummy plugin, which reports an UNKNOWN status and a message that no recent result was received. The check_dummy command definition is as follows:
define command{
command_name check_dummy
command_line $USER1$/check_dummy $ARG1$ "$ARG2$"
}
This way, the host and service definitions can be shared for all Nagios instances and the templates for each location determine whether the active checks should be run.
The remote-server and remote-service templates are shared across all Nagios instances, which can be helpful in managing configurations that consist of many branches.
Customizing checks with custom variables
This approach has a downside: each service check has to be defined as a template. However, Nagios custom variables can be used to allow the fine-tuning of the service check for each object. For example, for the HTTP check, it could be as follows:
define command{
command_name check_http_port
command_line $USER1$/check_http -H $ARG1$ -p $ARG2$
}
define service{
use generic-service
name service-http
register 0
check_command check_http_port!$_SERVICEHOSTNAME$!$_SERVICEHTTPPORT$
_HTTPPORT 80
}
This allows us to override the port to use the HTTP checks by specifying _HTTPPORT in the actual service as follows:
define service{
use branch1-service,service-http
host_name branch1:webserver
service_description HTTP on port 8080
_HTTPPORT 8080
}
Summary
Nagios offers multiple ways of monitoring the Microsoft Windows workstations and servers. These vary from monitoring computers remotely and querying SNMP, to installing dedicated agents. Another very interesting feature of Nagios is its ability to effortlessly configure multiple machines in order to perform monitoring and to have a single place where the results are easily available.
In this chapter, we have learned how to install the NSClient++ agent that can be used to monitor Microsoft Windows based machines and using Nagios.
We have also learned different ways in which checks can be performed— for example, using the check_nt plugin, using the NRPE protocol, or scheduling the checks on the agent and sending the results using the NSCA protocol.
This chapter also covered how to set up multiple Nagios instances and a Nagios instance so that it reports all host and services status updates to another Nagios instance. This can be used to split the load related to actually performing the checks. It can also be a solution to the firewall and security policies. A local instance can query all the machines in the same location and report to the central server.
We have also learned how to use templates and multiple inheritance to create a single configuration for all types of Nagios instances—both slaves that send status updates and a master instance that receives the status update, but does not independently perform checks.
The next chapter will talk about how to write your own Nagios plugins to monitor services that require customized checks. It will also describe how to create your own plugins using various programming languages.
All materials on the site are licensed Creative Commons Attribution-Sharealike 3.0 Unported CC BY-SA 3.0 & GNU Free Documentation License (GFDL)
If you are the copyright holder of any material contained on our site and intend to remove it, please contact our site administrator for approval.
© 2016-2026 All site design rights belong to S.Y.A.