Learning Nagios 4 (2014)
Chapter 3. Using the Nagios Web Interface
The previous chapter has described how to set up and configure Nagios. Now that our Nagios system is up and running, it will also send out notifications to people if something goes wrong. What we need now is a way to view current and historical information on which hosts and services are failing. Nagios offers just that! It comes with a web interface that can be used to view the status of all hosts and services, read logs, generate reports, and so on. And that's just a small part of its functionality.
Using any browser, you can access almost any information Nagios stores, such as status, performance data, history, and logs. You can check all of your hosts and services to find out whether they are working correctly with just a few clicks. The interface also offers the ability to change parts of configuration on the fly.
The ability to check the status of all the hosts and services is a very valuable functionality. Usually, a notification that shows something is wrong should just be a trigger to investigate the problem. Being able to see the big picture via various views of the web interface is very useful. You can use different detailed views and see what is not working properly.
Nagios can also show you a tree of your infrastructure that includes parent-host mappings. It's a great way to see which machines are down and which are assumed to be unreachable. In larger systems, where there are lots of dependencies, being able to see it clearly is very useful.
In this chapter, we will cover the following items:
· Setting up the web interface using Apache 2 server
· Checking the overall status with tactical overview
· Managing hosts and services
· Scheduling downtimes and adding comments
· Viewing Nagios information and generating reports
· Customizing the Nagios web interface and using third-party Nagios web interfaces
Setting up the web interface
The Nagios web interface is part of main Nagios sources and binary distributions. Therefore, if you installed Nagios, you will also have the web interface files. The only thing that you need is a web server with CGI and PHP support; in our case, this will be Apache 2 (visit http://httpd.apache.org/ for more details).
Nagios web interface uses CGI (Common Gateway Interface), a standard to generate dynamic websites (visit http://httpd.apache.org/docs/current/howto/cgi.html for more details), to work as it is the most commonly offered way to run applications. It also allows a flexible setup in terms of security as CGI binaries can be run as different users from the one the web server is running as.
Nagios web interface also uses additional files such as many static HTML pages and CSS and images. Starting with Nagios 4, PHP (PHP: Hypertext Preprocessor), a scripting language for web development (see http://php.net/ for more details), is used to aid in configuring the web interface HTML pages.
As described in the previous chapter, Nagios CGI scripts need to be able to write to the Nagios external command pipe. If you have followed the installation instructions contained in Chapter 2, Installing Nagios 4, your Apache server already has the correct access rights. If you set up Nagios on your own, you need to make sure your web server can write to the Nagios pipe. Please check your external command pipe permissions and make sure, for our installation parameters, the file is called /var/nagios/rw/nagios.cmd and is writable by the nagioscmd group. It needs to be writable by the user your web server is running as, so it is best to add your web server user to the group owning the file.
Configuring the web server
By default, all Nagios HTML and other static files that are used by the web interface are copied into the share subdirectory of the Nagios installation and all CGI binaries go into the sbin subdirectory. Assuming Nagios has been configured using the default directories used in the previous chapter, the files paths would be /opt/nagios/share and /opt/nagios/sbin respectively.
Nagios uses PHP files for static pages. PHP is mainly used for formatting HTML pages and Nagios uses PHP to allow configuring Nagios file and script locations such as the paths to the Nagios configuration file, the status file, and CGI configuration file and the URL to CGI files.
In order to run the web interface, PHP has to be enabled on the web server. In case of Apache running on Ubuntu or CentOS, installing the PHP package automatically will enable PHP on the web server.
If you're using other distributions, have installed Apache manually, or are using another web server, please make sure that PHP is enabled. It needs to be enabled either globally or for the virtual host that the Nagios web interface will be used for. The PHP documentation (visit http://php.net/manual/en/install.php for more details) describes enabling PHP for various operating systems and servers in detail.
If you installed Nagios from a binary distribution, it may have configured a web server so that it is accessible. In that case, the package management should have asked you for a password to access the Nagios web interface. You should start by trying to accesshttp://127.0.0.1/nagios/ from the machine that has Nagios installed. It should prompt you for a username and password. The main Nagios administrator is called nagiosadmin and the password will be the one you supplied during package installation. You should skip this section and proceed to the next ones that describe how Nagios web interface works.
If you have followed steps in the previous chapter to install Nagios, all that's needed is to configure Apache to use proper aliasing and create a valid user that will be able to access Nagios.
The following instructions assume that your Apache configuration is under /etc/apache2 and that your web server will read all configuration files under /etc/apache2/conf.d. In case your paths are different, please modify paths in the following examples accordingly.
The first thing that we will do is create a configuration file called /etc/apache2/conf.d/nagios. We will need to add an alias to the folder /nagios that will point to /opt/nagios/share and add CGI scripts under /nagios/cgi-bin to point to /opt/nagios/sbin:
ScriptAlias /nagios/cgi-bin /opt/nagios/sbin
Alias /nagios /opt/nagios/share
Next, we need to set up password protection for the Nagios web interface. We can also limit IP addresses able to access the site. To do this, add the following directives to the nagios file located in /etc/apache2/conf.d/:
<DirectoryMatch /opt/nagios/share>
Options FollowSymLinks
AllowOverride AuthConfig
Order Allow,Deny
Allow From All
AuthName "Nagios Access"
AuthType Basic
AuthUserFile /etc/nagios/htpasswd.users
AuthGroupFile /etc/nagios/htpasswd.groups
require valid-user
</DirectoryMatch>
<DirectoryMatch /opt/nagios/sbin>
Options ExecCGI
AllowOverride AuthConfig
Order Allow,Deny
Allow From All
AuthName "Nagios Access"
AuthType Basic
AuthUserFile /etc/nagios/htpasswd.users
AuthGroupFile /etc/nagios/htpasswd.groups
require valid-user
</DirectoryMatch>
If you want to limit hosts that will be able to access the Nagios web interface, you can replace the Order and Allow directives in both DirectoryMatch definitions as follows:
Order Deny,Allow
Deny From All
Allow From 192.168.0.0/16
This will only allow access to Nagios website from IP addresses starting with 192.168.
Creating an administrative user for Nagios
We now need to add an administrative user for the web interface. We must also add this user to Nagios configuration as the authorized username will be used by the web interface to check permissions and perform actions as this user.
By default, Nagios configuration specifies nagiosadmin as a user who is authorized to access all parts of the Nagios web interface. Therefore, we will now create such a user in the nagiosadmin.cfg file located in /etc/nagios/contacts/:
define contact{
contact_name nagiosadmin
alias Nagios Administrator
contactgroups admins
email youremail@yourcompany.com
host_notification_period 24x7
service_notification_period 24x7
host_notification_options n
service_notification_options n
host_notification_commands notify-host-by-email
service_notification_commands notify-service-by-email
}
Even though notifications have been disabled for this user, we should also set the email field to a valid e-mail address.
The configuration for the user authorized to perform all actions is stored in the cgi.cfg file in /etc/nagios. This file was created when we were installing Nagios by the make install-config command. Nagios CGI uses the configuration file.
The following lines in the file define an administrative user:
authorized_for_system_information=nagiosadmin
authorized_for_configuration_information=nagiosadmin
authorized_for_system_commands=nagiosadmin
authorized_for_all_services=nagiosadmin
authorized_for_all_hosts=nagiosadmin
authorized_for_all_service_commands=nagiosadmin
authorized_for_all_host_commands=nagiosadmin
This can be used to define one or more users that have full access to the configuration. Multiple users can be specified, separating each user with a comma in this manner: jdoe,nagiosadmin.
We should now create the files that will be used by the web server for authorization. We will need to run the following commands to set these up:
# cp /dev/null /etc/nagios/htpasswd.groups
# htpasswd -c /etc/nagios/htpasswd.users nagiosadmin
When prompted for the password, please specify the password you want to use.
We now need to set the ownership of the file appropriately so that it can only be read by the web server, not regular users. For an installation made according to instructions in the second step, the user that the web server runs is already added to the nagioscmdgroup, so we can simply set the owning group to nagioscmd and make it readable for the group. For example:
# chown root:nagioscmd /etc/nagios/htpasswd.*
# chmod 0640 /etc/nagios/htpasswd.*
The last thing that needs to be done is to restart Apache and Nagios by invoking the following commands:
root@ubuntu:~# service apache2 restart
root@ubuntu:~# service nagios restart
These commands will restart both services. The Nagios restart was required because we created a new user in the Nagios configuration.
Accessing the web interface
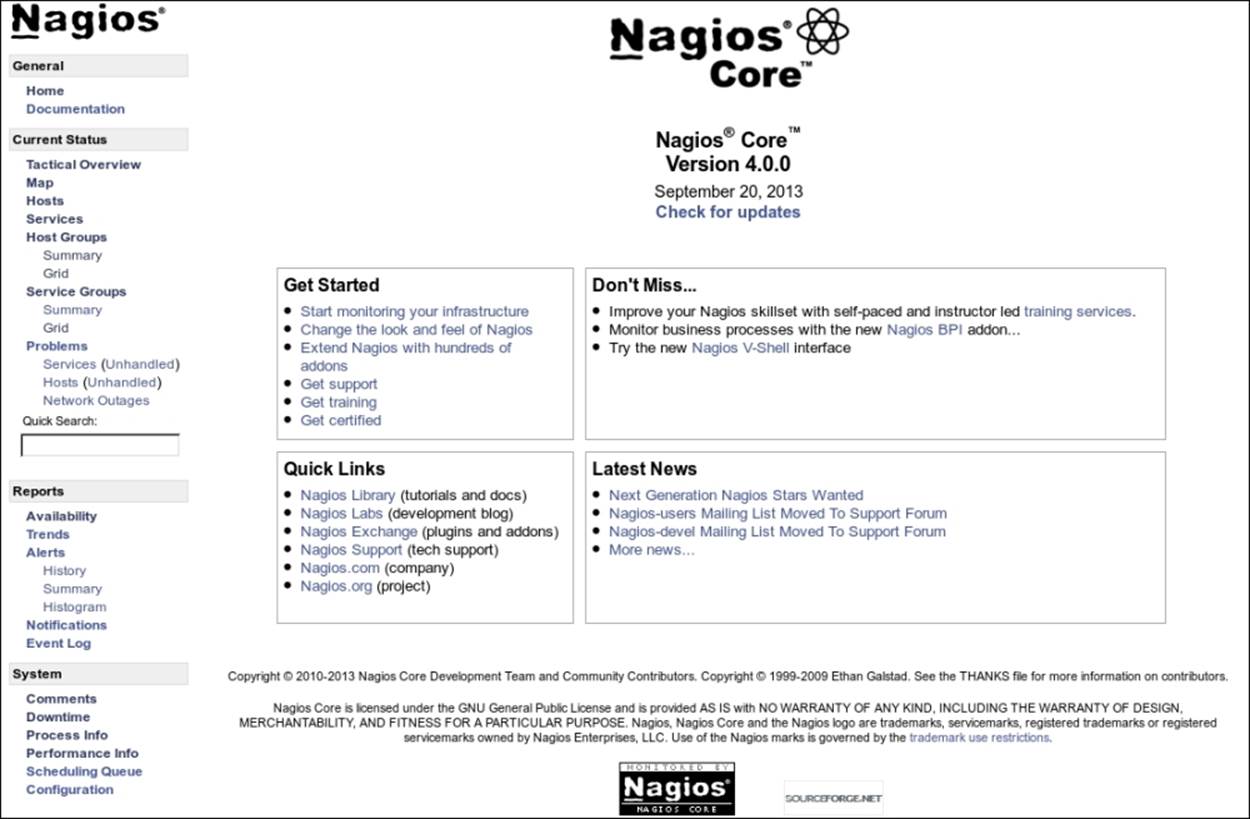
After restarting the web server, we can access the Nagios web interface by going to http://127.0.0.1/nagios/ from the machine Nagios is running on. It will prompt for a username and password; use the credentials from the previous example. After a successful login, you should see a welcome screen similar to this one:
Troubleshooting
There might be cases where accessing the Nagios URL shows an error instead of showing the welcome screen. If this happens, it can be due to many things: the web server may not be started, the Nagios-related configuration setup may have been incorrect, incorrect permissions may have been set on directories, and so on.
The first thing that we should check is whether Apache is working properly. We can manually run the check_http plugin from Nagios. If the web server is up and running, we should see something similar to the following output:
# /opt/nagios/plugins/check_http -H 127.0.0.1
HTTP OK HTTP/1.1 200 OK - 296 bytes in 0.006 seconds
Likewise, if Apache is not currently running, the plugin will report an error similar to this:
# /opt/nagios/plugins/check_http -H 127.0.0.1
HTTP CRITICAL - Unable to open TCP socket
If Apache was stopped, start it by running the following command:
root@ubuntu:~# service apache2 start
The next step is to check whether the URL http://127.0.0.1/nagios/ is working properly. We can also use the same plugin for this. The -u argument can specify an exact link to access, and -a allows specifying the username and password to authorize. It is passed in the form <username>:<password>.
# /opt/nagios/plugins/check_http -H 127.0.0.1 \
–u /nagios/ -a nagiosadmin:<yourpassword>
HTTP OK HTTP/1.1 200 OK - 979 bytes in 0.019 seconds
We can also check actual CGI scripts by passing a URL to one of the scripts:
# /opt/nagios/plugins/check_http -H 127.0.0.1 \
–u /nagios/cgi-bin/tac.cgi -a nagiosadmin:<yourpassword>
HTTP OK HTTP/1.1 200 OK - 979 bytes in 0.019 seconds
If any of these checks returned any other HTTP code than 200, it means that there is a problem.
If the code is 500, it means that Apache is incorrectly configured. In such cases, the Apache error log contains useful information about any potential problems. On most systems, including Ubuntu Linux, the file is /var/log/apache2/error.log. An example error log could be:
[error] [client 127.0.0.1] need AuthName: /nagios/cgi-bin/tac.cgi
In this particular case, the problem is the missing AuthName directive for CGI scripts.
Internal errors can usually be resolved by making sure that the Nagios-related Apache configuration is correct. If you followed installation steps from this and the previous chapter, the Apache configuration should be exactly the same as in the previous examples.
If this does not help, it is worth checking other parts of the configuration, especially those related to virtual hosts and CGI configuration. Commenting out parts of the configuration can help to determine which parts of the configuration are causing problems.
Another possibility is that either checks for /nagios/ or /nagios/cgi-bin/tac.cgi, URL returned code 404. This code means that the page was not found. In this case, please make sure that Apache is configured according to the previous steps.
If it is, then it is a good idea to enable more verbose debugging to a custom file. The following Apache 2 directives can be added to either /etc/apache2/conf.d/nagios or any other file in the Apache configuration:
LogFormat "%h %l %u \"%r\" %>s %b %{Host}e %f" debuglog
CustomLog /var/log/apache2/access-debug.log debuglog
The first entry defines a custom logging format that also logs exact paths to files. The second one enables logging, with this format, to a dedicated file. An example entry in such a log would be as follows:
127.0.0.1 - - "GET /nagios/ HTTP/1.1" 404 481 127.0.0.1 /var/www/nagios
This log entry tells us that http://127.0.0.1/nagios/ was incorrectly expanded to /var/www/nagios. In this case, the Alias directive describing the /nagios/ prefix is missing. Making sure that the actual configuration matches the one provided in the previous section will also resolve this issue.
Another error that you can get is 403, which indicates that Apache was unable to access either CGI scripts in /opt/nagios/sbin or Nagios static pages in /opt/nagios/share. In this case, you need to make sure that these directories are readable by the user running Apache.
It might also be related to the folders above /opt/nagios or /opt in the folder tree. One of these might also be inaccessible to the user running Apache, which will also cause the same error to occur.
If you run into any other problems, it is best to start with making sure that the Nagios-related configuration matches the examples from the previous section. It is also a good idea to reduce the number of enabled features and virtual hosts in your Apache configuration.
Using the web interface
The Nagios web interface always offers a menu in the left-hand frame, and current information is shown in the remaining area. You can easily access all views from the left-hand menu.
In case you want to replace the standard Nagios welcome screen with your own, all that's needed is to change the /opt/nagios/share/main.php file. As this page is shown to everyone after they log in correctly, it can be used to provide administrators with some guidelines on how Nagios monitoring is used within their company and what should be done in certain circumstances. It can also be used to define links to commonly checked hosts or commonly accessed services.
It is also possible to extend the left-hand menu, which is defined in the side.php file located at /opt/nagios/share/. This way, quick links can be added to the menu and/or unused functionalities can be removed from it.
Throughout the rest of this chapter, we will use configuration that is far more complex than the one we created in the previous chapter. This will allow us to show more functionality in Nagios and its web interface.
Checking the tactical overview
Nagios offers a panel that shows an overall status of all hosts, services, and other features. It can be accessed by clicking on the Tactical Overview link in the left-hand menu. You can easily assess the scale of problems—the number of hosts and services failing, flapping and pending checks, and so on. It also shows how many hosts are unreachable due to other hosts being down.
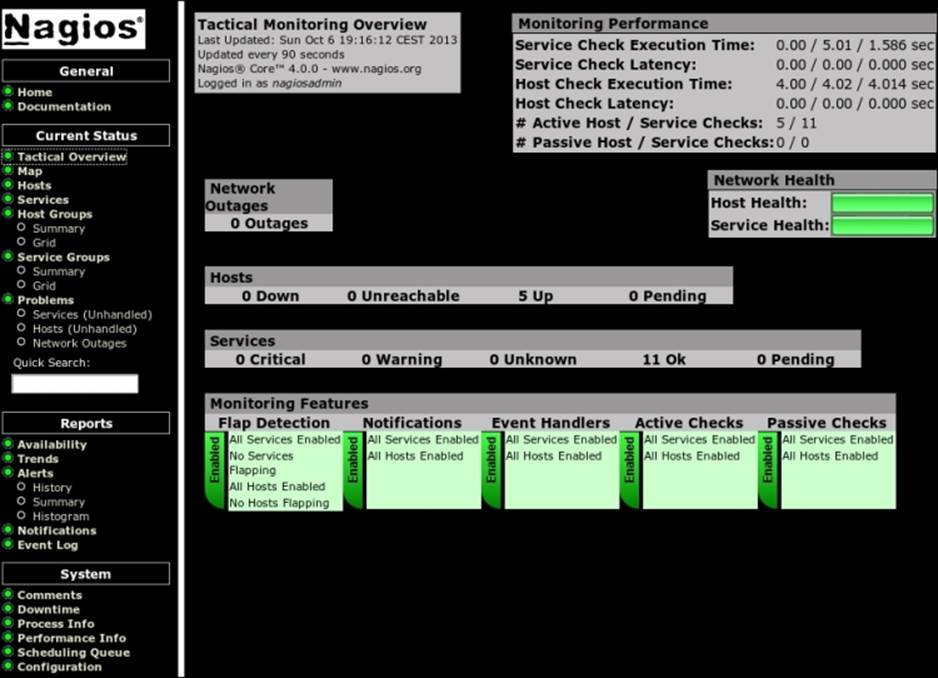
The following is a screenshot of the Tactical Monitoring Overview page:
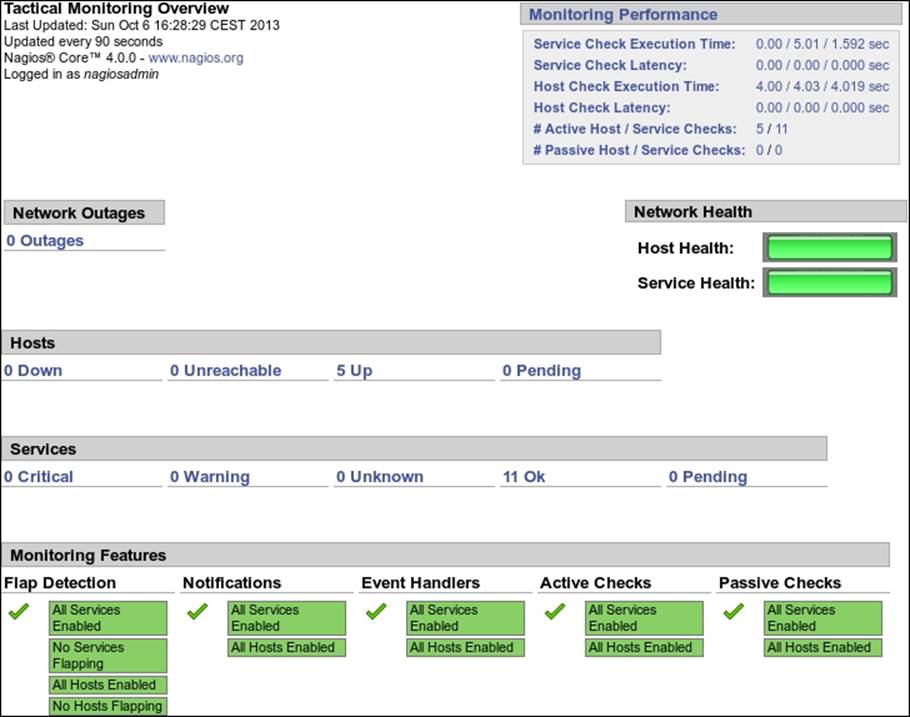
Tactical overview presents you with overall information on Nagios and monitoring. The page reports on host and service conditions. It shows how many hosts and services are in which status. It also shows if any hosts and services have their checks, notifications, or event handlers disabled.
The top-right corner shows performance information. It shows details on checks that have been performed and reports latencies when performing checks and the average time that it takes to perform checks. These values are pretty important because if there are too many checks scheduled, Nagios might not be able to perform some of them. Usually, you should tweak your Nagios installation in cases where the latency is more than a couple of seconds.
Below the performance information is a status showing host and service health, as in the previous screenshot. It contains bars showing the number of hosts and services that are in the Ok state. Since all services are currently working properly, the bar spans to full width and is green. If some hosts or services are not working, the color of the bar changes to yellow or red accordingly.
Tactical overview can also be used to view the hosts or services lists filtered to only specific criteria. Clicking on any status-count text in the Network Outages, Hosts, or Services sections will show a list of hosts or services with the specified status. If we click on 11 Ok in the Services section, it will show a list of all services with the status Ok.
Viewing the status map
Nagios allows showing a graphical map of host parent-child relations along with statuses. It can be accessed by clicking on the Map link in the left-hand menu. This can be used to keep track of hosts along with their statuses so that you can see how a host being down causes other parts of your network to be unreachable.
The following is a screenshot of a status page:
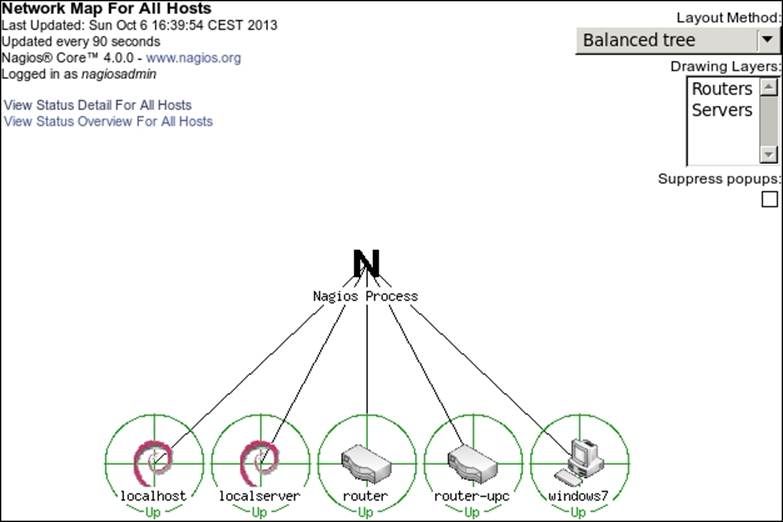
The status page can be shown in many ways. The preceding screenshot shows a circular tree of all hosts. It is possible to also display a top-down tree of all hosts.
Managing hosts
Nagios offers several pages that can be used to view and modify host information. The Nagios web interface offers a view of all defined hosts, their statuses, and basic information. These can be used to determine the statuses of hosts. Hostgroup-related views also show the statuses for services bound to hosts. Host information pages also offer modifying several parameters related to host configuration.
Checking statuses
Nagios offers a panel that shows all hosts along with their statuses. It can be accessed by clicking on the Hosts link in the left-hand menu.
The following screenshot reports five hosts, all of which are currently up:
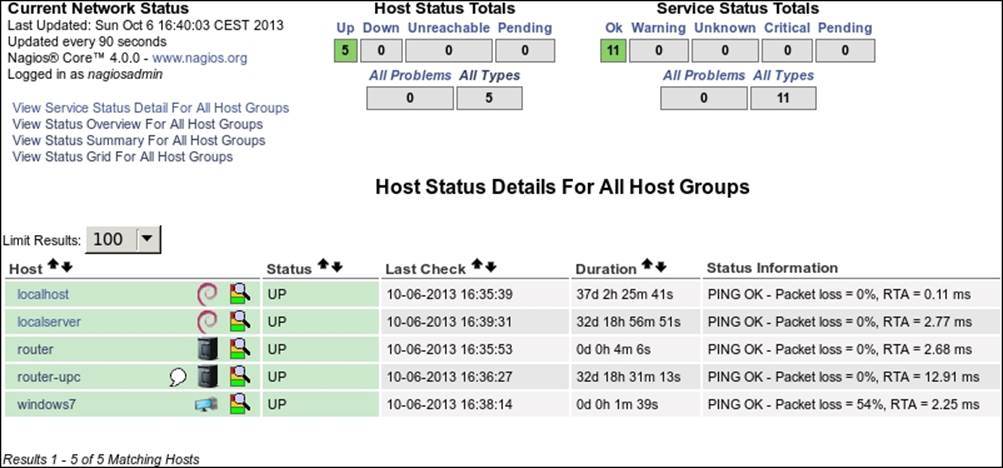
The page shows a list of all hosts, their statuses, and basic information, such as when the host was last checked and when the status last changed. It also shows the information text response from the check. The order of how the table is shown can be changed by using the arrow buttons next to each column's header.
As with the tactical overview page, the totals on the top of the page can be used to filter hosts or services to only display those with specific statuses. After clicking on any status type in the Host Status Totals table, the list of hosts is filtered down to only the ones that currently have that status. Clicking on any status type in Service Status Totals will show a list of services filtered only to the ones that currently have that specified status.
There is also a quick jump menu on the left that allows you to move to a list of all services and views related to host groups.
Nagios also offers three views that show the statuses of all host groups. One of these views is the status grid, which shows host groups along with hosts in them, and each service for that host along with its status. It can be accessed by clicking on the Grid option under the View Status Grid For All Host Groups link in the left-hand menu.
The following is a screenshot of such a status grid view:
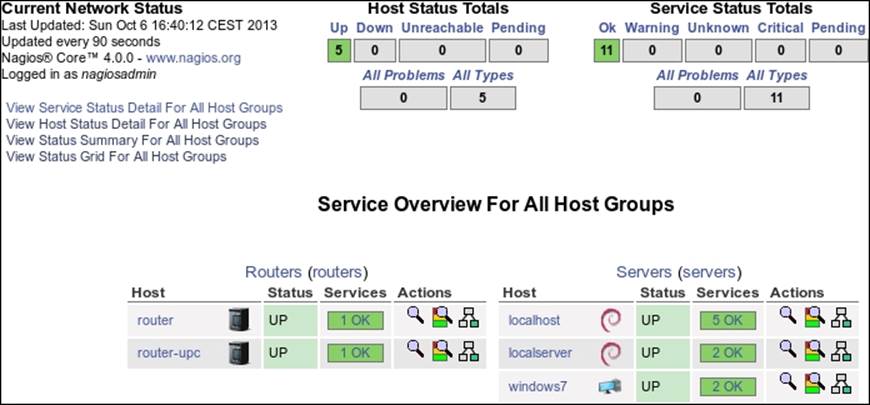
As with the previous view, clicking on the Host Status Totals or Service Status Totals table options will cause Nagios to filter results according to the specified criteria. The page also contains a quick jump menu on the left that can be used to change the currently selected view.
Clicking on any host group description will display a list of all services on all hosts within that group.
Clicking on a host group name, which is specified in brackets, will show a host group menu that allows modifying attributes for all hosts or services related to that host group.
Clicking on a host name in any host- or service-related view will cause Nagios to show detailed information about the chosen host.
Viewing host information
Clicking on a host in any view of the web interface will take you to the host information page. It contains details on current host status, a list of comments, and a commands panel that allows modifying host configuration, scheduling checks, or sending custom notifications.
The following is a screenshot of the host information page:
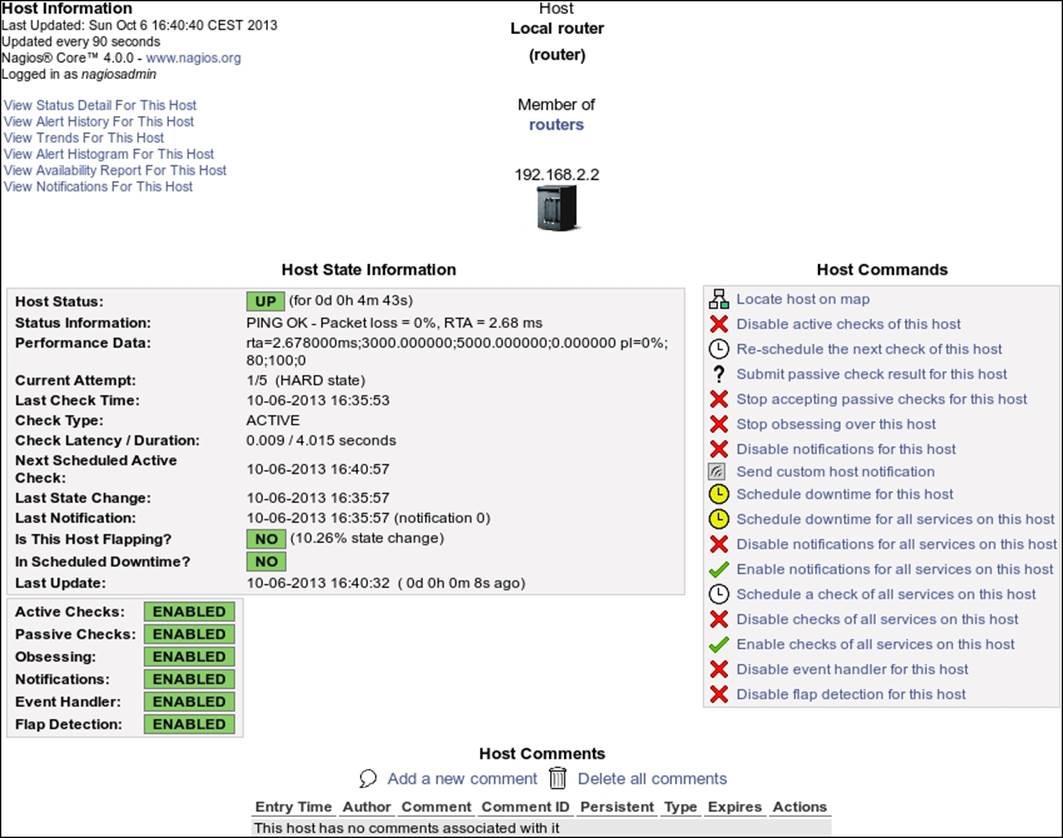
This page contains detailed information on the selected host. It shows the current status and host checks that have been or will be performed. It also contains information on what functionality is enabled or disabled for the specified host, whether the host is flapping along with flapping threshold value.
The menu on the right can be used to perform operations related to this host. It allows toggling between whether active checks should be performed, whether Nagios should accept passive check results, and whether it should detect flapping. You can also configure whether Nagios should obsess over a host or send notifications and events. It is also possible to view options for all services bound to this host. There is also an option to schedule checks for a host or all services bound to this host. You can also submit passive check results over the web interface.
The host information page also allows reading and modifying all comments related to this host. All current comments are listed under the Host Comments section. Clicking on the trash icon under the Actions column will delete a comment. You can also delete all comments and add a new comment bound to this host.
Managing services
As with host-related information and operations, Nagios has panels for working with services. It consists of several service and service-group views that allow you to view detailed information on each service and modify its parameters.
Checking statuses
The Nagios web interface offers a view of all defined services, their statuses, and basic information. It can be accessed by clicking on the Services link in the left-hand menu.
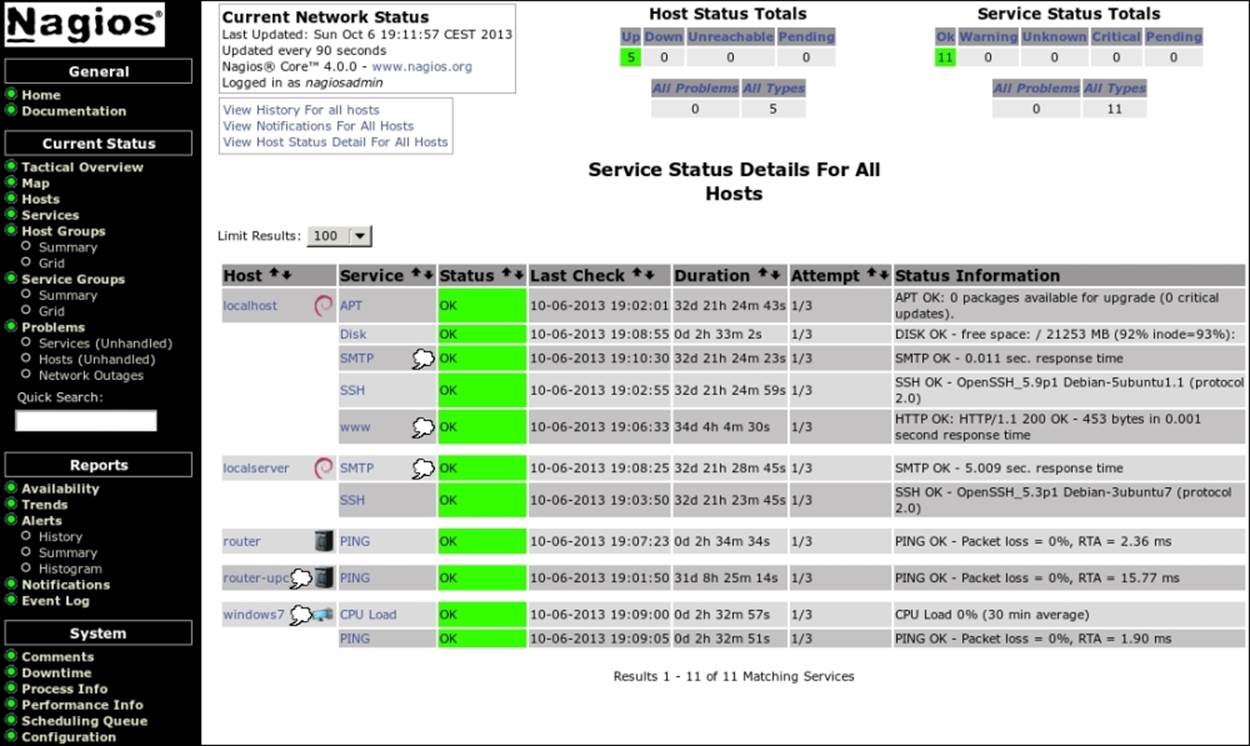
The following is a screenshot reporting 11 services, all of which are currently working correctly:
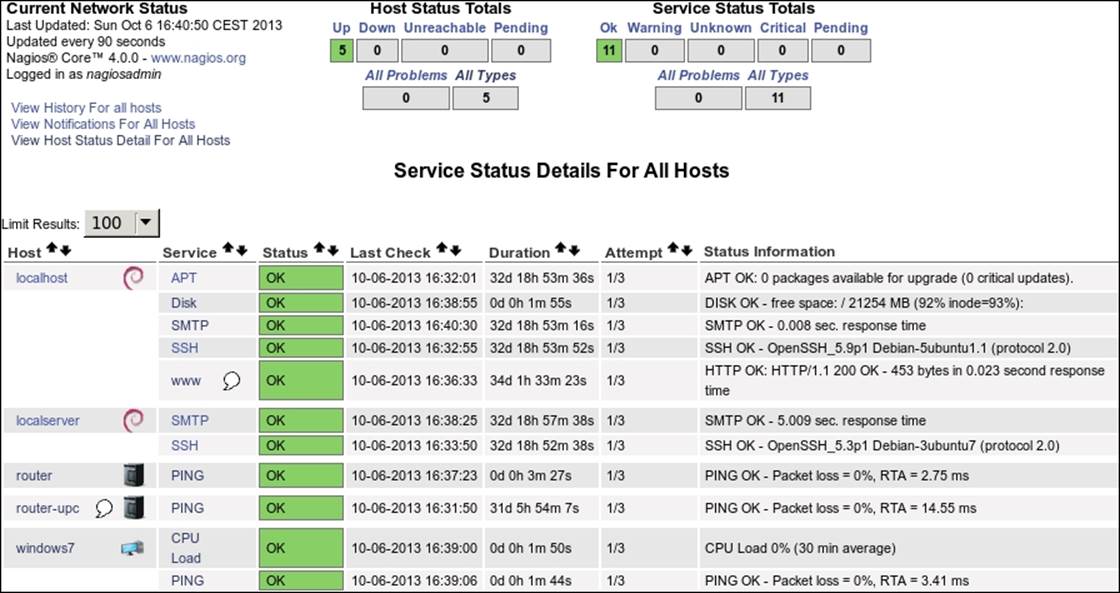
The main part of the page is the table showing all services along with their statuses and detailed information on the output from checks.
The default order by which the table is sorted is that all services are grouped by the hosts they are configured for, and they are sorted by service description. It is possible to sort the table according to your needs by clicking on the arrows in the headers for any column of the table.
Above the table, there are total values for each host and service status. You can also filter the service table using these values to only show specific statuses or services for hosts with a specific status.
The page also contains a quick menu that allows navigation to commonly used views. It allows jumping to history and the notification log, as well as navigating to a list of all hosts along with their detailed statuses.
Clicking on any host will take you to a host information page for the selected object. Similarly, clicking on any service will display a detailed information page for that object.
Another interesting view is a summary of all the services specified for each service group. It can be accessed by clicking on the View Service Status Grid For All Service Groups option on the left-hand menu.
The following is a screenshot of the page:
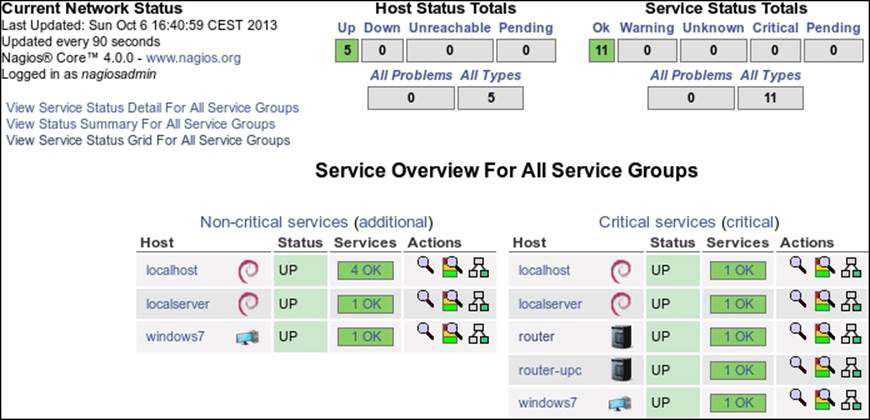
It shows each service group along with the count of all the services for each status. The page contains a status summary for all services that are members of a specific service group. It also shows a status summary for all hosts that have at least one service configured.
Clicking on any status summary column will show a list of all the services in that group along with detailed information about them. Clicking on a service group will show an overview of services split into individual hosts.
Viewing service information
Clicking on a service in any view of the web interface will take you to the service information page. It contains details on the current service status, a list of comments, and a commands panel that allows modifying service configuration, scheduling checks, or sending custom notifications.
The following is a screenshot of the service information page:
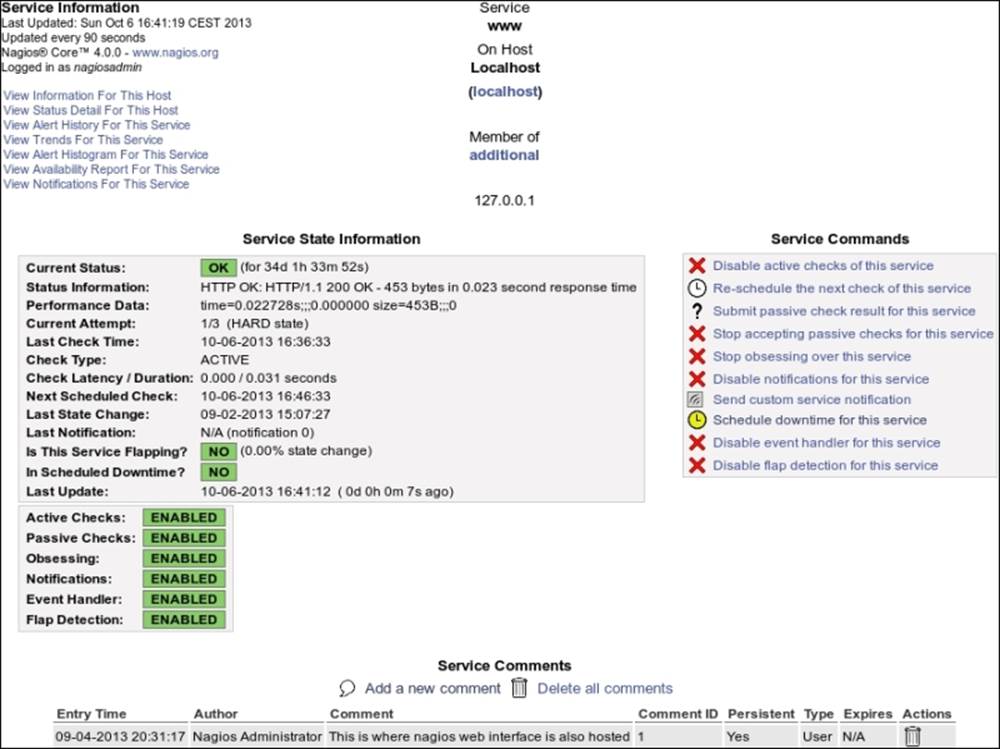
The main table on the left shows detailed information on the service, such as current status, output from the check, and detailed information on the last and next planned check. The page also shows whether the service is flapping along with the flapping threshold and when the last notification was sent out.
The menu on the right allows modifying whether checks should be performed, whether notifications and events should be done, and whether Nagios should obsess over this service. There is also an option to schedule when the next check is to be performed.
On the bottom, there is a Service Comments section containing a table that shows all existing comments related to this service. This is similar to the host information page. It is also possible to add a comment and delete a single comment or all comments related to this service.
Managing downtime
Nagios allows using the web interface to manage scheduled downtimes for hosts and services. This includes listing, adding, and deleting downtimes for both hosts and services.
Checking downtime statuses
The Nagios web interface allows listing all scheduled downtimes. This page can be accessed by clicking on the Downtime link on the left-hand menu. The following is a screenshot of the page:
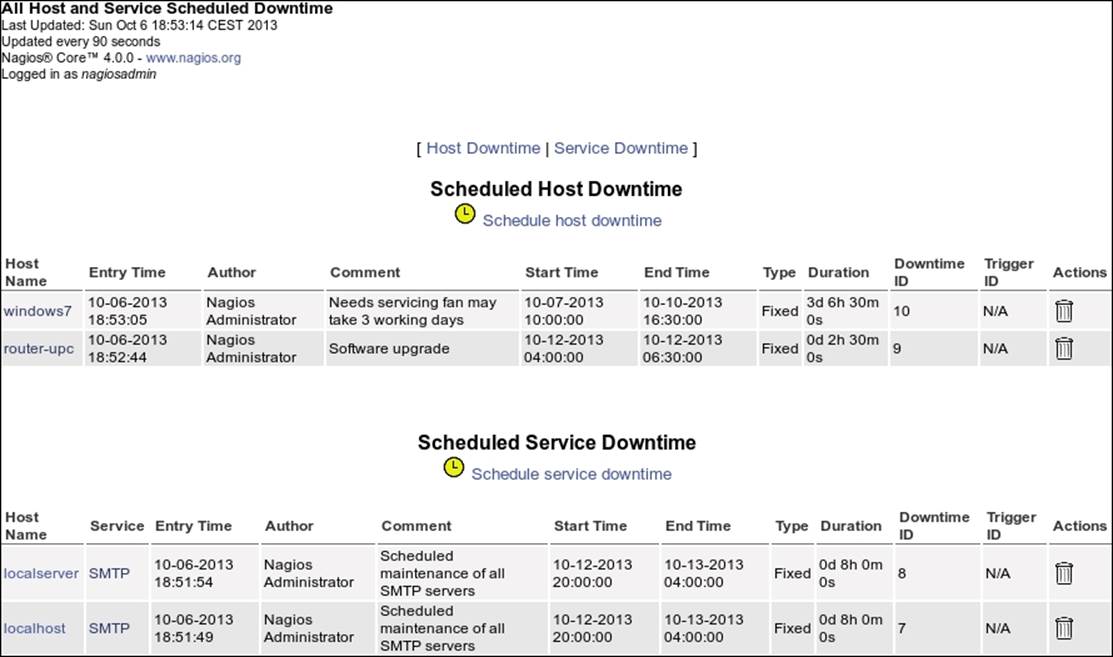
The page consists of two pages of all scheduled downtimes, for hosts and services separately. You can delete a downtime by clicking on the trash icon on the right, in the row that describes this particular downtime entry.
Downtimes can be triggered by other downtimes. When a host downtime is scheduled, Nagios automatically adds downtimes for all child hosts.
Scheduling downtime
In order to schedule a downtime, open a host or service information page and use the Schedule downtime for this host or Schedule downtime for this service options. It is also possible to use the downtime page to schedule downtimes directly. In that case, you will need to know the host name and service description of the service you want to disable, as Nagios will not fill these in automatically.
The following is a screenshot of scheduling downtime for a service:
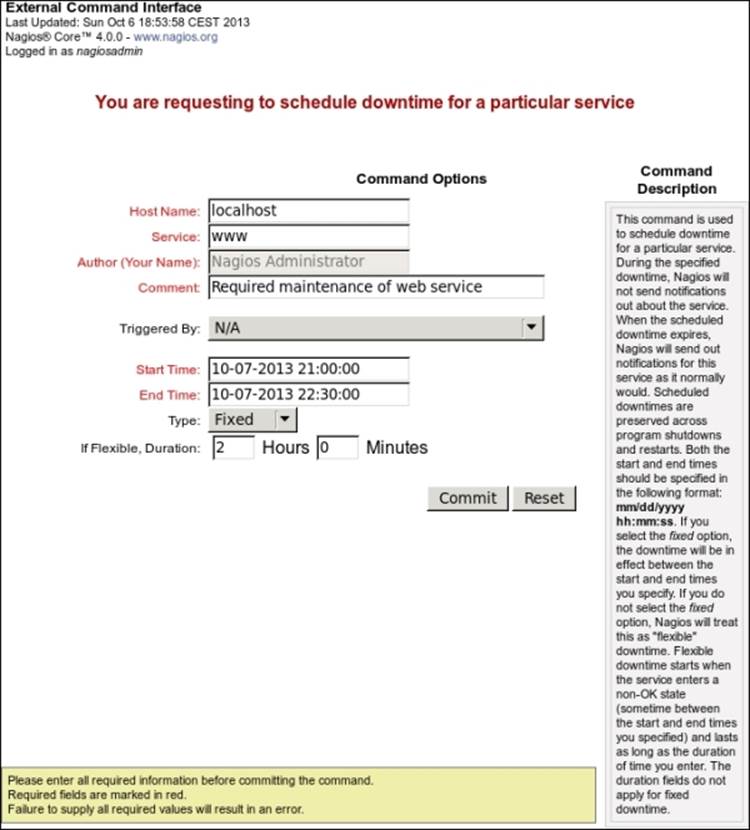
The form consists of fields for the host and service names, a comment, and an optional drop-down list to choose a downtime that triggered this host/service. When specifying the time during which a downtime should be scheduled, it is possible to fill the Start Timeand End Time fields or use the Duration field. If you want to specify how long the duration will be, choose Flexible in the Type field. Otherwise, choose Fixed to specify start and end time.
Scheduling downtime for a host is very similar. The only differences are that the Service field is missing and the Child Hosts drop-down list is added to specify how child hosts should be handled.
Nagios can automatically schedule downtimes for child hosts. When scheduling host downtime, an additional option is present to specify whether child hosts should also be scheduled for downtime, and set to be triggered by this downtime.
Managing comments
Nagios allows inserting one or more comments associated with a host or a service. These can be anything from "third machine from top on the left shelf" to "reset button not working". Nagios also adds comments automatically in several cases; for example, when an object is scheduled for downtime, a comment is placed about it.
Comments associated with a specific object are shown on the host and service detail information pages. It can also be added and removed from these very pages.
Nagios also offers a page that allows managing comments for all hosts and services, which is similar to managing scheduled downtimes. It allows adding and deleting comments for all hosts. You can also navigate to the detailed information page for hosts and services by clicking on an object name. The page can be accessed via the Comments link on the left-hand menu.
The following is a screenshot of the comments page:
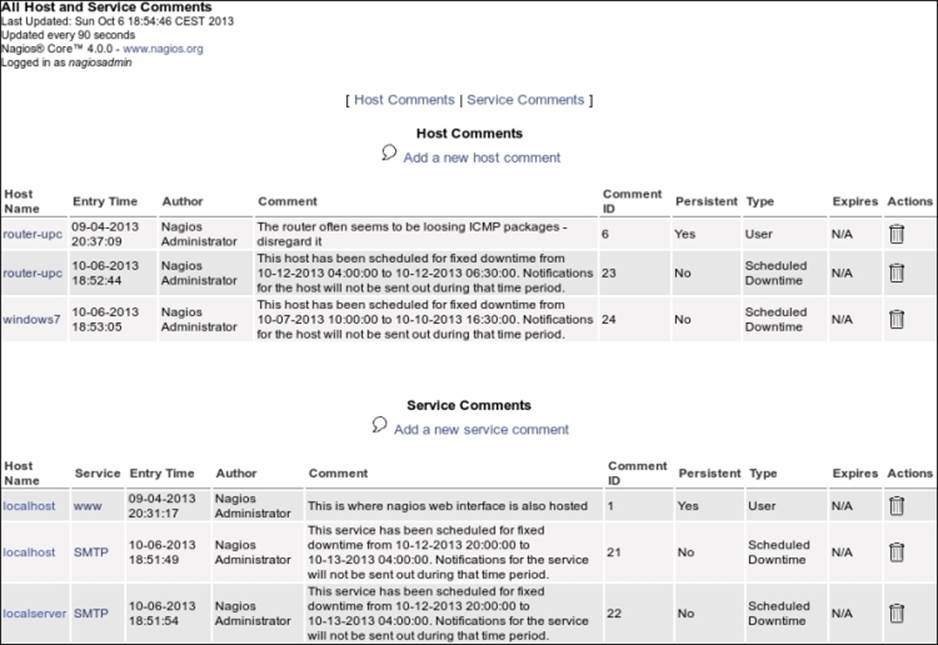
Clicking on the trash icon next to any comment will delete it. Adding a comment can be done by clicking on a host or service name and then doing so from the detailed information page, or by clicking on Add a new service comment above the table with comments. In the latter case, you will need to specify host name and service description yourself in the add comment form.
Nagios information
The web interface allows checking the Nagios daemon status along with general information on features enabled and disabled. It also allows checking performance information related to Nagios. This can be used to make sure that your Nagios interface is not overloaded with checks to perform, as well as seeing how long the checks take and how often they're performed.
Viewing process information
The Nagios Process Information page shows generic information about Nagios processes. It also allows performing several actions from the Process Commands panel. The following page can be accessed via the Process Info link on the left-hand menu:
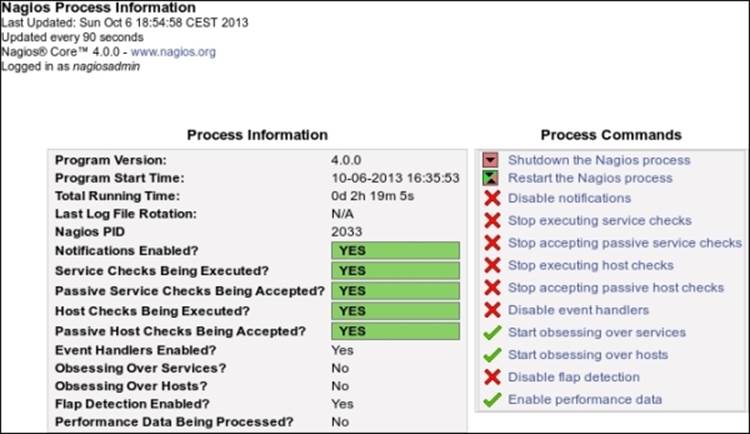
The page contains information on the Nagios version, process ID, status, and log rotation. It also shows whether checks, notifications, and many other functions are enabled.
The menu on the right allows stopping and restarting the Nagios daemon. It also offers the ability to enable and disable performing checks and sending notifications. Flap detection and performance data processing can also be turned on or off from this page.
Checking performance information
The Program-Wide Performance Information page shows information about the performance and load of Nagios processes. This page can be accessed via the Performance Info link on the left-hand menu.
The following is a screenshot of the page:
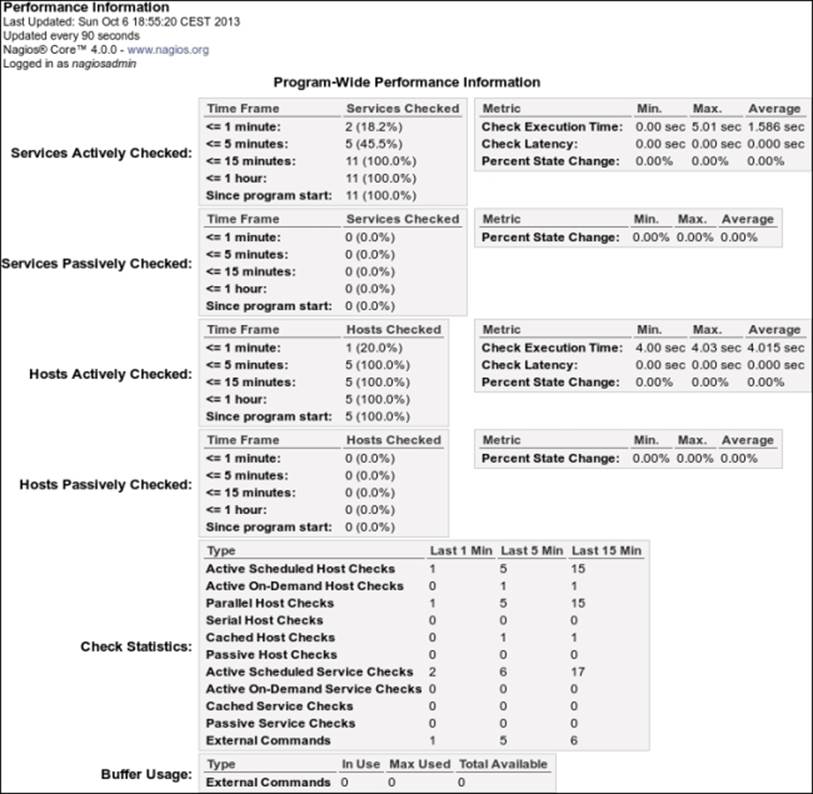
The page contains information on the number of host and service checks performed within various periods of time, as well as the number of reports received from external applications. It also contains the number of commands received from external applications–this usually means the web interface.
The page also contains information on average check execution times as well as latencies. This information is useful to determine whether the Nagios process is overloaded. If the average latency is above 60 seconds or is constantly growing, it means that Nagios is not able to perform all of the checks. In such cases, it is a good idea to increase check or notification intervals so that the number of commands Nagios runs is lower.
Generating reports
One of the most important features of the web interface is the ability to create reports. Many larger companies need those to make decisions at a higher management level, smaller ones can benefit from it. Reporting functionality can also be used to browse historical notifications and alerts and see complete logs from a specified period.
Nagios offers the following types of reports:
· Trend reporting for hosts or services: This report shows state history changes for a single object along with status information from performed checks.
· Availability report for hosts or services: This report shows how much time an object has spent in a particular status. It can report all objects or a single object and can also generate reports for host groups and service groups
· Alert histogram: This report shows the number of alerts that have occurred over a period of time for a particular host or service.
In addition, Nagios can report a history of alerts, notifications, or all events. This can be considered reading Nagios logs in a more convenient way. It allows reading the history either for all hosts and/or services, or for a specific object. The logs are also formatted in a more readable way.
Generating most reports begins with choosing the report type and then the object type—host, host group, and service, or service group. Then, either all objects or a specific object may be chosen for which the report will be generated.
Next, you will get a form for specifying the period for which a report should be generated along with many additional options, which can be dependent on the type of report that you want to generate. Additionally, a time period can be specified so that the report only includes specific time periods, such as working hours.
The following is a screenshot of a sample form for specifying parameters for a report. Actual fields might vary depending on the type of report you want to generate.
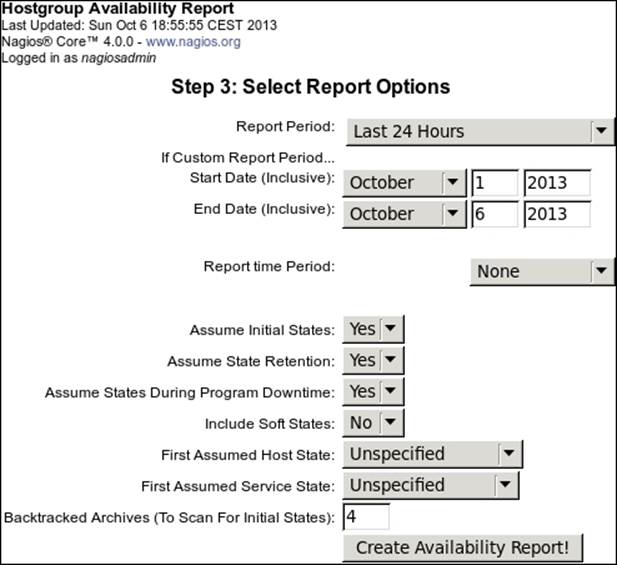
After you specify parameters in the form and submit it, the web interface will generate a report matching your criteria. Some types of reports also allow exporting information in CSV format for further analysis. For trend history reports, it is also possible to zoom in or out, in order to customize the period for which the report is generated.
The following is a screenshot of a report displaying the availability of all hosts. It shows how much time all hosts have been up, down, or unreachable, due to parent machines not being up.
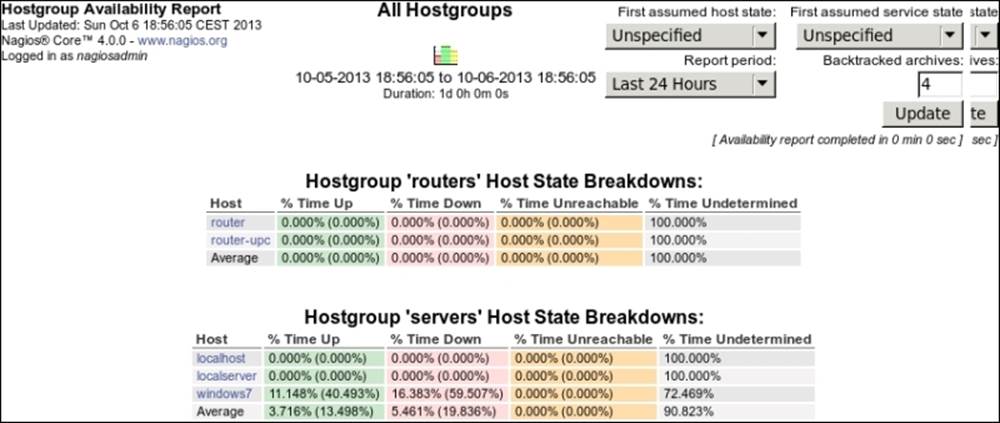
The report shows information for all hosts as a table, along with the summary of overall availability.
It is possible to change the parameters of a report even after it has been generated, for example, if you want to modify the reported period, or other such information.
Changing the look of the Nagios web interface
The Nagios source code comes with two themes—exfoliation and classical. So far, all of the screenshots in this chapter have been of the exfoliation theme, which has been the default theme for Nagios since Version 3.3.1.
The classical theme was the default for all Nagios versions up to 3.2.3. To install the classical theme, we need to run the following command from the Nagios source code directory:
make install-classicui
This command will install the classical theme and overwrite the theme currently installed for the Nagios web interface. After the command succeeds, the interface will look more familiar to those people that use, or have used, Nagios Version 3.2.3 or older.
Depending on preference, you may choose to use the new default theme, or use the classical one. Aside from a different look and feel, there is no difference in the Nagios UI features or behavior. The GUI has the exact same left-hand menu as the theme installed by default, and all of the operations such as scheduling downtime, managing comments, or generating reports, are performed in the same way.
The tactical overview page of the classical theme looks significantly different from the one in the exfoliation theme:
Also, the status pages for services and hosts look different from the ones shown earlier. The following screenshot is of the classic UI theme, showing service status:
In order to install the exfoliation theme again, all that you need to run is the following command from the Nagios source code repository:
make install-exfoliation
This will restore the exfoliation theme that is installed by default with Nagios 4. The GUI will now look the same as it did before you installed the classical theme.
Several additional themes are available on Nagios Exchange at http://exchange.nagios.org/directory/Addons/Frontends-(GUIs-and-CLIs)/Web-Interfaces/Themes-and-Skins. When you choose a theme, please be sure to verify that it is compatible with your version of Nagios.
One of the themes that work properly with Nagios 4 is the Arana Theme. It is listed on Nagios Exchange and available directly from SourceForge at http://sourceforge.net/projects/arana-nagios/.
The first thing we should do is back up our Nagios web interface directory—/opt/nagios/share—before installing Nagios. Refer to the steps documented in Chapter 2, Installing Nagios 4.
This can be done using the following command:
cp -pfR /opt/nagios/share /opt/nagios/share-backup
First, we need to download and unpack the theme. The link to download the theme can be found both on Nagios Exchange and on the SourceForge arana-nagios project. We'll need to download the archive and unpack it anywhere on the local disk.
Next, copy the entire contents of the directory containing the unpacked Arana theme archive to /opt/nagios/share.
After this step, the theme should get properly installed and the Nagios page should look similar to the following screenshot:
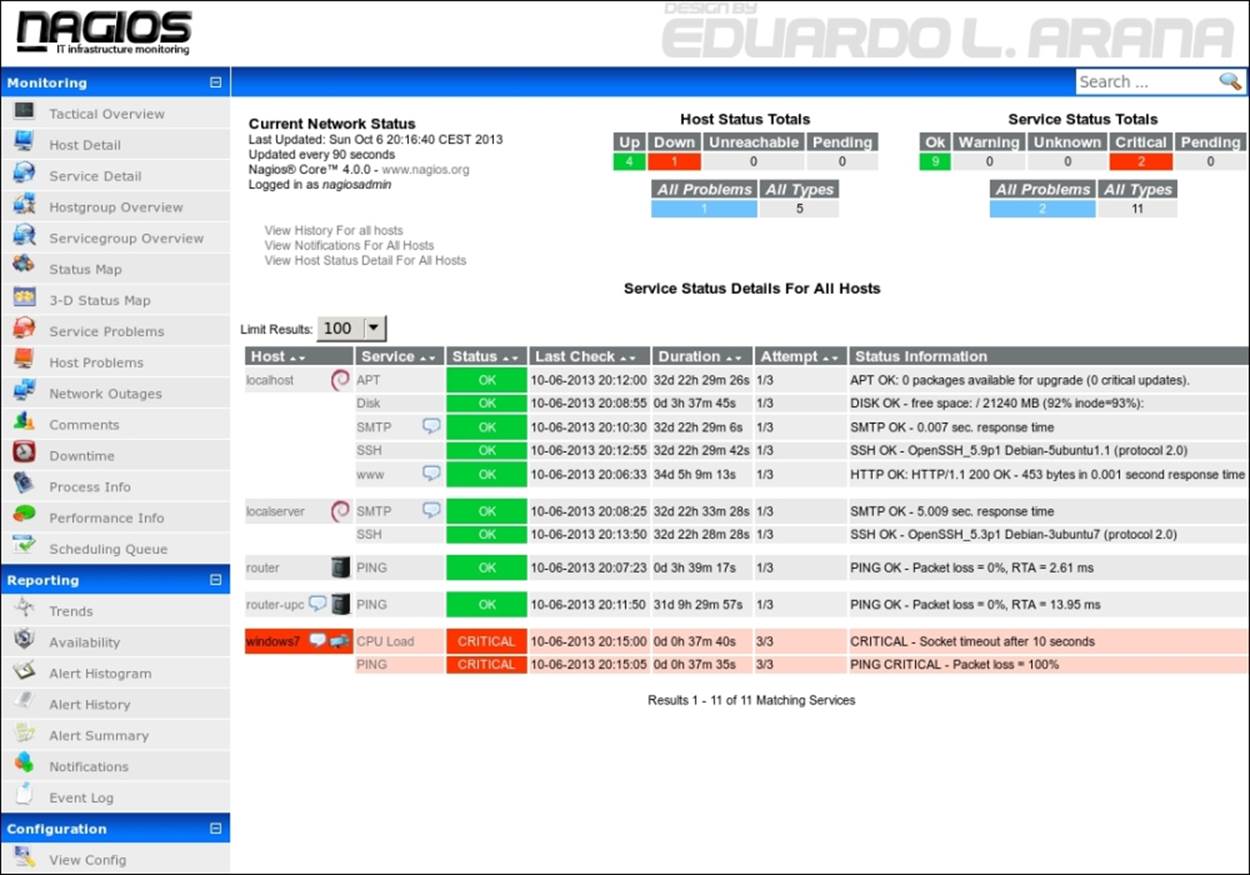
For most themes, the installation should be the same: extract the archive and copy its contents to the directory containing the Nagios web interface files.
Themes also usually come with readme or install text files that document the exact installation process. When you install a theme for the first time, it is recommended that you start by reading these files.
Note
The Nagios 4 web interface uses PHP for formatting the templates, while previous versions used static HTML pages. Many themes created for Nagios 3 will work with Nagios 4; however, switching to PHP may cause some of the themes designed for Nagios 3 or older to not work properly with Nagios 4, without slight modifications to the themes.
Third-party Nagios web interfaces
There are also multiple web interfaces available on the Internet in addition to the GUI that comes with Nagios itself. A wide choice of additional web interfaces can be found on Nagios Exchange at http://exchange.nagios.org/directory/Addons/Frontends-(GUIs-and-CLIs)/Web-Interfaces.
Many of the GUIs available on Nagios Exchange are dashboards. These show statuses for hosts, services, and errors. The dashboards are often displayed on a large display, such as TV, so that the IT department can easily monitor the status of the infrastructure and identify problems that need to be fixed.
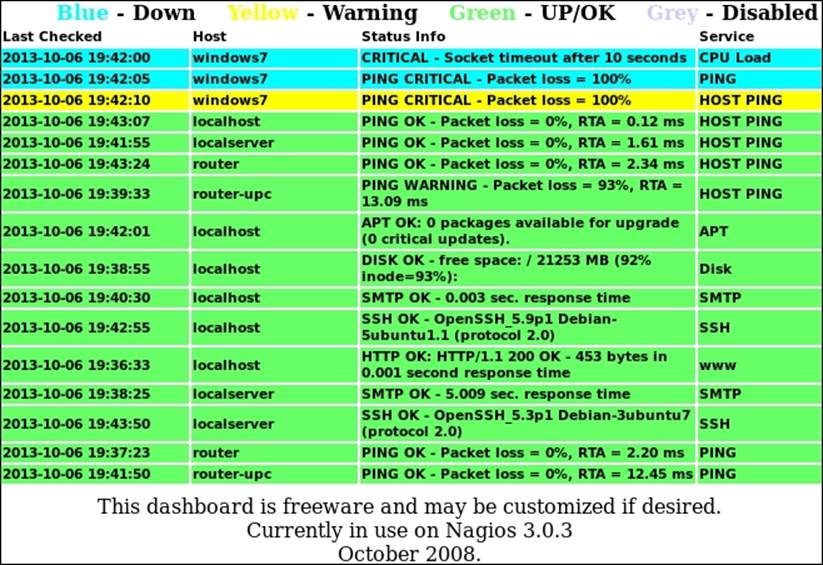
One example of such an interface is called Nagios Dashboard. It is a small PHP script that shows the statuses of hosts and services, starting with those that have an error status. The plugin can be found on Nagios Exchange athttp://exchange.nagios.org/directory/Addons/Frontends-%28GUIs-and-CLIs%29/Web-Interfaces/Nagios-Dashboard--2D-PHP/details.
The entire interface is a single file. To install it, we simply need to unpack and copy the nagios.php file to any location, such as to /opt/nagios/share.
Next, if Nagios was installed according to the steps documented in Chapter 2, Installing Nagios 4, we need to change the path to the status.dat file to point to our location, which is /var/nagios/. To do this, we need to edit the file and change the third line to this:
$file = fopen("/var/nagios/status.dat", "r") or exit("Unable to open file!"); //path to nagios file
We can then check the report by going to the appropriate URL; if the file was copied to /opt/nagios/share, it will be available at http://localhost/nagios/nagios.php:
There are many other dashboards for Nagios available at Nagios Exchange, such as Nagios Dash, which is a project based on Nagios Dashboard and they are quite similar.
Another example is NagiosTV, which is also a dashboard project for Nagios. It is best to check out a few of the projects and find the one that best suits your needs.
There are also projects offering a more complete web interface, meant to complement or replace the Nagios web interface. A good example of such a project is Nagios V-Shell. It is a web interface that provides most of the features of the original Nagios GUI.
It is created in PHP, is designed to be lightweight, and does not use frames, which makes it more convenient to use on mobile devices. It is available for download on Nagios Exchange at http://exchange.nagios.org/directory/Addons/Frontends-%28GUIs-and-CLIs%29/Web-Interfaces/Nagios-V-2DShell/details.
It requires Apache and PHP, which we have already set up for the Nagios web interface. It also requires APC, a caching mechanism for PHP. The php-cli command is also required to run the installation script for V-Shell.
To install the required dependencies, simply run the following command for Ubuntu:
# apt-get install php-apc php-cli
Use the following command for RedHat/CentOS:
# yum install php-pecl-apc php-cli
The installation of V-Shell itself is very simple. After downloading and unpacking the archive, we need to edit the config/vshell.conf and config/vshell_apache.conf configuration files.
For Nagios installation according to steps documented in Chapter 2, Installing Nagios 4, the config/vshell.conf file should have the following values set for each of the variables in the file:
STATUSFILE = "/var/nagios/status.dat"
OBJECTSFILE = "/var/nagios/objects.cache"
CGICFG = "/etc/nagios/cgi.cfg"
NAGCMD = "/var/nagios/rw/nagios.cmd"
NAGLOCK = "/var/nagios/nagios.lock"
We also need to change the location of the htpasswd.users file in config/vshell_apache.conf. It should be as follows:
AuthUserFile /etc/nagios/htpasswd.users
Finally, we should edit the install.php script if we're running on an Ubuntu system. The APACHECONF constant has to be changed to /etc/apache2/conf.d in this case:
define('APACHECONF',"/etc/httpd/conf.d");
The default value for APACHECONF is suitable for RedHat and CentOS and does not need to be changed in this case.
By default, the package will install itself to /usr/local/vshell. This can be changed by editing the install.php and config/vshell_apache.conf files. They have hardcoded locations of the files and require changing in case we want to install in a different location. For example, you can use the following code to change the location:
define('TARGETDIR',"/opt/nagios/vshell");
In the config/vshell_apache.conf file, change the first lines to:
Alias /vshell "/opt/nagios/vshell"
<Directory "/opt/nagios/vshell">
(...)
We can now install V-Shell by running the following command:
# php-cli install.php
This will run the installation script. It will automatically copy all of the files and add the Apache configuration file to the appropriate directory.
After that, it is recommended that you restart Apache by running the following command:
# service apache2 restart
And now, V-Shell should be available at http://127.0.0.1/vshell/:
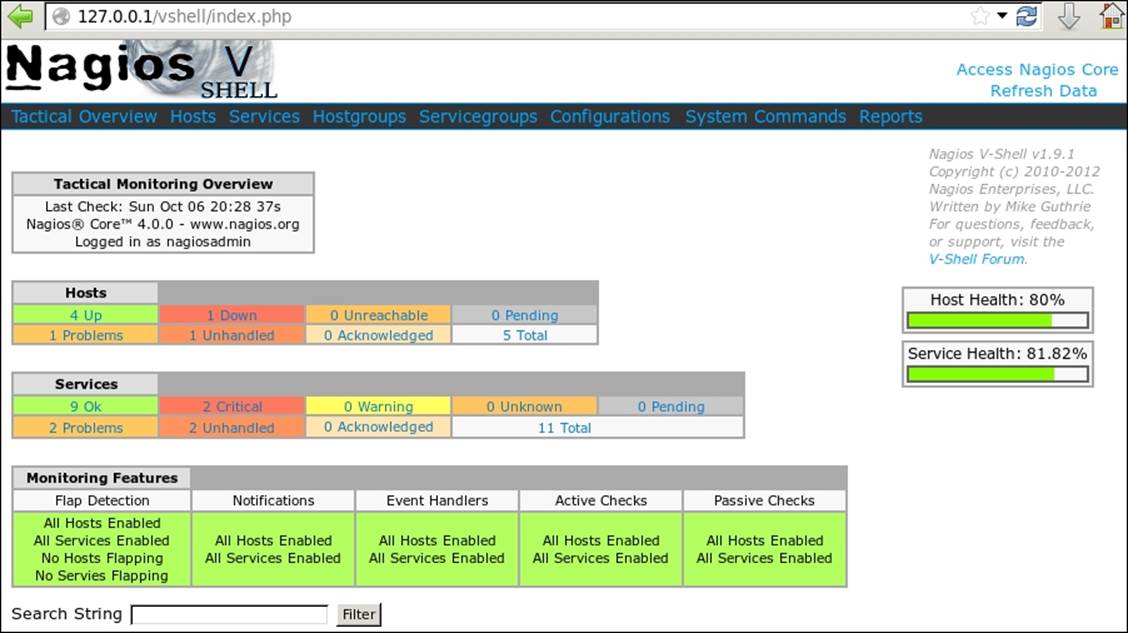
The V-Shell interface is very similar to Nagios' web interface; the main differences are that it does not use frames, and the menu is shown on top rather than on the left. The menu is also a drop-down menu, and hovering over one of the menu items shows a list of available elements.
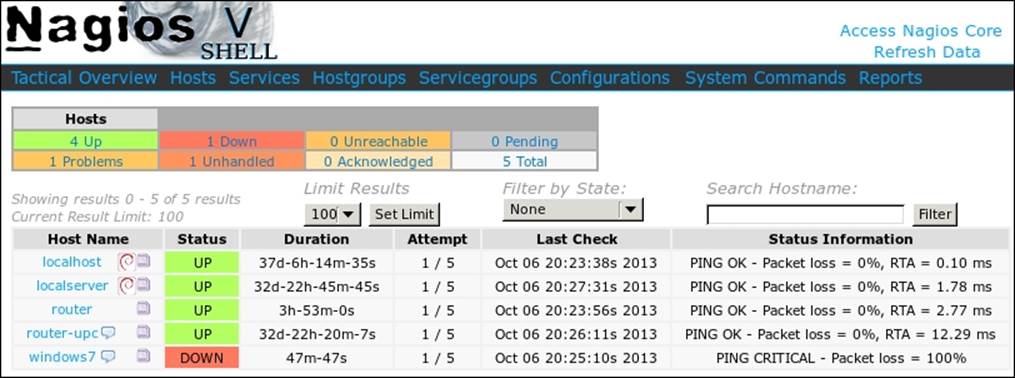
V-Shell offers most of the views available in the standard web interface for Nagios, such as showing host details, and all of the information related to host management.
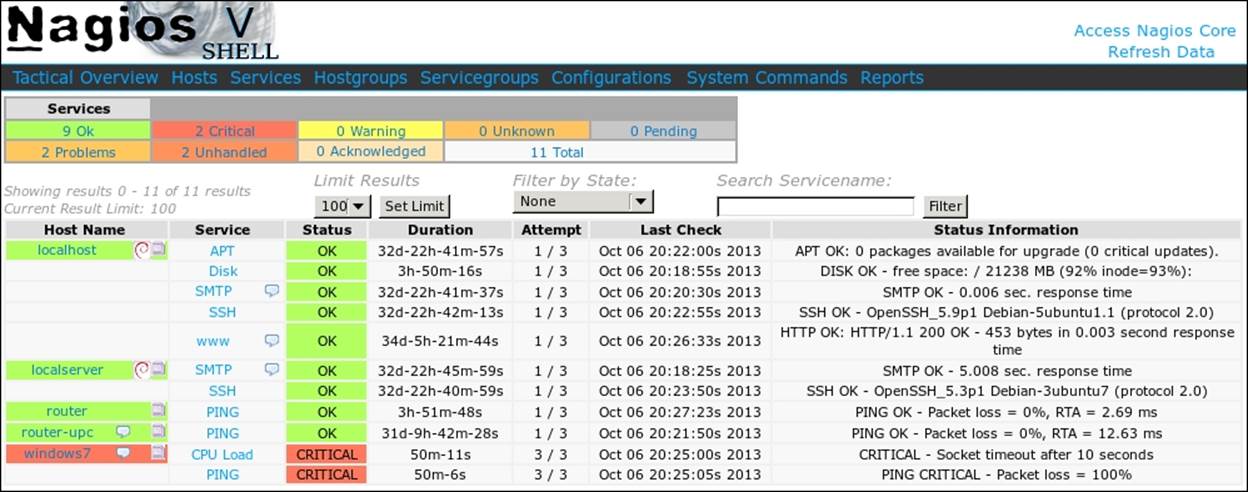
Similarly, the Services views also strongly resemble the original Nagios web interface.
Nagios V-Shell provides views for most of the options available in the standard web interface. It also uses JavaScript for many operations, which makes it faster than the standard web interface. This is especially important for mobile devices that often have slower network connectivity.
Summary
Being able to view the status of your infrastructure from a web browser is a great functionality. Combined with an SSL-enabled web server or using VPN, it can allow people in your company to check the status of the entire network from any location in the world.
A large number of views can aid you in finding out what the root cause of your problem is. You can view objects by their groups as well as individual hosts and services.
There are also views for problems related to hosts and services that only show direct causes of problems, and skip issues that arose due to problems with other hosts or services.
The web interface also allows you to modify how Nagios behaves. It can also be used to configure individual hosts and services. You can also schedule host and service checks at a specified time. For example, you can use this to check whether the changes that your team has performed will resolve current problems.
The web interface also allows scheduling and managing host and service downtimes. You can also read, place, and manage comments associated with all objects.
The look and feel of the web UI can be customized to suit the needs of you and your company; different themes can be applied, and the company logo (and many other aspects of it) can be changed.
There are also several alternative web interfaces available to Nagios, providing dashboards for clear reporting of statuses and more complex and complete alternatives to the standard Nagios interface. Dashboards can be shown on large screens, such as HD TVs, to have a convenient view of the IT infrastructure. The alternatives to Nagios can replace the web interface or provide a better experience on mobile devices.
Getting to know the web interface is really essential in order to use Nagios effectively, and it is recommended that you spend some time getting familiar with it.
Now that we have learned both the Nagios service and its web interface, we can move on to set up a more complete monitoring system. The next chapter provides an overview of the standard Nagios plugins and how they can be used to monitor various types of hosts and services.
All materials on the site are licensed Creative Commons Attribution-Sharealike 3.0 Unported CC BY-SA 3.0 & GNU Free Documentation License (GFDL)
If you are the copyright holder of any material contained on our site and intend to remove it, please contact our site administrator for approval.
© 2016-2026 All site design rights belong to S.Y.A.