Learning OpenShift (2014)
Chapter 10. Debugging Applications
If you are a software developer, you know that being able to debug application code is critical when developing and troubleshooting applications. In this chapter, we are going to learn how to use port forwarding to connect to remote databases. After this, we are going to explore how to use remote debugging to debug the application code by setting breakpoints from within the Eclipse and IntelliJ IDEs. Finally, we are going to learn how to leverage OpenShift Online partners to enhance the capabilities of our application to add support for log viewing and monitoring.
Using port forwarding
As we have learned previously in this book, you can embed add-on cartridges to your application gears, such as MySQL and MongoDB. However, connections to these remote data stores are restricted to requests that come from the local gear where the cartridge resides. This is great for security but a poor experience if you want to remotely connect to a database in order to import data or to view, edit, or create the schema of the database. Fortunately, the RHC command-line tools come equipped with a feature that allows you to connect to the remote database using port forwarding. Don't be alarmed if you don't understand the details of how port forwarding works as the client tools automate the process.
Note
Port forwarding translates connections created on one host to another by utilizing the available SSH connection. This allows users to connect to remote daemons on a private network by treating them as locally running services as long as the local machine has access to the remote private network.
To illustrate how port forwarding works on the OpenShift platform, we are going to forward the MongoDB database that we created in Chapter 5, Creating and Deploying Java EE Applications, so that we can connect to it locally. The first thing we want to do is run the port forwarding command on our local machine with the following command:
$ rhc port-forward –a mlbparks
Once you enter the preceding command, you will see the following output:
Checking available ports ... done
Forwarding ports ...
To connect to a service running on OpenShift, use the Local address
Service Local OpenShift
------- --------------- ---- -------------------
java 127.0.0.1:3528 => 127.7.150.129:3528
java 127.0.0.1:4447 => 127.7.150.129:4447
java 127.0.0.1:5445 => 127.7.150.129:5445
java 127.0.0.1:8080 => 127.7.150.129:8080
java 127.0.0.1:9990 => 127.7.150.129:9990
java 127.0.0.1:9999 => 127.7.150.129:9999
mongodb 127.0.0.1:27017 => 127.7.150.130:27017
Press CTRL-C to terminate port forwarding
Tip
Port forwarding will remain active until you stop the process by pressing Ctrl + C on your keyboard.
In the preceding output, we can see that several ports on the remote server are now available on the local machine. For instance, MongoDB is running at the remote IP address of 127.7.150.130 on port 27017 but is now available locally by connecting to 127.0.0.1, or localhost, using port27017. A developer will connect locally and all the traffic will be forwarded via an encrypted SSH connection to the remote OpenShift gear, as shown in the following diagram:
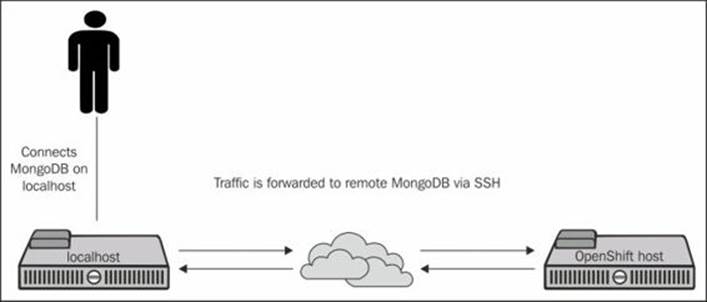
Connecting to MongoDB
Now that we have our NoSQL database available on the local machine, we can connect to it just as if it were running locally. In order to be able to communicate with MongoDB, you will need to have the MongoDB client installed on your local machine.
Note
The instructions for installing the client on Ubuntu are listed in the following section, but you will need to consult the official MongoDB documentation for instructions on how to install the client for your operating system.
To install the client tools on an Ubuntu-based operating system, open a terminal window and enter the following command:
$ sudo apt-get install mongodb-clients
In order to connect to the remote MongoDB database, you will need to know the username and password to authenticate to the data store. You can find this information by showing information about the MongoDB cartridge that you added to the mlbparks application with the following command:
$ rhc cartridge show mongodb -a mlbparks
This will display all of the relevant details that you need in order to connect to the database, including the username and password, as shown in the following output:
Using mongodb-2.4 (MongoDB 2.4) for 'mongodb'
mongodb-2.4 (MongoDB 2.4)
-------------------------
Gears: Located with jbosseap-6, jenkins-client-1
Connection URL: mongodb://$OPENSHIFT_MONGODB_DB_HOST:$OPENSHIFT_MONGODB_DB_PORT/
Database Name: mlbparks
Password: q_6eZ22-fraN
Username: admin
In the preceding output, the username is admin and the password is q_6eZ22-fraN.
Tip
Be sure to use the proper username and password for your cartridge installation and not the one displayed as an example in this book.
Now that we have the authentication information and the mongo client installed, we can connect using the following command on our local machine:
$ mongo 127.0.0.1:27017/mlbparks -u admin -p q_6eZ22-fraN
This will present you with the MongoDB shell. To verify that you are indeed connected to the remote MongoDB database, issue a command to get the count of baseball teams in the database:
$ db.teams.count()
Note
If you want to see the JavaScript source code that MongoDB is running to execute the query, you can leave off the parenthesis of any command to view the source of the command.
If everything went correctly, the result should be 30.
You can also use your favorite database management software to connect to and manage your database. For example, let's examine how to use the popular UMongo package to connect to our remote MongoDB instance.
Note
UMongo is written in Java and is therefore available for the three big operating systems: Windows, Mac OS X, and Linux. To download this software package, head over to the official download site at http://www.edgytech.com/umongo.
Once you have downloaded the UMongo tool, start the program and select File and then Connect to create a new connection. Once the connection dialog is displayed, click on the edit icon to modify the current connection.

After clicking on the edit connection icon, you will be presented with a dialog that will allow you to enter the connection and authentication information for the database. Remember to use the correct username and password for your database and ensure that you specify the 127.0.0.1 IP address and the corresponding port.

Once you have connected to the database, you can run queries and use the tool just as if the database was running locally. This is illustrated in the following screenshot where I ran a query to list all of the documents in the teams collections:

Once you are finished with your work on the remote database, remember to close the port forwarding connection by pressing Ctrl + C in the terminal window where the connection is established.
Using Eclipse for Java debugging
As a developer, being able to set breakpoints and step through code is crucial to the development process when trying to debug or troubleshoot your application code. OpenShift supports this functionality by allowing Java developers to enable remote debugging by setting a marker that alerts the platform that you want to enable this feature. Don't worry if you don't understand the marker system at this point, as we cover it in detail as part of Chapter 11, Using the Marker and Action Hook System. For the purposes of this chapter, we are going to create a new marker and add it to our application using the Git revision control system.
Open your terminal prompt and go to the directory where your mlbparks application is cloned on your local machine. Once you are in your application's directory, run the following command to create a blank file named enable_jpda in the .openshift/markers directory of your application:
$ touch .openshift/markers/enable_jpda
If you are not familiar with JPDA, you can find more information at http://en.wikipedia.org/wiki/Java_Platform_Debugger_Architecture.
Once you have created this empty file, add the file to your repository, commit the change, and then push the marker to your OpenShift gear:
$ git add .
$ git commit –am "enable remote debugging"
$ git push
You can also create this marker directly inside of Eclipse by right-clicking on your mlbparks project, selecting OpenShift, and then selecting Configure Markers….
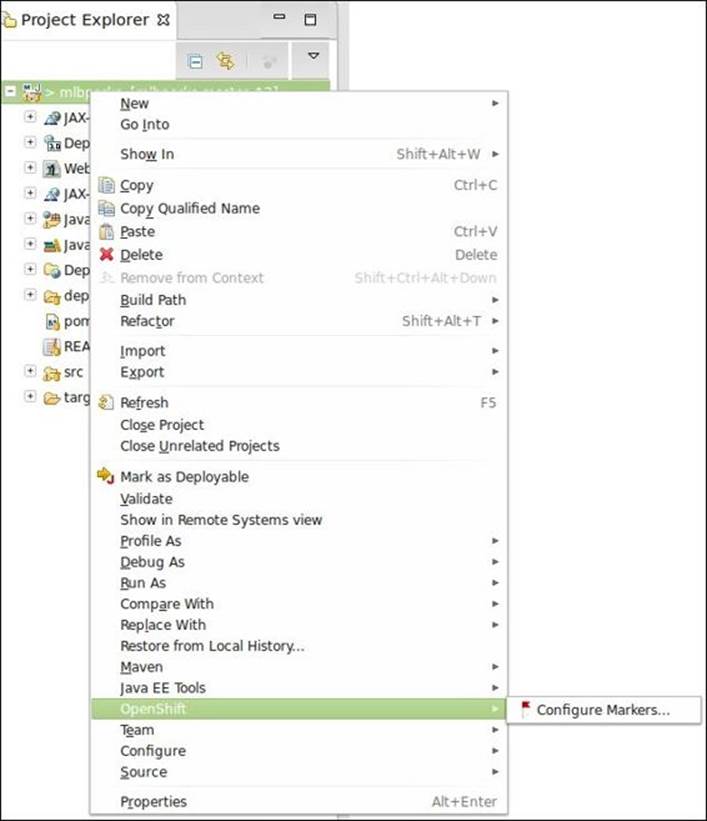
Once you select Configure Markers…, a dialog will be presented where you can select to enable JPDA, as shown in the following screenshot:
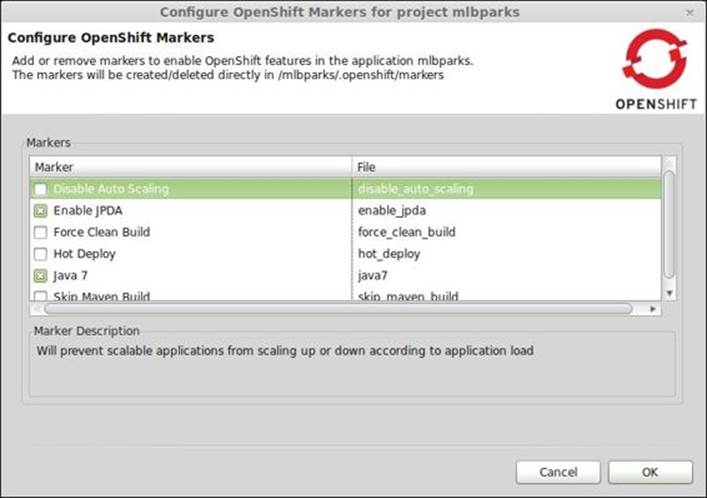
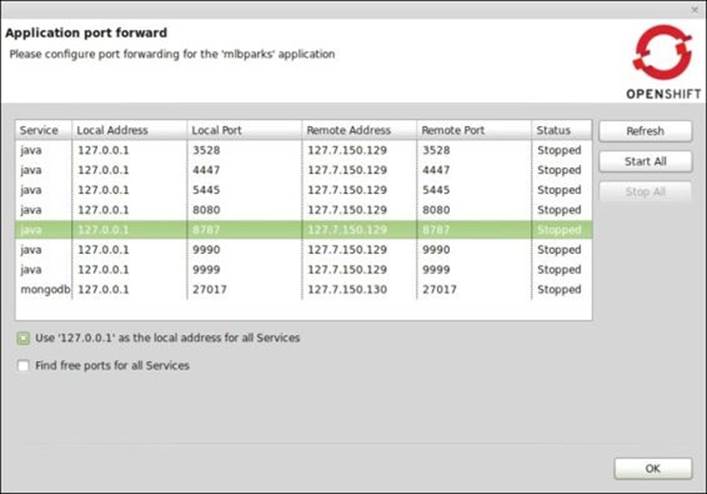
Once JPDA has been enabled and the marker has been pushed to the OpenShift gear, the next step is to enable port forwarding for our application. This will allow us to connect to the debug port (8787) on the remote machine as if it were a local running server. You can start port forwarding using the command-line method we learned in the previous section of this chapter, or you can use the IDE to start the forwarding. To enable port forwarding from within the Eclipse IDE, go to the OpenShift Explorer view and find the mlbparks application. Right-click on the application and select Port forwarding… from the menu, as shown in the following screenshot:

The IDE will verify that the SSH authentication is configured with the remote OpenShift gear, and then it will present a dialog that shows you the current status of each port. At this point, you can start forwarding by clicking on the Start All button on the right-hand side of the dialog.
Once the forwarding has started, you can click on the OK button to hide the dialog window.
The next step is to create a debug configuration that contains the information required to connect to our remote JBoss EAP server running on OpenShift. For this, click on the Run menu item at the top of the Eclipse IDE. After clicking on Run, select Debug Configurations, and then selectRemote Java Application in the available options. Once this item has been selected, click on the new button in the top-left corner in order to create a new configuration. You can then provide the connection information that was displayed when you started port forwarding.

After the connection information has been entered, click on the Apply button, and then click on Debug to establish a remote debug session.
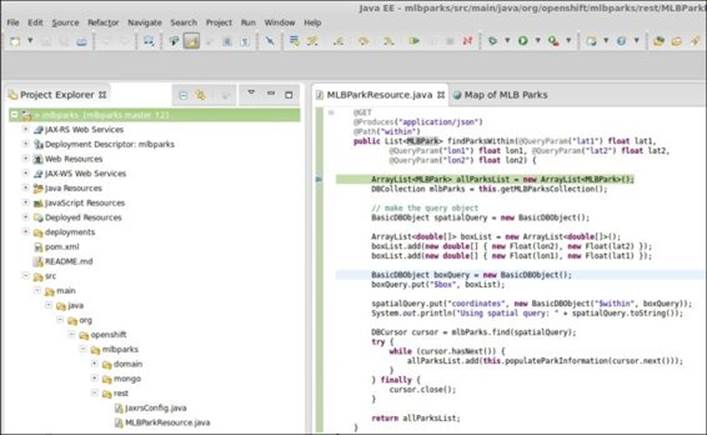
The last thing we need to do in order to debug our application is to set a breakpoint in our application code. Open the MLBParkResource.java file located under the src/main/java/org/openshift/mlbparks/rest directory and set a breakpoint in the following line in the findParksWithin method:
ArrayList<MLBPark> allParksList = new ArrayList<MLBPark>();
The IDE will display an icon next to the line on the left-hand side in order to let you know that a breakpoint has been added.
Open a web browser and enter the URL for your application, and you will see that the application breaks at the specified location and allows you to step through the code by using the debug perspective that is part of the Eclipse IDE.

Tip
If the application did not break at the specified breakpoint, ensure that you have port forwarding enabled and are running the application in the debug mode.
Using IntelliJ for Java debugging
In the previous section, we learned how to use Eclipse for the remote debugging of Java applications. In this section, we are going to show you how to use the popular IntelliJ IDE to perform the same action. As you will learn in this section, IntelliJ provides a cleaner experience as the port forwarding requirement is handled under the covers by the IDE when you click on the Debug button. Installing the IDE is out of the scope of this book, so I will assume that you have already downloaded and installed the software.
If this is the first time that you are using IntelliJ to connect to your OpenShift account, you will need to configure your credentials. Open the Settings pane and browse to the Clouds section. Once this section is displayed, click on the plus sign at the top of the dialog and select OpenShift. Enter your authorization information and click on the Test connection button.

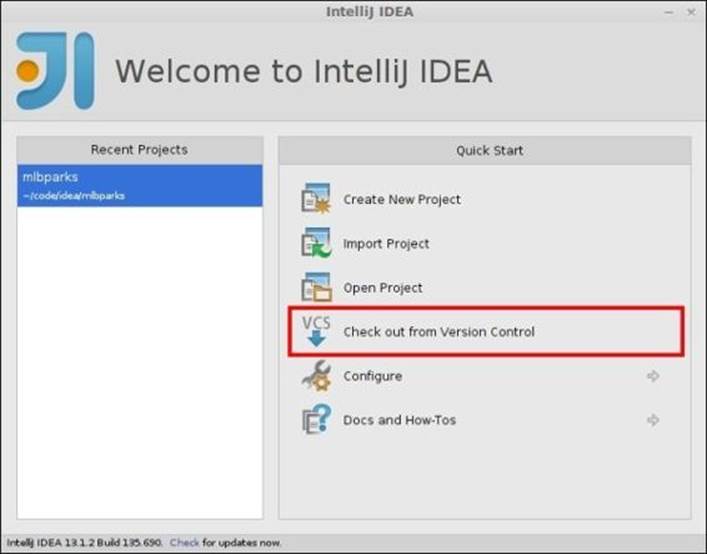
If the connection was a success, exit the Settings pane, select Check out from Version Control, and choose git as the version control system to be used.
Once you select git, you will need to provide the URL for the Git repository of your mlbparks application. Input the required information in the dialog and click on the Clone button.

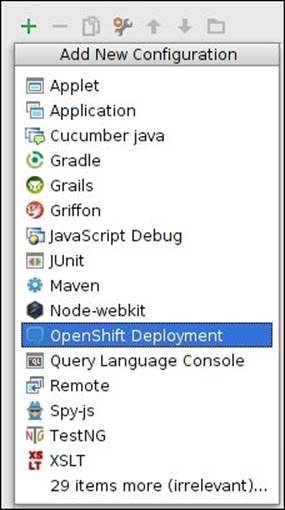
The next thing we need to do is configure a deployment for the mlbparks application that we just cloned and created a project for. You can do this by clicking on the Run menu item from the IDE menu and selecting Edit Configurations from the drop-down list. This will open up a new dialog where you need to click on the green + button to add a new configuration. Finally, select OpenShift Deployment to create a new OpenShift deployment.
In the dialog box that is presented to you, name the deployment OpenShift and then click on the OK button.

To begin debugging your application, simply select Run and then select Debug OpenShift from the IDE menu.
Note
To speed up application deployments for the mlbparks application, you might want to consider removing the Jenkins client from the application with the following command:
$ rhc cartridge remove jenkins -a mlparks
Once your application has been deployed, you should see the console window from within the IDE that lets you know that the port forwarding for the debug port has been enabled by displaying the following text:
Connected to the target VM, address: '127.0.0.1:8787', transport: 'socket'
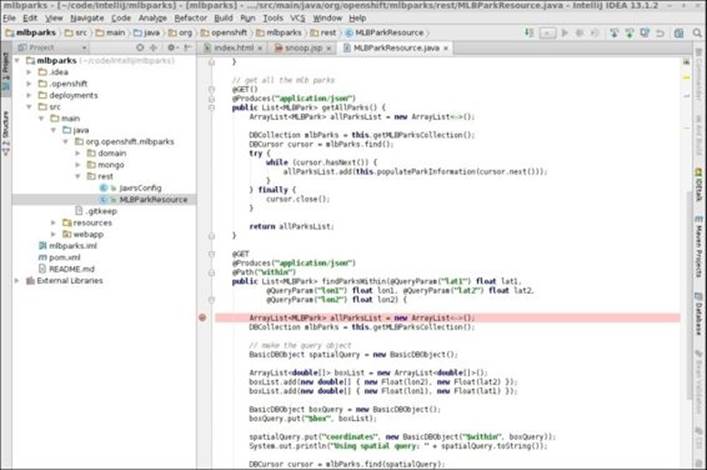
To verify that the IDE is able to connect to the remote port for debugging, open the MLBParkResource.java file located under the src/main/java/org/openshift/mlbparks/rest directory and set a breakpoint in the following line in the findParksWithin method:
ArrayList<MLBPark> allParksList = new ArrayList<MLBPark>();
The IDE will confirm that a breakpoint has been set on the line by highlighting the line, as shown in the following screenshot:
Open your browser and point to the URL of your application to confirm that the IDE breaks at the requested line.

Congratulations! You now know how to configure the popular IntelliJ IDE in order to work with OpenShift deployed projects, including the ability to set breakpoints and step through the application code.
Using logfiles for debugging
The OpenShift Online platform has a great partner ecosystem where you can embed various functionality to enhance your applications. In this section, we are going to learn how to utilize the Logentries integration with existing OpenShift applications in order to get a view of the system performance and logs.
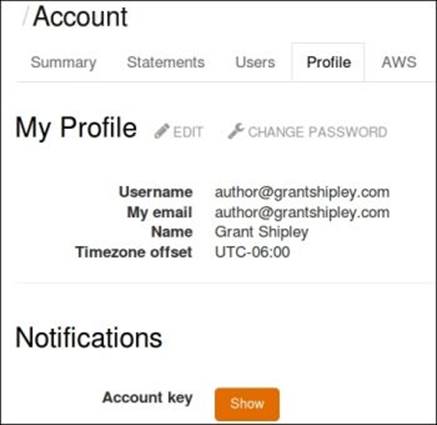
The first thing you need to do is sign up for a free Logentries account by visiting their website at https://logentries.com/. Once you have created an account, you will need to make a note of your account key, which is provided under the Profile tab of your account details.
Once you have your account key, the next step is to add the Logentries source code to your mlbparks application. Switch to the root directory of your application and enter the following command to add the Logentries remote GitHub repository where the OpenShift integration resides:
$ git remote add upstream -m master https://github.com/logentries/le_openshift.git
Once you have added the repository, you can merge the changes with the following pull command:
$ git pull -s recursive -X theirs upstream master
This will create a new directory under your application's home folder named logentries. Switch to this directory, edit the le_config.ini file, and enter the account key for your Logentries account.
Once you have added your key, add and commit the changes and then push the code to your OpenShift gear:
$ git add .
$ git commit -am "adding logentries support"
$ git push
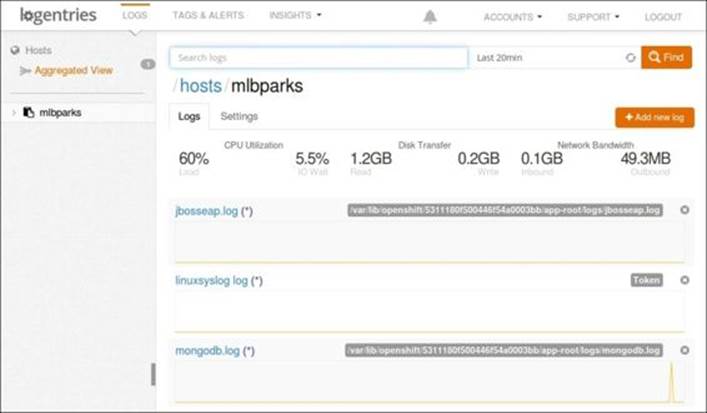
Once your application has been deployed, head back over to the Logentries site, and you will notice that it is already reporting CPU, disk, network, and memory statistics.

To view logfiles, click on the mlbparks host to view all of the logs that Logentries is following. If a logfile that you want to watch is not listed in the console, this simply means that it is not being followed by default. To specify additional logfiles to be followed, SSH to your mlbparks gear and switch to the directory where your logfile is located. For instance, if we wanted to add the JBoss EAP and MongoDB logfiles, we will execute the following command:
$ rhc app ssh mlbparks
Once you're connected to the remote gear, run the following commands:
$ cd $OPENSHIFT_LOG_DIR
$ ${OPENSHIFT_REPO_DIR}logentries/le follow jbosseap.log
$ ${OPENSHIFT_REPO_DIR}logentries/le follow mongodb.log
$ ${OPENSHIFT_REPO_DIR}logentries/le monitordaemon
Once you have followed the JBoss EAP and MongoDB logs, refresh your Logentries dashboard to see the change reflected.
If you want to trigger an event that will show up in the MongoDB log, you can restart the MongoDB cartridge with the following command:
$ rhc cartridge restart mongodb -a mlbparks
Once you have restarted MongoDB, click on the MongoDB log in the Logentries dashboard to view the events that were sent to the server.

Note
Logentries is just one of many partners of the OpenShift Online platform. For a complete list of partners and the integrations they provide, visit the official OpenShift partner page at http://www.openshift.com/partners.
Summary
In this chapter, we learned how to use port forwarding to connect to databases that reside in the remote OpenShift gear. We also learned how to enable Java debugging using the enable_jpda marker. Once JPDA was enabled, we explored how to configure the Eclipse and IntelliJ IDEs to set breakpoints and step through the application code that is running on the OpenShift gear. Finally, we learned how to view and monitor logfiles and system performance by integrating with Logentries, which is an OpenShift Online partner.
In the next chapter, we are going to explore the OpenShift marker system as well as application hooks that will allow you to customize your application to perform actions at specific points in the development life cycle.
All materials on the site are licensed Creative Commons Attribution-Sharealike 3.0 Unported CC BY-SA 3.0 & GNU Free Documentation License (GFDL)
If you are the copyright holder of any material contained on our site and intend to remove it, please contact our site administrator for approval.
© 2016-2026 All site design rights belong to S.Y.A.