Learning Informatica PowerCenter 9.x (2014)
Chapter 9. Optimization – Performance Tuning
Having reached the last chapter, you must be very clear about all the components and features of the Informatica tool. As with any other technology related to data, we need to understand the performance tuning of Informatica. It is necessary to follow the best practices to achieve the best performance of your code. We execute performance tuning on Informatica similar to SQL tuning, which is done to enhance the performance of SQL queries. If you follow the best practices of Informatica, your code will be tuned automatically. There are various best practices that are recommended by Informatica, many of which we have already discussed in the previous chapters. We will be talking about these best practices in this chapter as well in order to understand how to use them to achieve better performance.
When we talk about performance tuning, you need to find out the issues in your code, which are called bottlenecks. The regular process is to first find out the bottlenecks and then eliminate them to enhance the performance.
We will discuss the various components that need to be tuned in order to enhance the process. In the next section, we will talk about how to identify the bottlenecks at various components, and we will also talk about how to eliminate them.
Bottlenecks
As mentioned, we can have bottlenecks at various stages of the Informatica PowerCenter code. Don't be in a rush to find all the bottlenecks and eliminate them together. Try to find the first bottleneck and resolve it, and then jump to the other bottlenecks.
Finding the target bottleneck
Always consider checking the bottlenecks at the target side first. There can be various reasons for bottlenecks in the target. First, we need to learn to find the target bottleneck.
Using thread statistics
Thread statistics are a part of the session log. When you run the workflow, the session log also generates the thread statistics that can provide you with information about the bottlenecks present in the source, target, or transformations. Thread statistics give you information about the total runtime, idle time, and busy percentage of the source, target, and transformations.
Thread statistics consist of the Reader thread, Writer thread, and Transformation thread. The Reader thread gives you information related to the total runtime, idle time, and busy percentage of the sources in the mapping. The Writer thread gives you information about the total runtime, idle time, and busy percentage of targets in the mapping. Similarly, the Transformation thread gives you information related to transformations in the mapping, as indicated in the following sample thread statistics:
***** RUN INFO FOR TGT LOAD ORDER GROUP [1] *****
Thread [ READER_1_1_1 ] created for [ the read stage ] of partition point [ SQ_EMPLOYEES ] has completed.
Total Run Time = [ 100.11 ] Secs
Total Idle Time = [ 90.101 ] Secs
Busy Percentage = [ 10.888141628 ]
Thread [ TRANSFORMATION_1_1_1 ] created for [ the transformation stage ] of partition point [ SQ_EMPLOYEES ] has completed.
Total Run Time = [ 123.11 ] Secs
Total Idle Time = [ 100.23 ] Secs
Busy Percentage = [ 18.585005278 ]
Thread [ WRITER_1_1_1 ] created for [ the target stage ] of partition point [ TGT_EMPLOYEES ] has completed.
Total Run Time = [ 130.11 ] Secs
Total Idle Time = [ 1.23 ] Secs
Busy Percentage = [ 99.054646069 ]
As seen in the preceding statistics, the Writer thread is busy for 99 percent of the time as compared to the Reader and Transformation threads. We can say that in this case, the target is the bottleneck. Similar to this, you can identify whether the Source or transformation have bottlenecks in other cases.
Configuring the sample target load
It is a simple thing to understand that loading the data into the target table will take more time as compared to loading the data into the target file. Consider that you are loading the data into the target table in your mapping, configuring a sample run, and trying to load the same data into a test target file. Check the difference between the runtime of both the processes. If there is a significant difference, you can easily say that the database target table has the bottleneck.
Eliminating the target bottleneck
There are various ways in which you can optimize the target loading.
Minimizing the target table deadlocks
There can be a scenario where Informatica is trying to load the data into a table that is already being used by another system. When Informatica encounters the deadlock, it hampers the processing by slowing down the loading process. To avoid this, make sure that the target table is not used by other processes at the same time.
Drop indexes and constraints
Loading the data into tables takes more time because multiple indexes and constraints are created on the table. Each time a new record is loaded into the table, it is checked for indexes and constraints before it gets loaded. This hampers the performance. To avoid this, you can use pre-SQL and post-SQL commands in the session task. Using pre-SQL commands, you can remove the indexes, and using post-SQL commands, you can apply the indexes. When you define pre-SQL and post-SQL, Informatica applies these commands before and after the data is loaded into the table.
Removing the indexes and constraints as described previously is not always recommended, but it definitely improves the performance. You can opt for this option if the data you are loading in the table is not very critical.
Increasing the checkpoint interval
When you run the workflow, the Integration Service keeps on creating checkpoints at a predefined interval. The checkpoints are used for recovery purposes. Reducing the checkpoint interval will help enhance the performance by storing less checkpoints and less data related to the checkpoint.
If you reduce the checkpoint interval, even though the performance will increase, it will hamper the recovery time if the system fails due to an error.
Using an external loader
Informatica PowerCenter supports the usage of multiple external loaders (IBM DB2, Oracle, Teradata, and Sybase IQ), which can help with faster loading into the target table. To add an external loader, open Workflow Manager and navigate to Connection | External loader, as shown in the following screenshot:
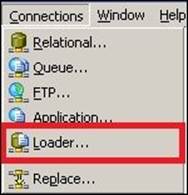
In the next screen, select the loader based on your requirement.
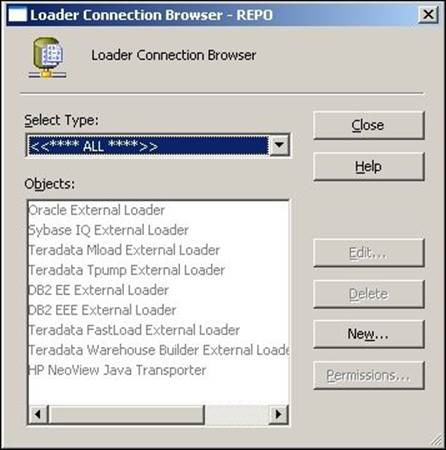
This will help in enhancing the performance by loading the data at a faster pace in the target.
Increasing the network packet size
Every table has a capacity, referred to as the network packet size, with which it can accept the data. If you increase the packet size, the table can accept a greater volume of data.
These properties can be enhanced by the database administrator. Consult your database admin team.
Using the bulk load
By configuring the session properties to use the bulk load, your performance can be significantly enhanced. When you use bulk loading, the database logs are not created, and in turn, it enhances the performance.
However, if you disable the database log, the recovery cannot be done as there is no log of the events in the database.
As you can see, performance can be achieved by compromising on some other factors. You need to decide and create a fine balance between all the factors.
These were the various ways in which you can find and eliminate the target bottleneck. In the next section, we will talk about the source bottleneck.
Finding the source bottleneck
Performance can also be impacted on the source side. Various factors can hamper the performance on the source side, just like we discussed for the target side.
Using thread statistics
As discussed in the Finding the target bottleneck section, use thread statistics to find the source bottleneck. Refer to this section to use thread statistics.
Test mapping
Using a pass-through mapping can help you identify whether the bottleneck is on the source side. Configure a test mapping to have only Source, Source Qualifier, and Target. Consider that you have a mapping with one source, one target, and 10 transformations, and the time taken to process the data through the mapping is 60 seconds. This means combining the source, target, and transformations is taking 60 seconds.
Create another mapping by eliminating all the transformations and run the process and check the time. Suppose the time taken to complete the process is now 50 seconds. As compared to the combined time of the target and transformation, which is 10 seconds, 50 seconds is relatively high, which can indicate that we have a source bottleneck.
Using a Filter transformation
You can use a Filter transformation to check whether the source has a bottleneck. Put a Filter transformation in front of the Source Qualifier and set the condition to False, that is, don't allow any record to pass through the filter in the mapping. Using this method, you can compare the runtime of the process with and without the filter condition. This way, you can identify whether the source has a bottleneck.
Checking the database query
This is another simple method to find the source bottleneck if you are extracting the data from the table. When you use the Source Qualifier to read the data from the database table, Integration Service writes a query to extract the data. Copy the query and run the same query at the database level in the SQL developer or a similar tool. Compare the time taken by the query to get executed at both places, which can give you an idea whether the source has a bottleneck.
Eliminating the source bottleneck
There are various ways in which you can optimize the source. They are discussed as follows.
Increasing the network packet size
As discussed in the Eliminating the target bottleneck section, increasing the network packet size of the table will allow a greater volume of data to pass through the network at a particular instance.
These properties can be enhanced by the database administrator. Consult your database admin team to increase the network packet size.
Optimizing the database query
When you read the data from the database table, Integration Service generates a query to extract the data from the table. You can fine-tune the query to extract only the required data. If you extract all the data and then add a Filter or other transformations, it will hamper the performance.
You can tune the query to extract only the required data, which will save time and help in performance enhancement. This is called a SQL override.
These were the various ways in which you can find and eliminate the source bottleneck. In the next section, we will talk about the mapping and transformation bottlenecks.
Finding the mapping bottleneck
If you don't have a source or target bottleneck, you might have a mapping or transformations bottleneck.
Using thread statistics
As discussed in the Finding the target bottleneck section, use thread statistics to find the transformation bottleneck. Refer to this section to use thread statistics.
Using a Filter transformation
You can use a Filter transformation to check whether the transformation in the mapping is causing a bottleneck. Put a Filter transformation before the target and set the condition to False, that is, don't allow any record to pass to the target. Using this method, you can compare the runtime of the process with and without the filter condition. This way, you can identify whether the transformations have a bottleneck.
Eliminating the mapping bottleneck
There are various ways in which you can optimize the transformations and mapping.
Using a single pass mapping
Consider a scenario where you have multiple targets to load from the same source; in such a scenario, avoid creating multiple mappings. You can save significant time by loading multiple targets in the same mapping. Use a single source and pass the data to different pipelines and then to multiple targets. This way, you can save the time of reading the same data multiple times in multiple mappings.
Avoiding data type conversions
Avoid changing the data types across the transformations in the mapping. When you change the data type, Integration Service takes time to perform the processing. It is always recommended that you do not change the data type wherever not required.
Unchecking unnecessary ports
Passing unnecessary data through the mapping will hamper performance. It is recommended that if you do not need certain data, disable the output port of the column so that you don't pass the data.
Processing the numeric data
Integration Service processes numeric data faster as compared to other data. Try to process as much numeric data as possible.
Using operators instead of functions
Integration Service processes operators faster as compared to functions. For example, consider using || (pipe) in place of the CONCAT function to concatenate the data.
Using decode in place of multiple IIF functions
If your logic contains multiple IIF functions, try replacing them using DECODE. The DECODE function is faster as compared to multiple IIF functions.
The tracing level
The tracing level defines how much detailed information you wish to write to the session log. When you run the process, Integration Service writes the information about the run in the session log. Setting a proper tracing level will help in improving the performance.
Using variable ports
If you are performing the same operation multiple times in a transformation, consider calculating the value in a variable port and use the variable port value multiple times in the transformation. Suppose you need to convert the first name and last name in uppercase, concatenate them, and also cut part of data. Instead of using the UPPER function every time, use the variable port to convert the data in uppercase and variable port to perform other operations. This way, you save the time of performing the save operation multiple times.
Optimizing Filter transformations
You can use Filter transformations as early as possible in the mapping to avoid processing unnecessary data. If you filter unwanted records early in the mapping, you can enhance performance.
Similarly, using the Router transformation instead of multiple Filter transformations will help save time.
Optimizing the Aggregator transformation
Always pass sorted data to the Aggregator transformation to enhance performance. When you pass sorted data, Integration Service needs to save less data in the cache, which helps in the enhancement of the performance.
You can also improve the performance of the Aggregator transformation by executing groups of numeric columns. For example, consider grouping the data in the department ID instead of the location. This is only possible as per your business requirement.
Use incremental aggregation whenever possible in the session properties to enhance the performance. When you use incremental aggregation, the performance is improved as the Aggregator transformation now needs to calculate fewer records.
Optimizing the Joiner transformation
It is recommended that you assign the table with a smaller number of records compared to the master while using the Joiner transformation. Also, the table with a smaller number of duplicates should be used as the master table.
It is also recommended that you perform the join in the Source Qualifier using the SQL override, as performing joins on the database is sometimes faster as compared to performing them in Informatica.
Also, pass the sorted data to the Joiner transformation to enhance performance, as this utilizes less disk space compared to unsorted data.
Optimizing Lookup transformations
Lookup transformations are one of the most complex transformations in Informatica PowerCenter. Optimizing Lookup transformations will significantly help in improving the performance.
When you use Lookup transformations in the mapping, use the concurrent cache. When you use the concurrent cache, Integration Service caches the lookup table data before it starts processing the data from the source; otherwise, the lookup performs caches on a row-wise basis, which takes up more time. So, it is recommended that you enable caching when you use lookups.
If your mapping contains multiple lookups with a lookup on the same lookup table, it is suggested that you share the cache in order to avoid performing the caching multiple times.
You can reduce the processing time if you use the lookup SQL override properly in the Lookup transformation. If you are using lookups to look up a database table, you can use the lookup SQL override to reduce the amount of data you look up. This also helps in saving the cache space.
If you are using more than one lookup condition in a Lookup transformation, it is recommended that you place the conditions in the optimized order, that is, place the equal to (=) condition first, then the less than (<), greater than (>), less than or equal to (<=), greater than or equal to (>=), and at last, not equal to (!=) condition. This enhances the performance.
These were the various ways in which you can find and eliminate mapping and transformations bottlenecks. In the next section, we will talk about the session bottleneck.
Eliminating the session bottleneck
If you do not have source, target, or mapping bottlenecks, you can make session properties check for bottlenecks.
Optimizing the commit interval
The commit interval is the number of records after which Integration Service commits the data into the target. Selecting an appropriate commit interval will help in enhancing the performance. If you select the commit interval as a low value, it will make Integration Service commit data more times, which will hamper the performance.
The buffer memory
When you run the workflow, Integration Service needs to allocate blocks of memory to hold the data at various stages of processing, including caches if required. Make sure that you have sufficient buffer memory available for the processing, else Integration Service fails the process because of lack of memory.
Performance data
Session properties allow you to store the performance-related details to the repository. If you select to save the performance details, Integration Service writes the log to the repository. This will consume processing time. Make sure that you are not checking the option if you do not need to save the performance details.
Eliminating the system bottleneck
The last step in performance enhancement that you can try is to find the bottlenecks in the system. Eliminating system bottlenecks might not be in your control; you can contact your admin team to improve the system capabilities in order to enhance the system's performance.
You can add multiple CPUs to make the process run faster or make the session run in parallel.
You can check with the admin team whether the network is working properly at the optimized speed to confirm whether the processing is optimized.
Contact your admin team to add extra memory if the buffer memory or cache memory is not sufficient. Adding extra space might save the processing time if your cache memory requirements are greater.
Using the previously mentioned performance rules, you can make your process optimized. After taking care of all these rules, if you feel your system is not utilized fully, you can make use of partitioning.
Working on partitioning
Before we learn about partitioning, note that partitioning is a high availability feature that you need to purchase separately from Informatica. If you enable the high availability feature, you can make use of the partitioning functionality.
By default, a mapping containing the source, target, and transformations has a single partition. A single partition means a single record can flow from the source to the target at a time. By adding multiple partitions, you logically divide the mapping into multiple sections, and each section can pass a record at a time. So, if you make three partitions in the mapping, three records can pass through the mapping, thus reducing your runtime by one-third. When you add a partition at any stage of the mapping, Integration Service adds partitions at other stages of the mapping. You need to make sure that you have sufficient memory space and system capacity to handle the processing of multiple records at a time.
If you have 1000 records to process, and you supposedly created four partitions, Integration Service will process four records at a time, and the total time required to process 1000 records will be reduced to a fourth.
To enable partitions, you need to set the partitioning properties in the session task.
Partitioning properties
To enable partitioning, you need to define the following attributes.
Partition points
You can define the partition points in a pipeline. By default, Integration Service sets the partition at various transformations. You can define the partition at any stage in the mapping.
The number of partitions
Based on your system capability, you can increase or decrease the partitions. When you add a partition at any stage of the pipeline, Integration Service adds the same number of partitions at other stages of the mapping. The number of partitions in a mapping should be equal to the number of database connections on the source and target side. When you create partitions, Integration Service processes the data concurrently. Suppose you created three partitions, then Integration Service reads three records from the source, passes three records to transformations, and concurrently loads three records to target.
Partition types
Informatica supports multiple types of partitions to distribute the data. The partition type controls how you wish to divide the data among the partitions you created in the mapping. If you have the high availability feature available, you can define the type of partition at different stages of the mapping. You can define the type of partitioning in session properties. The different types of partitions are mentioned as follows:
· Pass-through: In the pass-through type, Integration Service does not distribute the data among partitions. The data in the particular partition stays in the partition after passing through the partition point.
· Round-robin: In round-robin partitioning, Integration Service distributes the data evenly among the partitions. This makes an equal amount of data to pass through each partition.
· Key range: In key range partitioning, Integration Service distributes the data on the basis of ports, sets, or defined ports. You also define the range of values for each port. When the source and target are partitioned by the key range, select this type of partitioning.
· Database partition: This type of partitioning is possible with the Oracle or DB2 database. When you select database partitioning, Integration Service reads the partitioning information from the nodes in the database.
· Hash auto-keys: In hash auto-key partitioning, Integration Service divides the data based on the partition key using the hash function. All the grouped and sorted ports in transformations are used as partition keys. This type of partition can be used in Rank, Sorter, and Aggregator transformations.
· Hash user keys: Similar to hash auto-keys, Integration Service in this portioning uses the hash function to partition the data. You need to manually define the number of ports for the partition key.
Pushdown optimization
Pushdown optimization is a concept using which you can push the transformation logic on the source or target database side. When you have a source as the database table, you can make use of a SQL override to remove the logic written in the transformation. When you use the SQL override, the session performance is enhanced, as processing the data at a database level is faster compared to processing the data in Informatica. You cannot remove all the transformations from the mapping. The part of transformation logic that can be pushed at the source or target level is referred to as pushdown optimization.
Consider that you have a mapping with a sequence indicated as follows:
Source - Source Qualifier - Filter - Sorter - Aggregator - Expression - Lookup - Rank - Target.
In Filter transformations, we are filtering the data in a particular location. In Sorter transformations, the data is sorted in a particular department ID. In the Aggregator, we are grouping the data in the department ID. In Expression transformations, the unconnected Lookup transformation is called using the :LKP function, and finally, a Rank is used to get the top-salaried employee into the target.
We can remove the Filter transformation, Sorter transformation, and Aggregator transformation by adding the WHERE clause, the ORDER BY clause, and the GROUP BY clause, respectively, in the SQL override in the Source Qualifier transformation. We cannot remove the Expression transformation, as we cannot write the :LKP function in the SQL override.
So, our mapping becomes simple after using the SQL override, which is indicated as follows:
Source - Source Qualifier - Expression - Lookup - Rank - Target.
Using pushdown optimization will help in saving the processing time by extracting fewer number of records of data from the source and also fewer number of records in the transformations.
Summary
In this chapter, we talked about the various techniques using which you can enhance performance. To enhance performance, we talked about source, target, and transformation bottlenecks. Even after optimizing your source, target, and mapping, your performance was not up to date, so we took a look at your session and system bottlenecks. We also saw various ways of optimizing the components of the PowerCenter tool. Later in the chapter, we talked about partitioning and pushdown optimization, using which also you can enhance performance.
With this, we are done with learning all the concepts of the Informatica PowerCenter tool. In this book, you learned concepts that are useful for people with beginner and intermediate level experience in the Informatica tool. We also touched upon a lot of advanced level concepts in this book. With some more practice and theory exposure, you will be able to clear the first level in the Informatica PowerCenter certification.
All materials on the site are licensed Creative Commons Attribution-Sharealike 3.0 Unported CC BY-SA 3.0 & GNU Free Documentation License (GFDL)
If you are the copyright holder of any material contained on our site and intend to remove it, please contact our site administrator for approval.
© 2016-2026 All site design rights belong to S.Y.A.