Relevance Ranking for Vertical Search Engines, FIRST EDITION (2014)
Chapter 8. Aggregated Vertical Search
Abstract
Commercial information access providers increasingly incorporate content from a large number of specialized services created for particular information-seeking tasks. For example, an aggregated Web search page may include results from image databases and news collections in addition to the traditional Web search results; a news provider may dynamically arrange related articles, photos, comments, or videos on a given article page. These auxiliary services, known as verticals, include search engines that focus on a particular domain (e.g., news, travel, sports), search engines that focus on a particular type of media (e.g., images, video, audio), and APIs to highly targeted information (e.g., weather forecasts, map directions, or stock prices). The goal of aggregated search is to provide integrated access to all verticals within a single information context. Although aggregated search is related to classic work in distributed information retrieval, it has unique signals, techniques, and evaluation methods in the context of the Web and other production information access systems. In this chapter, we present the core problems associated with aggregated search, which include sources of predictive evidence, relevance modeling, and evaluation.
Keywords
Aggregated search
vertical selection
vertical presentation
supervised machine learning
online learning
domain adaptation
evaluation
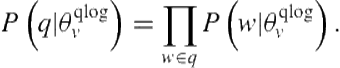
Introduction
Modern search portals such as Google, Bing, and Yahoo! provide access to a wide range of search services in addition to Web search. These search services, commonly referred to as verticals, include highly specialized search engines that focus on a particular type of media (e.g., images, video), search engines that focus on a particular type of search task (e.g., news, local), and applications that return a specific type of information (e.g., weather, stock quotes). In the most general sense, aggregated search is the task of providing integrated access to all these different vertical search services and to the core Web search engine within a common search interface via a single query box and a unified presentation of results.
Given a user’s query, an aggregated search system must make a number of predictions. As one might expect, not every vertical is relevant to every query. If a user issues the query “nyc pizza restaurant locations,” it is almost certain that the user wants local business information and not images. Thus, an important step for an aggregated search system is to present those verticals most likely to be relevant and to suppress those most likely to not be relevant. Moreover, queries are often ambiguous in terms of the user’s actual intent. For example, if a user issues the query “New York style pizza” (Figure 8.1), it is unclear whether the user wants to find a place to eat (in which case local business results might be relevant) or wants to learn to cook New York-style pizza (in which case recipes, how-to videos, and/or images might be relevant). Thus, another important step for an aggregated search engine is to resolve contention between verticals and to present those more likely to be relevant in a more salient way.
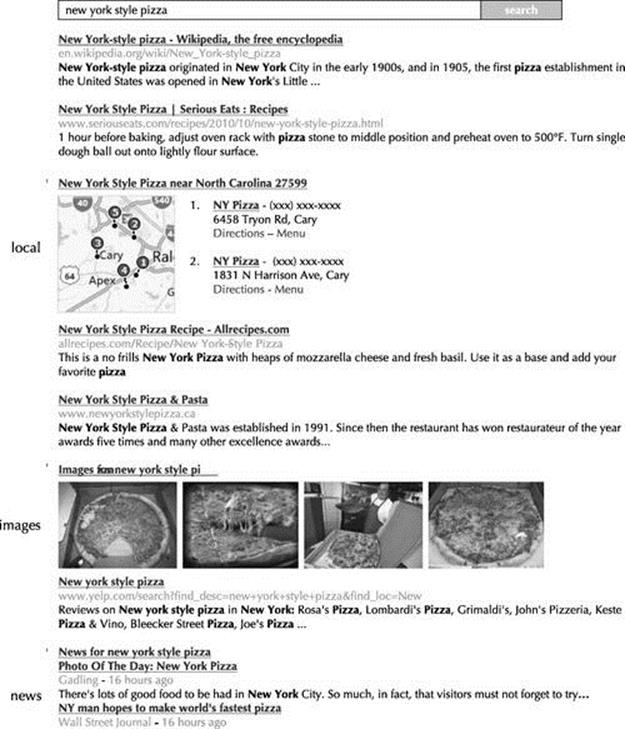
FIGURE 8.1 Given the query “new york style pizza,” an aggregated search system decides to blend results from the local, images, and news verticals into the core Web results.
Aggregated search might seem like a new technology, but it has its roots in a fairly mature subfield of information retrieval called federated search, where the goal is to provide automated search across multiple distributed collections or search engines. And, like most methods of federated search, most aggregated search methods approach the task in two subsequent steps: (1) predicting which verticals to present (vertical selection) and (2) predicting where to present them (vertical presentation). Vertical selection refers to the problem of selecting a subset of relevant verticals, given a query. One way to think about this is as the classification of verticals according to whether or not they should appear on the results page at all. Vertical presentation refers to the problem of interleaving this subset of verticals with the Web results.1
This chapter provides an overview of aggregated search techniques and methods for evaluation. As mentioned, an aggregated search system must make predictions about which vertical(s) are more likely to be relevant to a user’s query. State-of-the-art approaches combine multiple types of evidence to make these decisions. Section 8.1 provides an overview of features used in aggregated search; Section 8.2 provides an overview of machine learning methods for combining features in order to make aggregated search predictions. Section 8.3 focuses on methods for evaluation and covers methods for test collection evaluation and online evaluation. Finally, Section 8.4 covers special topics in aggregated search. Among these, we focus on methods for sharing training data among verticals and methods for eliciting and exploiting implicit user feedback to improve future aggregated search predictions.
8.1 Sources of Evidence
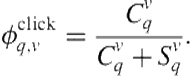
There are many ways in which an aggregated search system might be able to determine that a vertical is relevant to a query. Consider, for example, the task of predicting when to present the news vertical in response to a user’s request. If the query contains the term “news,” this is a strong indication that the news vertical is relevant. That said, not every newsworthy query will contain the term “news.” Consider, for example, the query “presidential debates.” If many of the news articles currently in the news index contain these two query terms (or terms that are semantically related), this might also indicate news vertical intent. In this case, the underlying assumption is that content supply (i.e., an abundance of query-related content in the underlying vertical collection) can help predict content demand. A system might also consider content demand directly. In many cases, users can navigate and issue queries directly to a particular vertical search engine. In a cooperative environment, the aggregated search system might have access to this vertical-specific query stream. Thus, another source of evidence is the number of similar queries issued to the vertical in the recent past. Finally, if a vertical is presented in response to a query, the aggregated search system can keep track of the user’s actions. Although implicit user feedback is subject to different types of bias, by averaging across many users, a system may be able to generate useful evidence for future impressions of the same query or similar queries.
Prior work shows that no single source of evidence can be used to predict that a particular vertical is relevant to a query [15,13,280]. Thus, state-of-the-art approaches tovertical presentation use machine learning to combine multiple types of predictive evidence as features. In this section, we provide an overview of the various types of features used in prior work.
8.1.1 Types of Features
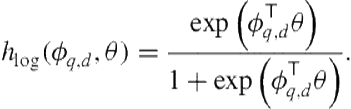
In learning about different types of features, it helps to be aware of their similarities and differences. Broadly speaking, features can be organized along two dimensions. The first dimension relates to whether the value of the feature depends only on the query (is the same for all verticals), only on the vertical (is the same for all queries), or is unique to the vertical-query pair. The second dimension relates to whether the feature value can be generated without issuing the query to the vertical, must be generated after issuing the query to the vertical but before the vertical is presented to a user, or must be generated after the vertical is presented to a user.
With respect to the first dimension (i.e., the source of the feature value), there are three categories. Query features are generated from the query string and their values are independent of the candidate vertical. Examples include whether the query contains a particular term (e.g., “news,” “pics,” or “weather”) or a particular named entity type (e.g., a person, location, or organization). Vertical features are generated from the candidate vertical and their values are independent of the query. Examples include the number of new documents added to the vertical collection or the number of queries issued directly to the vertical search engine in the recent past. Vertical features typically quantify bursts in vertical content supply or demand. Finally, vertical-query features are a function of both the query and the vertical in question. Examples include the number of hits in the vertical collection or the similarity between the query and the vertical’s query stream.
With respect to the second dimension (i.e., the stage at which the feature value can be generated), there are also three categories.Pre-retrieval features can be generated without ever issuing the query to the vertical. Query features (generated from the query, independently from the vertical) and vertical features (generated from the vertical, independently from the query) tend to be pre-retrieval features. In most commercial environments, it is either impractical or impossible to issue every query to every vertical in order to decide which verticals to present and where. Thus, pre-retrieval features have received considerable attention in prior work. Post-retrieval features must be generated by issuing the query to the vertical. Examples include the average recency of the vertical’s top results or the average retrieval score of the vertical’s top results. Post-retrieval features are motivated by the fact that a vertical can be ultimately suppressed in light of poor post-retrieval evidence. For instance, if a vertical search engine retrieves an unusually low number of results, this may indicate that it is not relevant. Finally, post-presentation features are observed after the vertical is presented to a user and are typically derived from actions taken by the user. Post-presentations features typically consist of implicit feedback signals such as clicks and skips on the vertical results, which are thought to be positively or negatively correlated with vertical relevance. Post-presentation features are retrospective. As such, they allow self-assessment of presentation decisions and can be used to inform predictions during future impressions of the same query or similar queries. Figure 8.2 depicts the availability of different features at different stages of decision making.
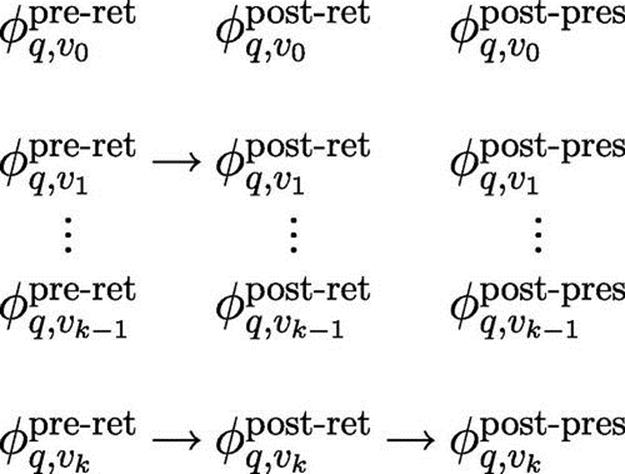
FIGURE 8.2 Feature availability during different stages of decision making. Pre-retrieval features, ![]() , are easy to compute, are available to all verticals, and help with vertical selection decisions. Post-retrieval features,
, are easy to compute, are available to all verticals, and help with vertical selection decisions. Post-retrieval features, ![]() , are computed only for those verticals from which we request results and are useful for making final presentation decisions. Post-presentation features,
, are computed only for those verticals from which we request results and are useful for making final presentation decisions. Post-presentation features, ![]() , are available only after the presentation decision has been made and is useful for evaluating performance and predicting the values of post-presentation features for future issuances of
, are available only after the presentation decision has been made and is useful for evaluating performance and predicting the values of post-presentation features for future issuances of ![]() . Features in gray are not computed or logged during an individual search session because of upstream decisions.
. Features in gray are not computed or logged during an individual search session because of upstream decisions.
Defining features as being pre-retrieval, post-retrieval, or post-presentation deserves additional clarification. One could imagine, for example, a system that caches post-retrieval and post-presentation features for future impressions of a query (Figure 8.3). Caching feature values is particularly useful for head queries, which are seen over and over. Caching post-retrieval and post-presentation feature values enables their use without having to issue the query to the vertical or having to present the vertical to the user. However, based on the terminology used in this chapter, cached features are still considered post-retrieval and post-presentation features. The distinction lies in whether it is necessary to issue the query to the vertical or present the vertical to the user in order to generate theexact feature value for the current query. Vertical collections, vertical query streams, and vertical click behaviors are dynamic. Thus, while post-retrieval and post-presentation features can be cached for future impressions of a query, their values are likely to require periodic, and possibly online, updating.
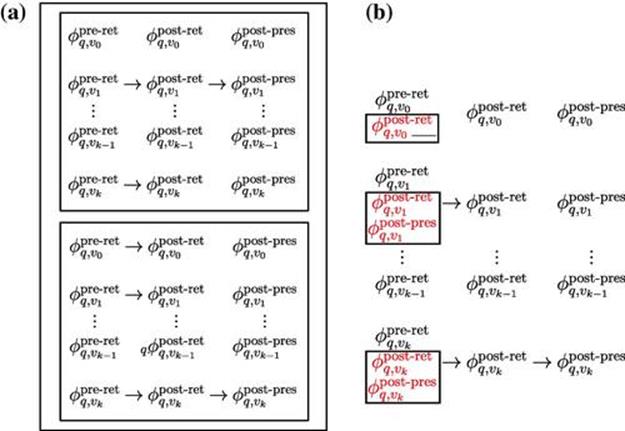
FIGURE 8.3 Feature caching. The left subfigure represents the logged features computed for previous issuances of ![]() , including post-presentation features. The right subfigure represents the availability of cached feature values (red, in boxes) during runtime at the pre-retrieval stage. Note that these are approximations to downstream feature values and may be sensitive to corpus change or user differences.
, including post-presentation features. The right subfigure represents the availability of cached feature values (red, in boxes) during runtime at the pre-retrieval stage. Note that these are approximations to downstream feature values and may be sensitive to corpus change or user differences.
8.1.2 Query Features
Query features are generated from the query string and not from any resource associated with a candidate vertical. As described in more detail in Section 8.2, a predictive relationship between query features and the relevance of a particular vertical must be either hardwired manually or learned using supervised machine learning.
Prior work has experimented with different types of query features. These include features that indicate the presence of a particular term (e.g., “photo,” “weather,” “stocks”) [15,223], a particular named entity type (e.g., the name of a person, location, organization) [15], or a particular entry in a look-up table (e.g., a valid ZIP code or a valid ticker symbol) [15]. Such query features are typically binary-valued and implemented using rule-based triggers.
Query-term features such as those described here capitalize on the fact that certain keywords confidently predict vertical intent. The keyword “pics” suggests that the user wants images, the keyword “showtimes” suggests that the user wants movie times, and the keyword “directions” suggests that the user wants driving directions. Sometimes, however, a query might not have an explicit keyword. Thus, another type of query feature measures the degree of co-occurrence between the query terms and a set of manually identified vertical-specific keywords [13]. Co-occurrence statistics can be derived from the aggregated search system’s own query log. So, for example, given the query “eiffel tower,” the system might consider presenting the images vertical because “eiffel tower” tends to co-occur with terms such as “pics,” “pictures,” and “photos” in the system’s query log.
Among the most successful query features investigated in prior work are query-category features, which measure the query’s affinity to a set of predefined semantic categories [15,280]. Query-category features have been successful for several reasons. First, many verticals investigated in prior work have been topically focused—for example, travel, health, games, music, autos, and sports [15]. Second, query classification has been widely studied for purposes other than aggregated search (see, for example, [312,311,198]). Thus, aggregated search techniques can capitalize on these well-tested approaches for the purpose of feature generation. Finally, although general-purpose query categorization may require making a binary decision about the query’s membership in a category, for the goal of aggregated search this is not required. Query-category features can be real-valued and be associated with the classifier’s confidence values across the set of target categories. This gives the aggregated search model the flexibility of focusing on other types of features when query-category confidence values are uniformly low.
Query categorization is challenging because state-of-the-art classifiers tend to use a bag-of-words representation and queries are usually terse. However, a simple and effective solution is to categorize the query indirectly. That is, to issue the query to a search engine containing manually or even automatically labeled documents and to categorize the query based on the categories assigned to the top-ranked results [312,311]. Let ![]() denote a set of predefined semantic categories (e.g., travel, health, sports, arts, movies, etc.). Given query
denote a set of predefined semantic categories (e.g., travel, health, sports, arts, movies, etc.). Given query ![]() , the confidence value assigned to category
, the confidence value assigned to category ![]() can be computed based on the average confidence value associated with the top-
can be computed based on the average confidence value associated with the top-![]() results (
results (![]() ) weighted by their retrieval score,
) weighted by their retrieval score,
 (8.1)
(8.1)
where ![]() is the confidence value that document
is the confidence value that document ![]() belongs to category
belongs to category ![]() is the retrieval score given to
is the retrieval score given to ![]() in response to
in response to ![]() , and normalizer
, and normalizer ![]() .
.
8.1.3 Vertical Features
Vertical features are generated from the vertical, independent of the query. Therefore, their values are the same for all queries. There are two motivations for using vertical features in a model. First, some verticals are more popular than others, either because they satisfy a wider range of information needs (news vs. stock quotes) or because they satisfy more frequently occurring information needs (weather vs. calculator). Second, user demand for the same vertical is dynamic. A popular news event may trigger a burst in demand for the news vertical, unusual weather may trigger a burst in demand for the weather vertical, and a viral video may trigger a burst in demand for the video vertical.
As described in more detail later in Section 8.2, there are two ways that a model can learn to favor some verticals, irrespective of the query. The first way is to learn different models for different verticals. Most machine learning algorithms harness information about the target class distribution in the training data. The second way is to learn a single model for all verticals, but to add a set of features that signal the identity of the vertical in question. This can be done, for example, by adding one binary feature per candidate vertical. Then, given a query and a particular candidate vertical, the binary feature corresponding to that candidate can be set to 1, and the features corresponding to the other verticals can be set to 0.
In general, modeling bursts in vertical demand can be done in two ways. One way is to generate features directly correlated with vertical demand. To this end, one might generate features from the vertical’s direct query traffic (provided, of course, that the vertical has direct search capabilities) or from clicks on recent presentations of the vertical (provided, of course, that the vertical is clickable). Detecting “bursty states” in a stream of events is a well-studied problem (see, for example, Kleinberg [203]), and such methods can be used to generate features that quantify the current demand for a particular vertical. The other method for modeling content demand is to model content supply, which may be correlated with demand. Such features might include the number of new results added to the vertical collection (e.g., news) or whether the vertical contains up-to-date information (e.g., weather).
8.1.4 Vertical-Query Features
Vertical-query features measure relationships between the vertical and the query and are therefore unique to the vertical-query pair. Vertical-query features can be classified into pre-retrival, post-retrieval, and post-presentation features.
8.1.4.1 Pre-Retrieval Vertical-Query Features
Though it may seem counterintuitive, it is possible to generate vertical-query features without actually issuing the query to the vertical. One alternative is to generate vertical-query features from the vertical’s query traffic. Such features consider the similarity between the query and those issued directly to the vertical by users. A simple similarity measure that has been effective in prior work is the query generation probability, given the vertical’s query-log language model [15,100,16]. Let ![]() denote a language model constructed from vertical
denote a language model constructed from vertical ![]() ’s query log. The query generation probability is given by
’s query log. The query generation probability is given by
 (8.2)
(8.2)
Because queries have different lengths, it becomes important to normalize this value by ![]() .
.
This approach measures the similarity between the query and those issued to the vertical. A simpler alternative is to require an exact match. Diaz [98] used features that considered the proportion of vertical query traffic that corresponded to query ![]() .
.
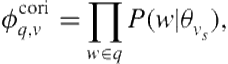
Other pre-retrieval features consider the similarity between the query and content from the vertical. As previously mentioned, aggregated search is related to federated search, where the objective is to provide integrated search across multiple text-based collections. It is often impractical to issue the query to every collection. Thus, the goal of resource selection, which is analogous to vertical selection, is to predict the existence of query-related content in a particular collection without issuing the query to the collection. Many different resource selection methods have been proposed in prior work. Two highly successful ones, which have been used as features during aggregated search, are Collection Retrieval Inference Network (CORI) [49] and RElevant Document Distribution Estimation (ReDDE) [315].
Both resource selection methods use sampled documents. In our case, if a particular vertical collection is accessible only via a search interface, query-based sampling [50] can be used. Query-based sampling is the iterative process of issuing a random query to the search engine, sampling documents from the results, selecting a new term from the current document sample to be used as new sampling query, and continuing until a large enough sample is collected. Usually, between 300–1,000 documents are sampled from each collection.
Of the two methods, CORI is perhaps the simplest. Let ![]() denote the set of documents sampled from vertical
denote the set of documents sampled from vertical ![]() . Given
. Given ![]() candidate verticals, CORI first constructs an index of
candidate verticals, CORI first constructs an index of ![]() large documents, where the large document associated with vertical
large documents, where the large document associated with vertical ![]() is a concatenation of all documents in
is a concatenation of all documents in ![]() . Then, given query
. Then, given query ![]() , CORI scores each vertical
, CORI scores each vertical ![]() according to the retrieval score associated with its large document. So, for example, under the query-likelihood retrieval model, the CORI score given to
according to the retrieval score associated with its large document. So, for example, under the query-likelihood retrieval model, the CORI score given to ![]() in response to
in response to ![]() would be
would be
 (8.3)
(8.3)
where ![]() is the language model associated with
is the language model associated with ![]() .
.
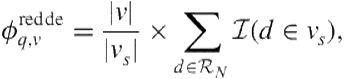
CORI tends to favor collections with the greatest proportion of query-related documents (presumably reflected in the sampled set). However, what we really want are the verticals with the greatest absolute number of query-related documents. ReDDE directly estimates the absolute number of query-related documents in a collection. Instead of turning each set ![]() into a large document, ReDDE constructs an index of all individual documents within all sets of samples. This is referred to as the centralized sample index. Then, given query
into a large document, ReDDE constructs an index of all individual documents within all sets of samples. This is referred to as the centralized sample index. Then, given query ![]() , ReDDE conducts a retrieval from this index and scores vertical
, ReDDE conducts a retrieval from this index and scores vertical ![]() according to
according to
 (8.4)
(8.4)
where ![]() denotes the top
denotes the top ![]() results retrieved from the centralized sample index in response to
results retrieved from the centralized sample index in response to ![]() . ReDDE has an intuitive interpretation. Every document within
. ReDDE has an intuitive interpretation. Every document within ![]() that originates from
that originates from ![]() represents
represents ![]() unobserved query-related documents in
unobserved query-related documents in ![]() . Thus, the summation corresponds to the estimated total number of query-related documents in
. Thus, the summation corresponds to the estimated total number of query-related documents in ![]() .
.
8.1.4.2 Post-Retrieval Vertical-Query Features
In contrast with CORI and ReDDE, which predict the existence of relevant content without issuing the query to the vertical, post-retrieval features focus on the quality of the actual vertical results. Within IR, retrieval effectiveness prediction is the task of assessing the quality of a retrieval without human intervention—for example, based on observable properties of the top-ranked documents. Several methods for retrieval effectiveness prediction have been proposed. Such methods can be used to produce features that predict the quality of the vertical results. Based on these features, if the vertical results are predicted to be bad, a system might decide to suppress them.
Prior work on aggregated search investigated a retrieval effectiveness measure known as Clarity [79]. Clarity makes the assumption that in an effective retrieval, the top results should look different from the “average” document within the collection. Based on this assumption, Clarity [79] uses the Kullback-Leibler divergence to measure the difference between the language of the top ![]() documents and the language of the entire vertical,
documents and the language of the entire vertical,
 (8.5)
(8.5)
where ![]() and
and ![]() are the query and vertical language models, respectively. The query language model can be estimated using the top
are the query and vertical language models, respectively. The query language model can be estimated using the top ![]() vertical results,
vertical results,
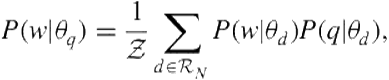 (8.6)
(8.6)
where ![]() is the query likelihood score given
is the query likelihood score given ![]() and
and ![]() . Arguello et al. [15] used Clarity features for vertical selection. Different from the earlier description, however, the retrieval from the vertical was produced locally using sampled documents.
. Arguello et al. [15] used Clarity features for vertical selection. Different from the earlier description, however, the retrieval from the vertical was produced locally using sampled documents.
Other, perhaps simpler features that attempt to capture the quality of the vertical results are possible. One simple heuristic is to include the hit count (i.e., the number of results retrieved from the vertical). Notice that this is not necessarily equal to the number of results blended into the Web results if the vertical is presented. A vertical with an unusually low number of results is probably not relevant. The hit can be particularly informative when the vertical collection is highly dynamic. In prior work, Diaz [98] used the hit count as a feature in predicting news vertical relevance.
Alternatively, we can also include features that are highly vertical-specific and relate to the kinds of things users expect from good results. For instance, news results should be recent and from a reliable news source, local results should be about businesses that are nearby, image results should have a high picture quality, video results should have lots of views, stock quote and weather results should be up to date, and, finally, shopping results should be priced attractively. The possibilities here are vast. For example, any feature used by a vertical-specific ranker could potentially be included as a post-retrieval feature. These features characterize the quality of individual results. Thus, in cases where a vertical retrieves more than one result (e.g., not weather nor finance), these features can be computed by taking the average, minimum, and maximum values from the vertical’s top ![]() results.
results.
Finally, for users to interact with vertical results, those results must be perceived as relevant. Thus, prior work has also considered features generated from the surrogate representation of the vertical results. Examples include number of query terms appearing in the surrogate title and the summary snippet or any other textual element of the surrogate representation [13]. Again, these features require combining the different values from the multiple results in the blended display. One possibility is to use the average, maximum, and minimum values.
8.1.4.3 Post-Presentation Features
Post-presentation features are derived from user actions on previous presentations of the vertical. These can be derived from previous presentations of the vertical for the same query (potentially from other users), previous presentations of the vertical for similar queries (potentially from other users), or previous presentations of the vertical for same-session queries.
The most commonly used post-presentation feature is the vertical-query clickthrough rate [280,279] [280,279]. Let ![]() denote the number of times vertical
denote the number of times vertical ![]() was presented for query
was presented for query ![]() and the user clicked on it, and let
and the user clicked on it, and let ![]() denote the number of times
denote the number of times ![]() was presented for
was presented for ![]() and the user did not click on it. The vertical-query clickthrough rate is given by
and the user did not click on it. The vertical-query clickthrough rate is given by
 (8.7)
(8.7)
The main limitation with this formulation of CTR is that it requires an exact match between the current query and a previously observed query. Suppose a user issues a previously unseen query “ny style pizza” and the system needs to decide whether to presentlocal results. Although the current query has no CTR, if it did it would probably have a CTR similar to that of the query “new york style pizza.” For the purpose of feature generation, there are two ways to exploit clickthrough information from similar queries. One way is to take the average CTR from all previous queries weighted by the query-query similarity,
 (8.8)
(8.8)
where ![]() denotes a previously seen query and
denotes a previously seen query and ![]() .
.
A second way of harnessing clickthrough evidence from similar queries is to build a language model from all previous queries associated with a click on the vertical (allowing duplicates queries) and then to compute the query-generation probability given this language model [13]:
 (8.9)
(8.9)
where ![]() denotes the language model associated with the clicks on vertical
denotes the language model associated with the clicks on vertical ![]() . Again, because queries have different lengths, it becomes important to normalize this value by
. Again, because queries have different lengths, it becomes important to normalize this value by ![]() .
.
Beyond clickthrough information, mouse movement can also be used as a source of post-presentation evidence. One challenge behind interpreting clickthrough data is that nonclicks do not necessarily indicate nonrelevance. It may be that the user did not notice the vertical. Maybe the vertical was presented below the fold, or maybe the user was satisfied by a result presented above it. Previous work shows that mouse hovers are correlated with eye gaze [168]. To date, mouse movement features have not been used in published work on vertical selection or presentation. However, one could imagine features that measure the number of times users hovered over previous presentations of the vertical but did not click on them. If effective, this type of evidence could be also extended to similar queries as described.
8.1.5 Implementation Details
At this point, it is important to take notice of two nuances associated with aggregated search features. First, not every feature will be available for every vertical. Consider, for example, ReDDE features, which use sampled vertical content to predict the quantity of query-related content in a vertical collection. A ReDDE feature does not make sense for a vertical that is not associated with a document collection (e.g., calculator). Likewise, some verticals do not have direct-search capabilities (e.g., weather). Thus, these verticals would not have features derived from the vertical query stream. As discussed in the next section, methods for combining evidence must accommodate the fact that different verticals will be associated with different sets of features. Second, some features (particularly query features) are likely to be correlated with relevance differently for different verticals. Consider, for example, a feature that indicates whether the query contains the term “news.” This feature is likely to be positively predictive of the news vertical but negatively predictive of the recipes vertical. Thus, methods for combining evidence are likely to be more effective if they can learn a vertical-specific relation between features and vertical relevance.
Aggregated search requires combining many different types of features. In this section, we considered features derived from the query string, from the vertical query log, from sampled vertical content, from the actual vertical results, and from previous presentations of the vertical. In the next section, we present an overview of methods for combining features for making predictions.
8.2 Combination of Evidence
In Section 8.1, we described several signals believed to be correlated with vertical relevance. In this section, we describe how to combine those signals to make vertical selection and vertical presentation decisions.
8.2.1 Vertical Selection
The task of vertical selection refers to picking those verticals likely to appear on a good aggregated search results page. We can rephrase the task as follows: Given a query and a vertical, predict whether the vertical should be included on the search results page. Formally, let ![]() be the set of
be the set of ![]() candidate verticals. We would like to learn a function that maps a query-vertical pair to relevance,
candidate verticals. We would like to learn a function that maps a query-vertical pair to relevance, ![]() . Throughout this section, to maintain a general perspective, we remain agnostic about what we mean by functions, queries, and relevance. Nevertheless, when necessary, we adopt certain definitions that admit experimentally supported approaches.
. Throughout this section, to maintain a general perspective, we remain agnostic about what we mean by functions, queries, and relevance. Nevertheless, when necessary, we adopt certain definitions that admit experimentally supported approaches.
8.2.1.1 Training Data
All of our algorithms require training data encoding examples of relevant and nonrelevant query-vertical pairs, ![]() . There are two general methods for gathering training data. In a laboratory setting, assessors are provided with detailed relevance guidelines and then asked to judge the relevance of individual
. There are two general methods for gathering training data. In a laboratory setting, assessors are provided with detailed relevance guidelines and then asked to judge the relevance of individual ![]() pairs. The assessment might be query-driven (e.g., “for each query, request relevance judgments for all verticals”) or vertical-driven (e.g., “for each vertical, request relevance judgments for many queries”). In query-driven assessment, editors are explicitly more aware of competing user intentions and may make judgments differently than they do with vertical-driven assessment. In either case, query sampling is crucial to training a model that can compute a reliable relevance grade for individual verticals and a calibrated relevance grade for comparison across verticals. To provide quality control,
pairs. The assessment might be query-driven (e.g., “for each query, request relevance judgments for all verticals”) or vertical-driven (e.g., “for each vertical, request relevance judgments for many queries”). In query-driven assessment, editors are explicitly more aware of competing user intentions and may make judgments differently than they do with vertical-driven assessment. In either case, query sampling is crucial to training a model that can compute a reliable relevance grade for individual verticals and a calibrated relevance grade for comparison across verticals. To provide quality control, ![]() pairs are usually judged by multiple assessors. Editorial assessment requires some overhead in terms of time (e.g., recruiting assessors, drafting guidelines, verifying labels) and money (e.g., paying assessors). Although crowdsourcing systems address some of these costs, editorial assessment also suffers because judgments are requested outside of a search context, resulting in relevance judgments that are only as good as the assessor’s guess of the user intention. For example, local-intent queries almost always require an assessor with some familiarity about the hypothetical user’s location; a naïve crowdsourced system may ask for a judgment from an assessor in a different city or country.
pairs are usually judged by multiple assessors. Editorial assessment requires some overhead in terms of time (e.g., recruiting assessors, drafting guidelines, verifying labels) and money (e.g., paying assessors). Although crowdsourcing systems address some of these costs, editorial assessment also suffers because judgments are requested outside of a search context, resulting in relevance judgments that are only as good as the assessor’s guess of the user intention. For example, local-intent queries almost always require an assessor with some familiarity about the hypothetical user’s location; a naïve crowdsourced system may ask for a judgment from an assessor in a different city or country.
If we have access to a production aggregated search system, we can gather labels through implicit feedback. For example, if we have access to log data that includes vertical result presentation, we can hypothesize that a user click on a vertical result implies relevance. This allows us to collect a large set of tuples with no editorial cost. Data from implicit feedback carries its own issues. First, the labels are subject to bias effects from the layout constraints (i.e., not every vertical can be displayed for every query to the system), position (i.e., items higher in the page receive more clicks), or presentation (i.e., presentations such as images attract more clicks than other presentations). Furthermore, a click does not necessarily imply relevance; a user may have clicked accidentally or not found what they were looking for from the click. This effect can be mitigated by the large amount of data gathered in production systems.
Regardless of the source of training data, throughout this section we use the notation ![]() to refer to the multiset of judged query-vertical pairs. Let the multisets
to refer to the multiset of judged query-vertical pairs. Let the multisets ![]() and
and ![]() partition
partition ![]() into relevant and nonrelevant instances, respectively.
into relevant and nonrelevant instances, respectively.
8.2.1.2 Basic Models
There are several ways we might construct the function ![]() using
using ![]() . Perhaps the most straightforward way would be to manually enumerate which query-vertical pairs are likely to be relevant:
. Perhaps the most straightforward way would be to manually enumerate which query-vertical pairs are likely to be relevant:
 (8.10)
where ![]() is the subset of
is the subset of ![]() containing
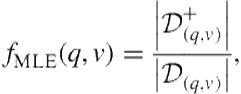
containing ![]() . In other words, we are counting the fraction of presentations for that query that resulted in a relevant judgment with
. In other words, we are counting the fraction of presentations for that query that resulted in a relevant judgment with ![]() . We refer to this figure as the maximum likelihood estimate of relevance for a query-vertical pair. Unfortunately, because we can never judge every query—even in a production setting—most of the queries we want to be able to make predictions on will not be in
. We refer to this figure as the maximum likelihood estimate of relevance for a query-vertical pair. Unfortunately, because we can never judge every query—even in a production setting—most of the queries we want to be able to make predictions on will not be in ![]() . Even if we gather a large amount of data in a production setting, the skewed query frequency distribution suggests that we will observe only a handful of impressions for most queries, resulting in a poor estimation of the relevance.
. Even if we gather a large amount of data in a production setting, the skewed query frequency distribution suggests that we will observe only a handful of impressions for most queries, resulting in a poor estimation of the relevance.
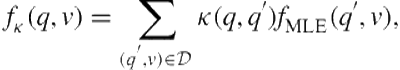
We can improve the coverage of the maximum likelihood estimate by exploiting the topical similarity between queries. Because queries can be represented as very sparse term vectors, any of the standard term-based similarity measures can be used [301]. Queries specifically have been studied in the literature and admit unique similarity measures [256,300,367]. Given such a similarity measure, we can compare a new query to those queries we have previously judged. For example, we can define a function
 (8.11)
where ![]() is the similarity between two queries. In other words, we are smoothing the estimates from the maximum likelihood estimate using similar queries [99]. We refer to the result as the kernel estimate of relevance for a query-vertical pair. In this case, our coverage increases to include similar queries. However, depending on the robustness of our similarity measure, this may not be sufficient. For example, assume that we have hired editors to manually generate a set of relevant queries for an image vertical. If our image vertical contains a large number of cat pictures, but editors did not manage to label “cat” as a relevant query for the image vertical, our feline-inclined users will not discover these fascinating pictures. Therefore, it is important to understand that the effectiveness of
is the similarity between two queries. In other words, we are smoothing the estimates from the maximum likelihood estimate using similar queries [99]. We refer to the result as the kernel estimate of relevance for a query-vertical pair. In this case, our coverage increases to include similar queries. However, depending on the robustness of our similarity measure, this may not be sufficient. For example, assume that we have hired editors to manually generate a set of relevant queries for an image vertical. If our image vertical contains a large number of cat pictures, but editors did not manage to label “cat” as a relevant query for the image vertical, our feline-inclined users will not discover these fascinating pictures. Therefore, it is important to understand that the effectiveness of ![]() is the topical nature of the query similarity. Nevertheless, techniques based on query similarity have been found to be a strong baseline [223].
is the topical nature of the query similarity. Nevertheless, techniques based on query similarity have been found to be a strong baseline [223].
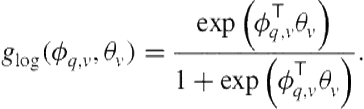
We can address the issues with query similarity by using the signals described in Section 8.1. Specifically, our approach will be to learn ![]() as a function from features of the query-vertical pair to relevance. That is,
as a function from features of the query-vertical pair to relevance. That is,
![]() (8.12)
(8.12)
where ![]() is the
is the ![]() vector of
vector of ![]() feature values described earlier and
feature values described earlier and ![]() is a vector model parameter for that specific vertical. We have a set of model parameters for each vertical because the relationship between a feature and relevance is likely to be dependent on the vertical (e.g., the feature “query contains picture” is likely to be positively correlated with the image vertical but negatively with other verticals). We suspect that similar queries will have similar feature vectors; therefore, the behavior of
is a vector model parameter for that specific vertical. We have a set of model parameters for each vertical because the relationship between a feature and relevance is likely to be dependent on the vertical (e.g., the feature “query contains picture” is likely to be positively correlated with the image vertical but negatively with other verticals). We suspect that similar queries will have similar feature vectors; therefore, the behavior of ![]() is preserved. In addition, though, we can generalize to those queries with similar feature vectors but with potentially different topics. The function
is preserved. In addition, though, we can generalize to those queries with similar feature vectors but with potentially different topics. The function ![]() has two arguments: features and model parameters. Features are often encoded as a vector of scalar and binary values according to the definitions in Section 8.1. We might use a subset of features—for example, only the pre-retrieval features—or all features, depending on the cost or availability. The model parameters represent the knobs used to tune the model, given some training data. The precise definition of
has two arguments: features and model parameters. Features are often encoded as a vector of scalar and binary values according to the definitions in Section 8.1. We might use a subset of features—for example, only the pre-retrieval features—or all features, depending on the cost or availability. The model parameters represent the knobs used to tune the model, given some training data. The precise definition of ![]() depends on the functional form of
depends on the functional form of ![]() . If we are using logistic regression for
. If we are using logistic regression for ![]() , then
, then ![]() is a length
is a length ![]() vector of feature weights and our functional form is the inner product between
vector of feature weights and our functional form is the inner product between ![]() and
and ![]() ,
,
 (8.13)
Given a functional form, we tune ![]() such that classification errors on our training data are minimized. In the case of logistic regression, we minimize the logistic loss using an iterative technique such as the Newton-Raphson method. Many other functional forms exist in the machine learning literature. A full review is beyond the scope of this chapter.
such that classification errors on our training data are minimized. In the case of logistic regression, we minimize the logistic loss using an iterative technique such as the Newton-Raphson method. Many other functional forms exist in the machine learning literature. A full review is beyond the scope of this chapter.
Moving forward, we will adopt probabilistic versions of ![]() . That is, we will adopt the notation
. That is, we will adopt the notation
![]() (8.14)
(8.14)
to indicate that a score for a query-vertical pair ![]() can be interpreted as a probability of relevance. More concretely, the probability
can be interpreted as a probability of relevance. More concretely, the probability ![]() is the maximum likelihood probability of relevance,
is the maximum likelihood probability of relevance, ![]() is the kernel density estimate of relevance, and
is the kernel density estimate of relevance, and ![]() is a parametric model of relevance. In principle, the techniques in the remainder of the chapter can be extended to nonprobabilistic paradigms.
is a parametric model of relevance. In principle, the techniques in the remainder of the chapter can be extended to nonprobabilistic paradigms.
8.2.1.3 Advanced Models
Each of the models presented in the previous section has advantages and disadvantages: ![]() may be effective for judged query-vertical pairs, but the coverage is low;
may be effective for judged query-vertical pairs, but the coverage is low; ![]() does not generalize to topics outside of
does not generalize to topics outside of ![]() , and
, and ![]() may not capture topical similarity. In this section, we present one way of combining these approaches in a single framework [98].
may not capture topical similarity. In this section, we present one way of combining these approaches in a single framework [98].
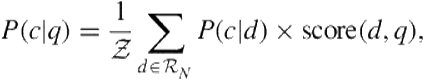
Although ![]() suffers from low coverage, for those queries where we have reliable judgements, performance is strong; Eq. 8.10 becomes more accurate with increasing data. On the other hand, our machine learned estimate
suffers from low coverage, for those queries where we have reliable judgements, performance is strong; Eq. 8.10 becomes more accurate with increasing data. On the other hand, our machine learned estimate ![]() provides an effective method when there is no data but does not change observed judgments (e.g., if the system presents that vertical to real users). One way to combine these two methods is with Bayesian updating. The intuition with Bayesian updating is that, in the absence of (enough) data for a specific query, we can use
provides an effective method when there is no data but does not change observed judgments (e.g., if the system presents that vertical to real users). One way to combine these two methods is with Bayesian updating. The intuition with Bayesian updating is that, in the absence of (enough) data for a specific query, we can use ![]() to estimate the relevance; after observing judgments from editors or from query logs, we can adjust this estimate. So, instead of modeling the precise probability of relevance, we are estimating a distribution over the value of the probability of relevance. Let
to estimate the relevance; after observing judgments from editors or from query logs, we can adjust this estimate. So, instead of modeling the precise probability of relevance, we are estimating a distribution over the value of the probability of relevance. Let ![]() be this distribution. If we assume that the parametric form of this distribution is the beta distribution, then we can define it as
be this distribution. If we assume that the parametric form of this distribution is the beta distribution, then we can define it as
![]() (8.15)
(8.15)
where we set the beta parameters such that
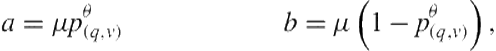 (8.16)
where ![]() is a hyperparameter of our model. That is, absent any data, the distribution over the probability of relevance is strictly a function of the
is a hyperparameter of our model. That is, absent any data, the distribution over the probability of relevance is strictly a function of the ![]() and
and ![]() .
.
Assume that we have observed some positive and negative feedback for a query-vertical pair. Then, the posterior, given these data, is also a beta distribution,
 (8.17)
and the posterior mean,
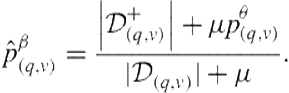 (8.18)
Note here that we can gain an intuition for ![]() . For small values of
. For small values of ![]() , the model will be very sensitive to early feedback from the user. For large values, the model will rely on
, the model will be very sensitive to early feedback from the user. For large values, the model will rely on ![]() more than feedback.
more than feedback.
The hypothesis underlying the kernel density estimate was that a query’s probability of being relevant is related to the relevance of topically related queries. We can incorporate information from related queries as pseudo-judgments on the candidate query. Specifically, we can define the aggregated information for a query as
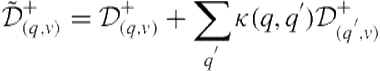 (8.19)
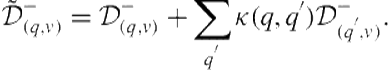 (8.20)
We can use these modified counts in the same way we used the original counts in Eq. 8.18.
8.2.2 Vertical Presentation
Vertical presentation refers to deciding precisely where to place relevant verticals on the search results page. For simplicity, we constrain our discussion to a ranked list of Web documents interleaved with vertical results.
8.2.2.1 Pointwise Interleaving
According to Robertson, any ranked list of results to a user query should be ordered according each item’s probability of relevance [291]. Since an aggregator interleaves vertical result blocks with Web documents, we can assert that the presentation problem reduces to estimating the probability of vertical relevance (Section 8.2.1.3). Let ![]() be the probability that Web document
be the probability that Web document ![]() is relevant to query
is relevant to query ![]() . If this probability is defined for all documents and we use a probabilistic vertical selection algorithm, then we can interleave items by the probabilities. The rank of
. If this probability is defined for all documents and we use a probabilistic vertical selection algorithm, then we can interleave items by the probabilities. The rank of ![]() in the interleaved list is
in the interleaved list is
 (8.21)
where ![]() is our collection of Web documents. Because we are interested in estimating the probability of relevance of each vertical and document, we refer to this as pointwise interleaving.
is our collection of Web documents. Because we are interested in estimating the probability of relevance of each vertical and document, we refer to this as pointwise interleaving.
Unfortunately, the assumptions underlying probabilistic interleaving are rarely satisfied. The scores returned by Web rankers are not guaranteed to be probabilities. For example, many modern learning-to-rank approaches rank documents by an arbitrary scalar value output by the ranking model. Even if Web document scores are probabilities, the values are unlikely to be well calibrated with the vertical selection scores, resulting in poor interleaving [142].
One strategy for comparing ![]() to a document retrieval score is to transform the original document score output by the Web search engine to a probability. If there are relevance labels available for
to a document retrieval score is to transform the original document score output by the Web search engine to a probability. If there are relevance labels available for ![]() pairs, then we can learn a statistical model to do this transformation [7]. Specifically, we can learn a logistic regression model in the same way as in Eq. 8.13,
pairs, then we can learn a statistical model to do this transformation [7]. Specifically, we can learn a logistic regression model in the same way as in Eq. 8.13,
 (8.22)
In this case, the features would, at a minimum, include the document score. Although we can add other features of the document, there is the temptation to begin adding large numbers of features to this model. There are two reasons to be cautious with feature addition. First, we want to avoid rebuilding a Web ranking algorithm; we only need to calibrate a score that, conceivably, has been independently and rigorously tested to predict relevance, albeit on a different scale. Second, feature computation, especially for Web documents, can be expensive if, for example, the value is stored in an index on a separate server. Furthermore, there is bandwidth overhead for the Web ranker to expose the entire feature vector used for core ranking.
In cases where interleaving decisions need to be made without knowledge of the Web document ranking scores, we can use position-based models to make interleaving decisions [280]. A position-based interleaving model is similar to the score transformation described in Eq. 8.22 except our only feature is the position of the document. As a result, we predict a fixed probability of relevance for each position in the ranking, regardless of the documents or their scores. Given probabilistic vertical selection scores, the vertical presenter can position each vertical according to
 (8.23)
where ![]() is the predicted probability of relevance of rank position
is the predicted probability of relevance of rank position ![]() .
.
8.2.2.2 Pairwise Interleaving
Given an accurate and calibrated probability of relevance for each document and vertical, pointwise interleaving should provide an optimal ranking. In reality, estimating the true probability of relevance is very difficult. In fact, estimating the probability of relevance may be an inappropriate target if we are only interested in the relative relevance of verticals and documents. The user is never exposed to the absolute probability of relevance and is only concerned that more relevant items are places above less relevant items. Therefore, we may want to focus our modeling effort on predicting users’ preference users between pairs of items, given a query. Modeling the order of items instead of the absolute relevance is precisely the goal of pairwise interleaving.
Although the optimization target for pairwise interleaving differs from that for pointwise interleaving, many of the fundamentals are the same. Specifically, we are still interested in learning a function ![]() with two differences. First, the domain includes the “web result” argument for determining the preference between a vertical and a Web result. This is similar to the task of estimating
with two differences. First, the domain includes the “web result” argument for determining the preference between a vertical and a Web result. This is similar to the task of estimating ![]() in the previous section. Second, for pairwise models, our range is the set of the reals. That is, we are only interested in a function that outputs a real value, unconstrained by modeling the exact probability of relevance. Our objective is to find
in the previous section. Second, for pairwise models, our range is the set of the reals. That is, we are only interested in a function that outputs a real value, unconstrained by modeling the exact probability of relevance. Our objective is to find ![]() such that, given a query, the values for more relevant verticals or documents are larger than the values for less relevant verticals. The precise training of such models is studied in the field known as learning to rank (LTR) [227].
such that, given a query, the values for more relevant verticals or documents are larger than the values for less relevant verticals. The precise training of such models is studied in the field known as learning to rank (LTR) [227].
Casting pairwise interleaving as a learning-to-rank problem requires training a single model ![]() to predict an item’s rank, irrespective of its type (e.g., image, local, Web result). In our situation, this is problematic because different item types are associated with different features (i.e., some features may be specific to a handful of types, and some may be unique to a particular one). In addition, it is problematic because those features that are common to multiple types (e.g., whether the query contains a city name) may be predictive for some types more than others or even predictive for different types in the opposite direction. Next we propose three LTR variants that address these challenges in different ways. Each variant makes a different assumption about how features may be correlated with item relevance across item types.
to predict an item’s rank, irrespective of its type (e.g., image, local, Web result). In our situation, this is problematic because different item types are associated with different features (i.e., some features may be specific to a handful of types, and some may be unique to a particular one). In addition, it is problematic because those features that are common to multiple types (e.g., whether the query contains a city name) may be predictive for some types more than others or even predictive for different types in the opposite direction. Next we propose three LTR variants that address these challenges in different ways. Each variant makes a different assumption about how features may be correlated with item relevance across item types.
8.2.2.2.1 Equally Correlated Features
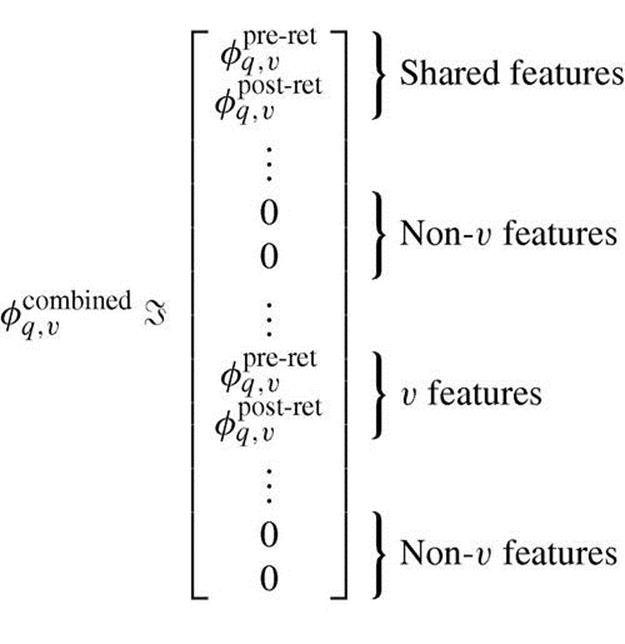
One alternative is to assume that each feature is equally predictive of item relevance (in the same direction) independent of the item type:
 (8.24)
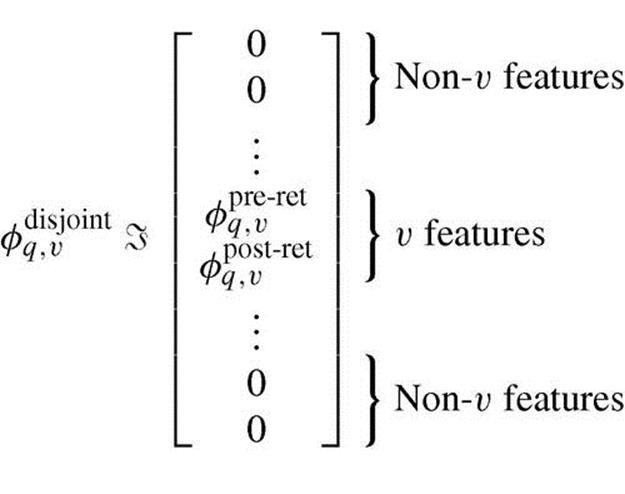
where ![]() is a column vector of pre-retrieval features and
is a column vector of pre-retrieval features and ![]() is a column vector of post-retrieval features. The feature representation is as follows: Pre-retrieval features,
is a column vector of post-retrieval features. The feature representation is as follows: Pre-retrieval features, ![]() , are independent of the item. This model uses a single copy of each pre-retrieval feature. The values of post-retrieval features are item-specific (i.e., they are generated directly from the item or the item’s search engine results). As with pre-retrieval features, this approach also uses a single copy of each post-retrieval feature in the subvector
, are independent of the item. This model uses a single copy of each pre-retrieval feature. The values of post-retrieval features are item-specific (i.e., they are generated directly from the item or the item’s search engine results). As with pre-retrieval features, this approach also uses a single copy of each post-retrieval feature in the subvector ![]() . If an item is not associated with a particular post-retrieval feature, then the feature is zeroed-out in that instance. Consider, for example, our post-retrieval features that determine the text similarity between the query and the summary snippets presented in the item. These features may only be associated with news and Web result items. Therefore, if the item is not one of these types, all these features are zeroed-out. This approach assumes that features are equally correlated with relevance irrespective of the item type. Once trained, model
. If an item is not associated with a particular post-retrieval feature, then the feature is zeroed-out in that instance. Consider, for example, our post-retrieval features that determine the text similarity between the query and the summary snippets presented in the item. These features may only be associated with news and Web result items. Therefore, if the item is not one of these types, all these features are zeroed-out. This approach assumes that features are equally correlated with relevance irrespective of the item type. Once trained, model ![]() will apply the same parameters to a feature independent of the instance’s item type.
will apply the same parameters to a feature independent of the instance’s item type.
8.2.2.2.2 Uniquely Correlated Features
We can also assume that every feature—whether it is a pre- or post-retrieval feature—is uniquely correlated with relevance across different item types. The feature representation is as follows: We make a separate, item type-specific copy of each feature. So, for example, given ![]() item types, we make
item types, we make ![]() copies of each pre-retrieval feature (one per item type). Given an instance, all copies are zeroed-out except for those corresponding to the instance’s item type. For post-retrieval features, we make one copy per item type for which the feature is available. That is,
copies of each pre-retrieval feature (one per item type). Given an instance, all copies are zeroed-out except for those corresponding to the instance’s item type. For post-retrieval features, we make one copy per item type for which the feature is available. That is,
 (8.25)
Consider, for example, our temporal features, which are available for items from blogs, community Q&A, news, and twitter. We make four copies of each temporal feature.
This approach assumes that features are correlated differently with relevance depending on the item type. Once trained, model ![]() will apply a different
will apply a different ![]() subset, depending on the instance’s item type. Although this added flexibility may be advantageous, the increased number of features may introduce predictive noise and result in overfitting. Thus, this LTR variant may require more training data than the model described in the previous section.
subset, depending on the instance’s item type. Although this added flexibility may be advantageous, the increased number of features may introduce predictive noise and result in overfitting. Thus, this LTR variant may require more training data than the model described in the previous section.
8.2.2.2.3 Equally and Uniquely Correlated Features
The previous two approaches make opposite assumptions: Features are either equally correlated or uniquely correlated with relevance for different item types. A third alternative is to make neither assumption a priori but to give the algorithm the freedom to exploit both types of relationship using training data.
For this approach, we maintain a single copy of each pre- and post-retrieval feature that is shared across all item types. As before, if an instance’s item type is not associated with a shared feature, the feature is zeroed-out for that instance. In addition to these shared features, we make one item type-specific copy of each pre- and post-retrieval feature. Given an instance, all copies corresponding to types other than the instance’s item type are zeroed-out. That is,
 (8.26)
The canonical feature representation for this approach is the union of features used by the previous two approaches.
This approach makes no assumption about how a feature is correlated with relevance across item types. If a feature is equally correlated across item types, the algorithm can assign a large (positive or negative) weight to the copy of the feature that is shared across types. Alternatively, if a feature is correlated differently for different item types, the algorithm can assign a large positive weight to some copies of the feature and a large negative weight to others. Of all three LTR variants, this one has the largest number of features and may therefore need the most training data to avoid overfitting.
8.3 Evaluation
Evaluation is essential to all subfields of information retrieval, and the same is true for aggregated search. In general, the goal of evaluation is to facilitate the objective comparison between different algorithms, different features, and different parameter settings. As previously mentioned, aggregated search is viewed as a two-step process: predicting which verticals to present (vertical selection) and predicting where in the Web results to present them (vertical presentation). In some situations, it is desirable to evaluate the vertical selection component in isolation. Given a query, the goal for the vertical selection component is to select those verticals that are relevant and suppress those verticals that are not relevant. In other situations, the goal is to evaluate the end-to-end aggregated search solution. In this case, the goal for the system is not only to select the relevant verticals but to present those verticals that are more likely to be relevant in a more salient way. In practice, this means presenting the most relevant verticals higher in the aggregated results. In the following sections, we present an overview of methods for aggregated search evaluation. First we focus on vertical selection evaluation, and then we focus on end-to-end evaluation.
8.3.1 Vertical Selection Evaluation
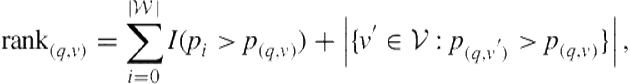
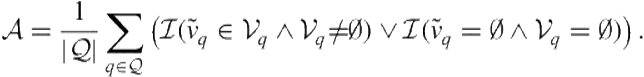
Vertical selection is the task of deciding which verticals to present along with the core Web results for a given query. From the perspective of evaluation, the best vertical selection system is the one that selects the relevant verticals and avoids selecting the ones that are not relevant. In this respect, vertical selection can be evaluated like any other multiclass classification problem, using metrics such as accuracy, which summarizes performance for all verticals, or precision and recall, which summarize performance for each vertical independently.
Let ![]() denote the set of evaluation queries and
denote the set of evaluation queries and ![]() denote the set of candidate verticals. Vertical selection evaluation requires knowing which verticals are truly relevant to each evaluation query
denote the set of candidate verticals. Vertical selection evaluation requires knowing which verticals are truly relevant to each evaluation query ![]() . Let
. Let ![]() denote the set of verticals that are truly relevant to query
denote the set of verticals that are truly relevant to query ![]() , and let
, and let ![]() denote the set of verticals that are predicted relevant to
denote the set of verticals that are predicted relevant to ![]() . A commonly used evaluation metric for vertical selection evaluation is accuracy. Given a query
. A commonly used evaluation metric for vertical selection evaluation is accuracy. Given a query ![]() , a vertical selection component must make
, a vertical selection component must make ![]() predictions. That is, for each vertical
predictions. That is, for each vertical ![]() , it must decide whether to present the vertical or to suppress it. Accuracy measures the percentage of correct predictions and is computed as
, it must decide whether to present the vertical or to suppress it. Accuracy measures the percentage of correct predictions and is computed as
 (8.27)
where ![]() denotes the indicator function (equals 1 if its argument is true and 0 otherwise).
denotes the indicator function (equals 1 if its argument is true and 0 otherwise).
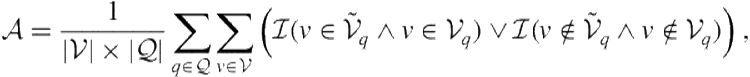
Other measures used in multiclass classification are also possible. For example, one can also calculate precision, recall, and ![]() -measure with respect to each vertical and then possibly average across candidate verticals to obtain a single measure. Let
-measure with respect to each vertical and then possibly average across candidate verticals to obtain a single measure. Let ![]() denote the set of queries for which vertical
denote the set of queries for which vertical ![]() is truly relevant and
is truly relevant and ![]() denote the set of queries for which vertical
denote the set of queries for which vertical ![]() is predicted to be relevant. Precision, recall, and
is predicted to be relevant. Precision, recall, and ![]() -measure with respect to vertical
-measure with respect to vertical ![]() are given by
are given by
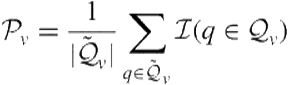 (8.28)
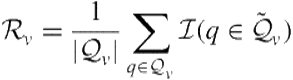 (8.29)
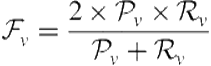 (8.30)
In prior vertical selection evaluations, Arguello et al. [15] addressed the task of single vertical selection (a more simplified version of the full vertical selection task). During single vertical selection, the goal is to predict a single relevant vertical, if one exists, or to predict that no vertical is relevant. Let ![]() denote a system’s single vertical prediction and
denote a system’s single vertical prediction and ![]() denote the prediction that no vertical is relevant. In this work, accuracy was measured according to
denote the prediction that no vertical is relevant. In this work, accuracy was measured according to
 (8.31)
Li et al. [223] compared approaches to vertical selection by constructing interpolated precision-recall (PR) curves for each candidate vertical. Precision and recall for a vertical can be computed as described earlier, and different precision and recall operating points can be derived by sweeping the classifier’s prediction confidence threshold. Usually, the higher the threshold, the higher the precision and the lower the recall. This evaluation method has the advantage of providing a more complete picture of the tradeoff between precision and recall for different approaches.
As previously mentioned, vertical selection evaluation requires knowing which verticals are relevant to each query. Arguello et al. [15] and Li et al. [223] used trained assessors. Assessors with expert knowledge about the various candidate verticals were given a set of queries (sampled from a commercial query log) and were asked to determine which verticals, if any, were likely to be relevant to each query. This method of assessment has two potential drawbacks. First, queries are often ambiguous. Therefore, it may be difficult for an assessor to determine the user’s actual intent. Second, the assessments do not consider the vertical’s relevance within the context of the core Web results.
Diaz [98] and König et al. [204] evaluated vertical selection for the news vertical in a production environment. The gold-standard data were collected using a commercial system, where a small fraction of query traffic was always presented the news vertical above the core Web results. Relevance judgments were derived from clickthrough data, and because the vertical was always presented, all news clicks and skips were observed. In other words, retrospectively, the data collection included queries for which the news vertical should not be selected based on observed skips. Features were generated and cached to allow repeated experimentation after the data collection phase. Evaluation was conducted using accuracy, defined here as the percentage of correctly predicted clicks and skips.
8.3.2 End-to-End Evaluation
Vertical selection evaluation is more clearly defined than end-to-end aggregated search evaluation. Consider, for example, the aggregated results shown in Figure 8.1. The basic end-to-end evaluation questions is: How good are these results? If the system presentedvideo results instead of image results, would the presentation be better? And what about more subtle changes? For instance, what if the local vertical was presented above the first Web result? Would this be better? Would it really make a difference?
End-to-end aggregated search evaluation falls under three broad categories: test collection evaluation, online evaluation, and user study evaluation. Test collection evaluation builds on the Cranfield IR evaluation paradigm [73]. A test collection typically includes a set of queries, a set of systems (i.e., a set of verticals and core content providers) with responses to those queries, and a set of relevance judgements on the vertical and Web results. Given these three components, evaluation measures can be computed on any given aggregation of results. Online evaluation focuses on implicit user feedback from real users in an operational setting. Implicit feedback measures typically focus on clicks and skips, where clicks are usually treated as positive feedback and skips are usually treated as negative feedback. Finally, user study evaluation involves having users perform search tasks with different aggregated search systems in a controlled environment. Evaluation measures are derived from outcome measures thought to be correlated with a positive user experience or from responses to questions given to study participants.
All three evaluation methodologies have advantages and disadvantages and can be used to answer different types of research questions. Once a test collection is built, evaluation is basically free and results are reproducible. This makes test collection evaluation an attractive alternative for fine-tuning parameters. However, test collection evaluation assumes that collections are static and that relevance judgments from assessors are consistent with those made by real users. Online evaluation methods use real users in real situations. However, because evaluation measures are computed using implicit feedback signals, precision can be estimated more accurately than recall. That is, the operational system can observe false-positive mistakes but not false-negative mistakes. Finally, user study evaluation gives the researcher more control than online evaluation. For example, the researcher can learn about participants’ backgrounds, can manipulate the higher-level search task, and can manipulate the search context. Such variables cannot be controlled and cannot be easily identified in an online setting. On the other hand, user studies are expensive and time consuming. For all these reasons, all three evaluation methodologies are important and all three are necessary to measure improvement and understand user behavior.
8.3.2.1 Test Collection Evaluation
Test collection evaluation follows the Cranfield evaluation paradigm [73] and has the following components: a static collection of retrievable items, a set of queries with topic descriptions that define what should and should not be considered relevant, a set of relevance judgments for all query-document pairs, and a suite of evaluation measures that operate on a ranking of known relevant/nonrelevant items. Usually, because collections are large and because most documents are not relevant, it is unnecessary (and often prohibitively expensive in terms of time and effort) for assessors to judge all documents for all queries. Instead, assessors typically judge only those documents most likely to be relevant. These can be determined using a method known as pooling. The basic idea is to take the union of top results from a wide range of systems. Documents within this set are judged, and documents outside of this set are automatically assumed to be not relevant.
With regard to aggregated search, test collection evaluation can deviate from the general Cranfield method in one respect. Depending on the formulation of the task, pooling results from the different systems being aggregated (i.e., from the set of candidate verticals and from the core Web search engine) may not be necessary. Most approaches to vertical selection and presentation assume that the top results from each vertical (those that would be presented if the vertical were selected) are fixed.
Thus far, two test collection evaluation methodologies have been proposed for aggregated search. The first was proposed by Arguello et al. [14]; the second was proposed by Zhou et al. [410]. The two methods have things in common. First, both impose constraints on the end-to-end aggregation task. For example, vertical results must be blended into the core Web results from top to bottom (i.e., verticals cannot be stacked horizontally), and if a vertical is presented, its results must be displayed in sequence. Second, both methods propose ways of collecting assessor relevance judgements on vertical results and on the core Web results for a given query. Finally, both methods propose evaluation measures that take as input a set of relevant judgments and can determine the quality of any possible aggregation of results (subject to the imposed constraints).
The approach from Arguello et al. [14] casts the aggregation task as block ranking. The first step is to impose a set of layout constraints. Most important, if a vertical is presented, then all its results must be presented together, and they must be presented within a set of predefined slots—for example, above the first Web result, between Web results three and four, or below the last Web result. Given such constraints, aggregated search can be viewed as a block ranking task whereby a block is defined as either a sequence of same-vertical results or a sequence of Web results that cannot be split.
Let ![]() denote the set of blocks associated with query
denote the set of blocks associated with query ![]() .
. ![]() includes one block for every vertical
includes one block for every vertical ![]() that retrieves a minimum number of results and one block for every sequence of Web results that cannot be split. Following the example constraints from earlier, Web Results 1–3 would form one block and Web Results 4–10 would form another block. Additionally,
that retrieves a minimum number of results and one block for every sequence of Web results that cannot be split. Following the example constraints from earlier, Web Results 1–3 would form one block and Web Results 4–10 would form another block. Additionally, ![]() includes an imaginary “end of SERP” block. Thus, the end-to-end goal for the system is to produce a ranking of all elements in
includes an imaginary “end of SERP” block. Thus, the end-to-end goal for the system is to produce a ranking of all elements in ![]() , where the blocks ranked below the imaginary “end of SERP” block are suppressed and effectively tied. Given this formulation of the aggregated search task, the method proposed by Arguello et al. [14] is to derive an ideal or reference block ranking for each evaluation query
, where the blocks ranked below the imaginary “end of SERP” block are suppressed and effectively tied. Given this formulation of the aggregated search task, the method proposed by Arguello et al. [14] is to derive an ideal or reference block ranking for each evaluation query ![]() and to evaluate alternative block rankings for
and to evaluate alternative block rankings for ![]() based on their similarity or distance to the reference.
based on their similarity or distance to the reference.
Given query ![]() , let
, let ![]() denote the ideal block ranking and
denote the ideal block ranking and ![]() denote a predicted block ranking. Two components are still missing. First, how do we derive
denote a predicted block ranking. Two components are still missing. First, how do we derive ![]() , and second, how do we measure the similarity between
, and second, how do we measure the similarity between ![]() and
and ![]() ? In response the first question, Arguello et al. [14] collected preference judgments on all block pairs in
? In response the first question, Arguello et al. [14] collected preference judgments on all block pairs in ![]() and derived the reference presentation
and derived the reference presentation ![]() by applying the Schulze voting method [305] to these preference judgments. In response to the second question, Arguello et al. [14] used a variant of Kendall’s
by applying the Schulze voting method [305] to these preference judgments. In response to the second question, Arguello et al. [14] used a variant of Kendall’s ![]() [206]. Although these were the particular solutions used in this work, other ways to construct
[206]. Although these were the particular solutions used in this work, other ways to construct ![]() and other ways of calculating the similarity between
and other ways of calculating the similarity between ![]() and
and ![]() are also possible.
are also possible.
The evaluation method proposed in Zhou et al. [410] takes a different approach. The main evaluation metric is defined as utility. Let ![]() still denote the output predicted by the system in response to query
still denote the output predicted by the system in response to query ![]() . The output can still be viewed as a ranking of Web and vertical blocks. Zhou et al. define utility as the user’s expected gain obtained from reading
. The output can still be viewed as a ranking of Web and vertical blocks. Zhou et al. define utility as the user’s expected gain obtained from reading ![]() divided by the expected effort expended in reading
divided by the expected effort expended in reading ![]() :
:
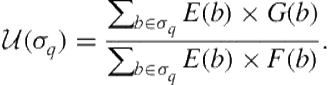 (8.32)
Now let’s consider the different components of this equation. Let ![]() denote a Web or vertical block presented in
denote a Web or vertical block presented in ![]() . The first component,
. The first component, ![]() , is defined as the probability that a user will examine block
, is defined as the probability that a user will examine block ![]() .
. ![]() can be derived in different ways; however, it should be a function of the block’s position in the ranking as well as its visual salience. So, for example, all else being equal, a block of results from the images vertical should have a higher examination probability than a block of results from the news vertical. Image results are more salient than news results and are therefore more likely to be noticed and examined.
can be derived in different ways; however, it should be a function of the block’s position in the ranking as well as its visual salience. So, for example, all else being equal, a block of results from the images vertical should have a higher examination probability than a block of results from the news vertical. Image results are more salient than news results and are therefore more likely to be noticed and examined.
The second component, ![]() , is defined as the user’s gain obtained from examining block
, is defined as the user’s gain obtained from examining block ![]() . One important distinction between this approach and the one proposed by Arguello et al. [14] is that this approach decouples the relevance of a system (i.e., the relevance of a vertical or the relevance of the Web search engine) from the relevance of the results retrieved by that system. Given a query, assessors are first asked to judge the relevance of a particular system, independent of any results. This is referred to as the query’sorientation. Then assessors are asked to judge the items retrieved by each system based on topical relevance. Topical relevance is judged independently of the query’s orientation. Finally, the gain associated with block
. One important distinction between this approach and the one proposed by Arguello et al. [14] is that this approach decouples the relevance of a system (i.e., the relevance of a vertical or the relevance of the Web search engine) from the relevance of the results retrieved by that system. Given a query, assessors are first asked to judge the relevance of a particular system, independent of any results. This is referred to as the query’sorientation. Then assessors are asked to judge the items retrieved by each system based on topical relevance. Topical relevance is judged independently of the query’s orientation. Finally, the gain associated with block ![]() is given by the product of the total topical relevance of items within
is given by the product of the total topical relevance of items within ![]() (the sum of topical relevance grades associated with the items in
(the sum of topical relevance grades associated with the items in ![]() ) and the query’s orientation with respect to the system that produced
) and the query’s orientation with respect to the system that produced ![]() .
.
The third and final component, ![]() , is defined as the amount of effort required to assess the relevance of
, is defined as the amount of effort required to assess the relevance of ![]() . The idea here is that different types of results require different amounts of effort. For example, images require little effort because the surrogate is a faithful representation of the underlying result. On the other hand, news results require more effort because the user must read the summary snippet and possibly even navigate to the article. Finally, video results take a significant amount of effort because the user may need to view the entire video to assess its relevance. Thus, blocks from different systems can be assigned different weights based on different heuristics or assumptions.
. The idea here is that different types of results require different amounts of effort. For example, images require little effort because the surrogate is a faithful representation of the underlying result. On the other hand, news results require more effort because the user must read the summary snippet and possibly even navigate to the article. Finally, video results take a significant amount of effort because the user may need to view the entire video to assess its relevance. Thus, blocks from different systems can be assigned different weights based on different heuristics or assumptions.
The approach from Zhou et al. [410] is fairly general. One can imagine different browsing models for estimating the examination probability associated with a block (![]() ), different ways of measuring gain (
), different ways of measuring gain (![]() ), and different assumptions for modeling assessment effort (
), and different assumptions for modeling assessment effort (![]() ).
).
8.3.2.2 Online Evaluation
Online evaluation involves testing a system in an operational setting based on implicit user feedback. The basic idea is to have different subsets of users exposed to different systems and to compare between systems based on observable signals that are thought to be correlated with user satisfaction. To date, most online evaluations have focused on clicks and skips.
Online evaluation has two main advantages. First, the evaluation is conducted using real users in real situations. This facilitates the evaluation of methods that provide personalized results to different individuals and methods that harness evidence from the user’s context—for example, their location. Second, the evaluation can be conducted using lots of people, ensuring that results generalize across users and situations.
That said, online evaluation also has some challenges. First and most important, implicit user feedback is noisy. Users tend to click on results that ranked higher and results that are visually salient—for example, results that show images. Moreover, when users do click, they do so based on perceived relevance. The underlying Web or vertical result may actually turn out to be not relevant. Skips are noisy as well. Users may satisfy their information need from the summary snippet, and in fact some verticals (e.g., weather) may not even be clickable. The second challenge is that online experiments are not repeatable. The users, the collections, and the queries will be different. That is not to say that online evaluation results cannot be trusted. The same comparison between approaches can be conducted multiple times to verify that the best system is still the best system. However, the exact outcome measures will be different. The dynamic nature of online evaluations makes it difficult to do debugging and error analysis, which often require changing one thing at a time.
One approach to online evaluation is to measure the clickthrough rate for each candidate vertical independently. Clickthrough rate answers the following question: Of the times the vertical was presented, how often was it clicked? The metric assumes that if a user did not click on a vertical that was presented, the vertical should not have been presented or should have been presented in a different location. Although clickthrough rate is an intuitive measure, it paints an incomplete picture. It measures precision but not recall. Suppose a system predicts a vertical relevant only when the system is very confident that it is relevant. Such a system would probably observe a very high clickthrough rate. However, what about the false negatives? In other words, how often did the system suppress a vertical that should have been presented?
To address this limitation, an evaluation based on clickthrough rate should also consider another measure, known as coverage. Coverage measures the percentage of queries for which the vertical was presented. Used in conjunction, a greater coverage and a higher clickthrough rate can be seen as an improvement. It means that the system made fewer false-negative and fewer false-positive mistakes. Although coverage is not equal recall, the measures are related. High coverage probably means high recall, but low coverage does not necessarily mean low recall.
Ponnuswami et al. [280] used clickthrough rate and coverage in conjunction to evaluate an end-to-end system in which verticals could be slotted into one of three positions: above the Web results, below the Web results, and in the middle. Clickthrough rate and coverage were measured independently for each vertical-slot pair.
In addition to the challenges mentioned online evaluation can also be time consuming and expensive. If the goal is to fine-tune an existing system, it might not be possible to conduct an online evaluation for every combination of parameter values. To address this limitation, a few recent studies have investigated methods for collecting online user-interaction data once and using these data to perform multiple rounds of offline testing [279,219]. These methods have some of the benefits of test collection evaluation. Namely, once the data are collected, evaluation is inexpensive and results are reproducible. The basic idea is to collect the user interaction data in a completely unbiased fashion, where every system output is equally probable. Then, given a particular model (with a particular parameter configuration), evaluation can be done by considering only the interaction data (e.g., the clicks and skips) associated with those outputs that are identical to what the system would have produced, given the same query. Results show that metrics computed in this offline fashion closely approximate those computed in an online setting using the same experimental system [279,219].
8.3.2.3 User Study Evaluation
User study evaluation involves exposing study participants to different systems and measuring their levels of task success or satisfaction. Compared to test collection evaluation and online evaluation, user study evaluation has a few advantages. First, participants can be asked questions that directly measure their level of satisfaction with the system. The evaluation does not rely on metrics that may be only weakly correlated with user satisfaction. Second, user studies can target specific user populations. For example, one can study differences in search behavior between experienced and inexperienced searchers. Third, because the experiment is conducted in a controlled setting, user studies can manipulate the higher-level task or the search context. Within aggregated search, user studies have been conducted to answer two basic questions: What do users want? and What are the factors that affect users’ preferences or their behaviors?
Both test collection approaches discussed in Section 8.3.2.1 were validated by conducting user studies [14,410]. The goal was to compare the value of the proposed evaluation metric with user preferences between alternative presentations of aggregated results. The basic assumption is that a “good” metric should be consistent with user preferences. Both user studies consisted of showing participants pairs of aggregated results and comparing the metric score with the stated preference. Several common trends were observed. First, agreement between study participants was low. The Fleiss’ Kappa agreement [122], which corrects for the expected agreement due to random chance, was about 20%. Given this low level of agreement between people, it would be unreasonable to expect any metric to agree with a user 100% of the time. Second, the agreement between the metric and the assessors was about 65%. Note that the expected agreement due to random chance is 50%. Finally, agreement between the metric and the assessors was greater (about 80%) on those presentation pairs where the value of the metric was drastically different. In other words, the proposed metrics were better at distinguishing between good and bad presentations than between pairs of good and pairs of bad presentations. Taken together, these three trends tell us that although perfect agreement between any metric and users’ preferences is unlikely, there is room for improvement.
Preference behavior was also studied by Zhu and Carterette [413]. Again, participants were shown pairs of presentations for a given query and asked to state a preference. Different from the preference-based studies described earlier, however, this work only looked at the blending of the image vertical in different slots. The study found a strong preference for the image vertical ranked high for queries likely to have image intent.
Studies have also considered preference behavior over the course of an entire search session, not only on a query-by-query basis. Sushmita et al. [333] conducted a task-oriented user study with two types of interfaces: a tabbed interface, whereby users could only access different verticals using tabs, and an aggregated interface, where the top results from every vertical were blended into the core Web results. Participants were given a search task and asked to compile as much relevant content as possible. Two important trends were observed. First, the aggregated interface was associated with more clicks. Second, the amount of cross-vertical content compiled by participants was greater for the aggregated interface. Taken together, these two trends suggest that user engagement with vertical content is greater when the verticals are showcased in the main results.
The aggregated interface used in Sushmita et al. [333] was static—verticals were blended in fixed positions. In a later study, Sushmita et al. [334] investigated search behavior with a dynamic aggregated search interface. This study found two main results. First, users click more on verticals that are relevant to the task and verticals that are shown higher in ranking. In other words, aggregated search is not immune to positional bias. Users click more on verticals ranked higher, either because they scan results from top to bottom or because they trust that the top results are more relevant. Second, users click more on verticals that are more visually salient (in the case of this study, the video vertical). Thus, positional bias is not the only bias that affects clicks on vertical results.
Thus far, we have focused on user studies that investigate the question, What do users want? Users want a system that combines results from different sources in the main results and a system that makes the relevant verticals more salient. Next we focus on user studies that investigate factors that might affect user preference and search behavior.
As previously mentioned, an important advantage of user study evaluation is the ability to manipulate properties of the user’s higher-level goal. Prior work shows that task complexity influences search behavior [173].2 Among the differences in search behavior is the demand for diverse content. That is, during more complex tasks, users exhibit a greater demand for content that is more diverse (content from different sources or different types of media). Motivated by this finding, Arguello et al. [17] investigated the effect of task complexity on users’ demand for vertical content, operationalized using clicks on vertical results. The study looked at the interaction between two experimental variables: task complexity and vertical aggregation. Participants were given search tasks of varying degrees of complexity and used two different interfaces: a tabbed interface, in which vertical content was only indirectly accessible, and an aggregated interface, in which vertical results were also blended into the Web results. Results showed a greater number of vertical clicks for more complex tasks but only for the aggregated interface. However, the effect was only marginally significant. This result suggests that properties of the higher-level task may influence a user’s demand for vertical results. Thus, session-level evidence, which can provide better hints about the higher-level task, may need to be considered in order to improve aggregated search.
During vertical selection, a false-negative mistake means that a nonrelevant vertical was presented alongside the core Web results. All evaluation methods for vertical selection and end-to-end aggregated search assume that all false-negative mistakes are equallybad. In other words, all instances where the system presents a nonrelevant vertical equally hurt the user’s search experience. However, consider a user that issues the ambiguous query “jaguar” because she is looking for a list of a places in the world where jaguars can found in the wild. In this particular scenario, displaying the images vertical can be viewed as a false-negative mistake. The information need is more likely to be satisfied with Web results instead of image results. However, is the user experience equally affected if the images are all pictures of “jaguar” the automobile vs. pictures of “jaguar” the animal? Arguello and Capra [12] studied the effect of the query senses represented in the blended image results on user interaction with the Web results. They found that given an ambiguous query (e.g., “jaguar”), user interaction with the Web results, operationalized using Web clicks, is greater when the query senses represented in the image results (e.g., “jaguar” the animal or “jaguar” the car) are consistent with the intended query sense (e.g., “jaguar” the animal). This result suggests that in certain situations, a “spillover” effect can occur. In other words, depending on the vertical results, certain false-negative vertical predictions may have a stronger negative effect on the user’s perception of otherresults presented on the SERP.
Such interaction effects between different components of a SERP, which include vertical results but also extend to components such as query suggestions and advertisements, motivate work on whole-page evaluation. The idea behind whole-page evaluation is that the relevance of a component may depend on other components presented on the SERP. For example, a relevant Web result presented at rank five may be less relevant if it contains information that is redundant with a Web result presented at rank one. Likewise, the quality of the SERP as a whole may be inferior if different components in the SERP (e.g, the Web results, the vertical results, and/or the query suggestions) focus on different query senses. Bailey et al. [23] proposed a whole-page evaluation methodology referred to as the Student Assignment Satisfaction Index (SASI). The evaluation methodology focuses on eliciting judgments from assessors on parts of the SERP within the context of the whole SERP. Bailey et al. [23] show that the SASI-style judgments on the whole page can be done surprisingly fast. A whole SERP can be evaluated in the time it takes an assessor to make two document-level relevance judgments in a test collection evaluation method. However, the main disadvantage of this evaluation method is that the judgments are purely retrospective. In other words, the judgments are based on the system’s output and are therefore not reusable for future evaluations.
8.4 Special Topics
8.4.1 Dealing with New Verticals
Just as pages are constantly being added to and removed from the Web, verticals themselves appear as new subcollections are curated. Unfortunately, creating a new vertical requires training a new vertical selection model and requires new training data. As mentioned earlier, training data can be expensive to gather, so it would be attractive for a system to be able to exploit training data from existing verticals when training a new vertical selection model.
Let ![]() denote the true relevance label of vertical
denote the true relevance label of vertical ![]() with respect to query
with respect to query ![]() .3 In the general vertical selection setting, the goal is to learn a function
.3 In the general vertical selection setting, the goal is to learn a function ![]() that approximates
that approximates ![]() . In this section, we focus on the following scenario. Assume we have a set,
. In this section, we focus on the following scenario. Assume we have a set, ![]() , of source verticals, each with labeled queries. Then suppose we are given a new (target) vertical
, of source verticals, each with labeled queries. Then suppose we are given a new (target) vertical ![]() with no labeled data. The objective is to learn a function
with no labeled data. The objective is to learn a function ![]() that approximates
that approximates ![]() using only source-vertical training data. The quality of an approximation will be measured by some metric that compares the predicted and true query labels. We use notation
using only source-vertical training data. The quality of an approximation will be measured by some metric that compares the predicted and true query labels. We use notation
![]()
to refer to the evaluation of function ![]() on query set
on query set ![]() . This metric could be any of those discussed in Section 8.3.
. This metric could be any of those discussed in Section 8.3.
A portable vertical selection model is defined as one that can make vertical relevance predictions with respect to any arbitrary vertical. In other words, a portable model is not specific to a particular vertical but rather is agnostic of the candidate vertical being questioned for relevance. For this reason, throughout this section, we adopt the shared feature representation ![]() (Eq. 8.24).
(Eq. 8.24).
Let us examine the distinction between a portable and nonportable vertical selection model with an example. Consider a single-evidence model that predicts a vertical relevant based on the number of times the users previously issued the query to the vertical. This type of evidence is likely to be positively correlated with the relevance of the vertical in question. In fact, it is likely to be positively correlated with vertical relevance irrespective of the particular candidate vertical. On the other hand, consider a model that predicts a vertical relevant if the query is classified as related to the travel domain. This model may be effective at predicting the relevance of a vertical that serves travel-related content. However, it is probably not effective on a vertical that focuses on a different domain. This model is less portable.
Most existing single-evidence resource selection models can be considered portable [316,315,314,308,345]. For example, ReDDE [315] prioritizes resources for selection based on the estimated number of relevant documents in the collection. This expectation is a function of the number of documents sampled from the collection that are predicted relevant and the estimated size of the original collection. The greater the expectation, the greater the relevance, irrespective of the particular resource.
8.4.1.1 Basic Model
The objective of a portable vertical selection model, ![]() , is to maximize the average performance across source verticals. Our assumption is that if
, is to maximize the average performance across source verticals. Our assumption is that if ![]() performs consistently well across
performs consistently well across ![]() , then
, then ![]() will perform well on a new (target) vertical
will perform well on a new (target) vertical ![]() . In general, the portability of a model is defined by a metric that quantifies performance for a vertical
. In general, the portability of a model is defined by a metric that quantifies performance for a vertical ![]() and a function that aggregates performance across verticals in
and a function that aggregates performance across verticals in ![]() .
.
For example, the portability, ![]() , which uses the arithmetic mean of the metric, is defined by
, which uses the arithmetic mean of the metric, is defined by
 (8.33)
where ![]() is the set of training queries for source
is the set of training queries for source ![]() and
and ![]() is the set of those sets; similarly,
is the set of those sets; similarly, ![]() provides labels for vertical
provides labels for vertical ![]() and
and ![]() is the set of these functions. We refer to the model that optimizes
is the set of these functions. We refer to the model that optimizes ![]() as the basic model.
as the basic model.
8.4.1.2 Vertical Balancing
In the basic model’s training set, positive instances correspond to relevant query-vertical pairs from all source verticals. For this reason, we expect the basic model to focus on evidence that is consistently predictive of relevance across source verticals and hence predictive of the target vertical. In other words, vertical-specific evidence that is conflicting with respect to the positive class should be ignored. The challenge, however, is that the positive instances in the basic model’s training pool may be skewed toward the more popular source verticals. This is problematic if these verticals are reliably predicted relevant using vertical-specific evidence, they are not likely to be predictive of the new target vertical. To compensate for this situation, we consider a weighted average of metrics across verticals. Specifically,
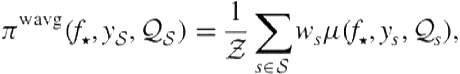 (8.34)
where ![]() . We use the simple heuristic of weighting a vertical with the inverse of its prior,
. We use the simple heuristic of weighting a vertical with the inverse of its prior,

where ![]() is the prior probability of observing a query with relevant vertical
is the prior probability of observing a query with relevant vertical ![]() . This value is approximated with the training data
. This value is approximated with the training data
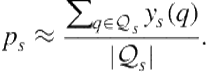
The goal is to make training instances from minority verticals more influential and those from majority verticals less so.
8.4.1.3 Feature Weighting
An alternative to optimizing for a portable model is to find portable features and to train a model using only those. A portable feature is defined as a feature that is highly correlated with relevance across all verticals. Recall that, across verticals, all features are identically indexed. Let ![]() be a predictor based only on the value of feature
be a predictor based only on the value of feature ![]() . In previous work, the effectiveness of features across verticals was shown to be very dependent on the vertical being considered. To address the expected instability of feature predictiveness across verticals, we adopt a harmonic average for our aggregation method:
. In previous work, the effectiveness of features across verticals was shown to be very dependent on the vertical being considered. To address the expected instability of feature predictiveness across verticals, we adopt a harmonic average for our aggregation method:
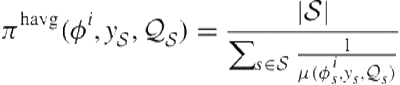 (8.35)
Additionally, features on their own are not scaled to the label range, making the use of logistic loss difficult. Instead of constructing a mapping from a feature value to the appropriate range, we adopt a rank-based metric. In other words, for each feature, we rank queries by feature value and compute the harmonic mean average precision across verticals. Having computed the portability of each feature, we build a portable model by restricting our training to the most portable features.
8.4.1.4 Adaptability
Earlier we focused on ways of improving the portability of a model by influencing the model to ignore evidence that is vertical-specific. The argument is that a model that focuses heavily on vertical-specific evidence will not generalize well to a new target vertical.
Given access to target-vertical training data, previous work reveals two meaningful trends [15]. First, given a wide range of input features, most features contribute significantly to performance. In Arguello et al. [15], no small subset of features was solely responsible for effective vertical prediction. Second, the features that contributed the most to performance, which characterize the domain of the query, seem to be vertical-specific (assuming that verticals focus on different domains). Based on these observations, although ignoring vertical-specific evidence seems necessary to improve a model’s portability, a model customized to a particular vertical is likely to benefit from it.
In the context of adaptation for Web search, Chen et al. [61] propose several ways to adapt an already-tuned model, given data in a new domain. Their approach, tree-based domain adaptation (TRADA), essentially consists of continuing the training process on labeled data from the target domain. Arguello et al. applied this technique to adapt predictions from a portable vertical selection model to a new vertical [16].
8.4.2 Explore/Exploit
The gathering training data in a production environment is limited by production constraints. We cannot show every vertical for every query and expect to gather training data, much less retain users. At the same time, if a production system only gathers data from existing presentation decisions, judgments on suppressed verticals will not be gathered. This is precisely the problem of balancing exploration (i.e., gathering training data with good coverage) and exploitation (i.e., providing users with a satisfying experience). That said, we may be able to gather a small amount of feedback without devastating system performance. Specifically, we would like to present a vertical display for a query, even though it is not predicted to be the display with the highest probability. As a result, our production system combines exploration (i.e., the random gathering of training data) with exploitation (i.e., the application of the trained model). Section 8.2 covers methods for exploitation. In this section, we discuss two methods for exploration.
Naïve exploration suggests randomly altering vertical-selection decisions as queries are submitted to the aggregated search system. Specifically, we can define a system sampling rate, ![]() , which determines whether the system decision will be perturbed. This approach is referred to as the
, which determines whether the system decision will be perturbed. This approach is referred to as the ![]() -greedy approach [335].
-greedy approach [335].
The ![]() -greedy approach, though providing a control on the amount of sampling, does not incorporate any information from a query’s feedback history. We may want to explore only when we have presented few displays. That is, we might make
-greedy approach, though providing a control on the amount of sampling, does not incorporate any information from a query’s feedback history. We may want to explore only when we have presented few displays. That is, we might make ![]() a function of
a function of ![]() . To achieve this goal, we can exploit the fact that Eq. 8.17 defines a distribution from which we can sample
. To achieve this goal, we can exploit the fact that Eq. 8.17 defines a distribution from which we can sample ![]() . Using a random sample instead of the posterior mean results in a more data-driven policy than
. Using a random sample instead of the posterior mean results in a more data-driven policy than ![]() -greedy exploration. If we have seen few or no samples, the variance of the posterior will be high, resulting in samples unlike the posterior mean. As we accumulate samples, this variance falls, ensuring that samples will converge to the posterior mean. This process is similar to approaches used in reinforcement learning [329].
-greedy exploration. If we have seen few or no samples, the variance of the posterior will be high, resulting in samples unlike the posterior mean. As we accumulate samples, this variance falls, ensuring that samples will converge to the posterior mean. This process is similar to approaches used in reinforcement learning [329].
8.5 Conclusion
Although aggregated search is relatively new as a research topic, its foundation in distributed information retrieval has allowed rapid development of sophisticated models. In this chapter, we have outlined the fundamentals of developing an aggregated search system. These include features based on the distributed information retrieval literature as well as newer methods for training vertical selection and presentation systems.
Aggregated search will continue to develop as the online information landscape develops. New verticals will almost certainly necessitate revisiting feature development. At the same time, training algorithms will increasingly exploit more sophisticated user data to refine presentation decisions. Finally, as interfaces move away from traditional ranked lists, vertical presentation and interleaving frameworks will have to be modified.
1 This decomposition is primarily motivated by economics. Getting results from a vertical search engine often incurs some cost. This cost might be monetary if the aggregator is paying for access to a closed service. In the case of cooperative vertical search engines, this cost may be computational if the vertical search engine cannot support portal traffic. Therefore, vertical selection can be a method for reducing the overhead of an aggregator.
2 Here, task complexity refers to cognitive complexity, which relates to the amount of learning required for the user to complete the task.
3 This true label can be derived by thresholding of the training data, such as  .
.
All materials on the site are licensed Creative Commons Attribution-Sharealike 3.0 Unported CC BY-SA 3.0 & GNU Free Documentation License (GFDL)
If you are the copyright holder of any material contained on our site and intend to remove it, please contact our site administrator for approval.
© 2016-2026 All site design rights belong to S.Y.A.