Business statistics with Excel and Tableau (2015)
1. How to use this book
I began business life as an entrepreneur in business in Hong Kong. I ran trade exhibitions, imported coffee from Kenya, and started and operated two restaurants, one of which (unusually for Hong Kong) served vegetarian food. These businesses were profitable, but I would have saved myself a great deal of stress, and done better if I had used some business intelligence informed by statistics to improve my decision-making.Looking back, I wish I had been able to think through and write analyses on topics such as these among many others:
a. calculation of optimal restaurant staffing levels
b. analysis of sales over time and seasonality in trends
c. receipts per customer by restaurant type and analyzed strength and type of any differences
d. predicted sales data for potential exhibitors with visualiza- tions of various ‘what if’ scenarios
e. gained deeper insights from visualizing my data
f. won over more partners and investors with better visual and written presentations
I’m sure that there are many more people like me, aware that they ought to be doing more with the data they collect as part of normal business operations, but uncertain of how to go about it. There is no shortage of textbooks and manuals, but these don’t seem to get to the hands-on applications quickly enough. This book is for people such as me, in two components: the analysis, finding out the underlying story from the data,and then the presentation of the story.
1
1.1 This book is a little different
Most books on stats introduce statistical techniques on a chapter by chapter basis. Instead, I’ve written this book so that it reflects the way many people learn. The chapters are structured by the type of question you might want to ask. Examples of the type of questions are summarized below, and at the beginning of each chapter. The chapters themselves doesn’t include much math and technical details. Instead these are placed towards the end of the book in a glossary.
Many of the Excel procedures are linked to screen casts prepared by me to illustrate that particular procedure. The data-sets used in the book are available from my Dropbox public folder: just click on the hyperlinkthat appears next to each worked example. With the data-sets open in Excel, you can follow along at your own pace. (And then do the same with your own data). I have used Tableau for some visualizations, and you will find links to my workbooks and screen casts.
1.2 Chapter descriptions
If you’re reading this book, then you are very likely already engaged in business and would like to know how to take that business to new heights. Take a look through the chapter descriptions that follow and then gostraight to that chapter. If you think you might need a bit of a statistics refresher, look through the Glossary in Chapter 16 first. A very good free statistics OpenIntro textbook is available here¹
Chapter 2 introduces Tableau Public² which is a free data visu- alization tool. While Excel does have graphing tools which are easy to use, the results can look a little clunky. Tableau helps
![]()
¹https://www.openintro.org/stat/ ²http://www.tableausoftware.com/public/
us to merge data from different sources and create remarkable visualizations which can then be easily shared. I’ll be illustrating results throughout this book with either Tableau, Excel or both. One caution: if youpublish your results to the web using Tableau Public, your data is also published. If this is a problem, there is an option to pay for an enhanced version of Tableau. The screenshot below shows work done changes on landuse in the Delta region of British Columbia. By clicking on the link, you can open the workbook and alter the settings. You can filter the year (see top right) and also land use type. Thanks to Malcolm Little for his workon this project. Tableau workbook for Delta Land Cover Changes³
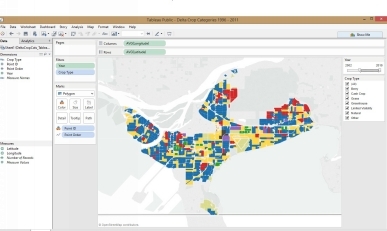
Tableau showing changes in landcover
Tableau has training and demonstration videos available on its website, and there are plenty of examples out there. The screen casts which Tableau provides (available at their homepage) are probably enough. WhereI have found some technique (such as boxplots) particularly tricky I have created screen casts for this book. The image below is data we will use in the regression chapter. You run a
![]()
³https://public.tableau.com/views/DeltaCropCategories1996-2011/Sheet1?:embed=y&: showTabs=y&:display_count=yes
trucking company and from your logbooks extract the distance and duration and number of deliveries for some delivery jobs. The image shows a trend line, with distance on the horizontal axis and time taken on the vertical axis. The points on the scatterplot are sized by number of deliveries. You can see that more deliveries increases the time, as one would expect. Using regression, Chapter 6, we will work out a model which canshow how much extra you should charge for each delivery. Here is a YouTube for trucking scatterplot⁴
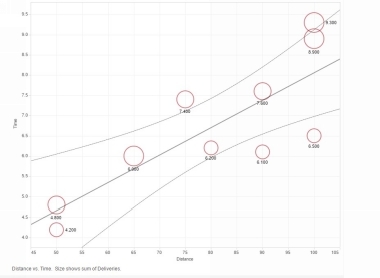
Tableau showing distances, times, and deliveries
Chapter 3. Writing up your findings. In most cases statistical analysis is done in order to help a decision-maker decide what to do. I am assuming that it is your job to think through the problem and assist the decision-maker by assembling and analyzing the data on his/her behalf. This chapter suggests ways in which you might write up your report, accompanied by visualizations to get across your message. There are also links tosome helpful websites which
discuss the preparation of slides and how to make presentations.
Chapter 4: Data and how to get it. If you are considering collecting data yourself, through a survey for example, then you’ll find this chapter useful. So-called big data is a hot topic, and so I include some discussion.The chapter also includes links to publicly avail- able data sets which might be helpful.
Chapter 5 deals with tests for whether two or more quantities are the same or different. For example, you are a franchisee with three coffee-shops. You want to know whether daily sales are the same or different, andperhaps what factors cause any difference that you find. You want to know whether there is a statistically significant common factor or not, to eliminate the possibility that the difference you see occurred purely bychance. Perhaps the average age of the customers makes a difference in the sales? ANOVA uses very similar theory to regression, the subject of the next chapter and perhaps the most important in the book.
Chapter 6: Regression is almost certainly the most important statis- tical tool covered in this book. In one form or another, regression is behind a great deal of applied statistics. The example presented in this bookimagines you running a trucking business and wanting to be able to provide quotations for jobs more quickly. It turns out that if you have some past log-book data to use, such as the distance of various trips, the time that they took and how many deliveries were involved, an accurate model can be made. Regression can find the average time taken for every extra unit of distance, as well as other variables such as the number of stops. This chapter shows how to create such a model and how to use it for prediction. With such a model, you can make quotations really quickly. This chapter also covers more complex regression and how to go aboutmodel- building.
Other uses: you want to calculate the beta of a stock, comparing the returns of one particular stock with the S&P 500.
Chapter 7 is about testing whether the regression models we built
in Chapters 6 and 7 are in fact any good. Regression appears so easy to do that everybody does it, without checking the validity of the answers. Following the procedures in this chapter will help to ensure that your work is taken seriously. This chapter is more of a guide to thinking critically about the results other people might have. Is there missing variable bias? For example, you notice a strong correlation between sales ofice-creams and deaths by drowning. Can you therefore say that reducing ice-cream sales will make the water safer? Err–no. The missing or lurking variable is temperature. Both drowning deaths and ice cream salesare a function of temperature, not of each other.
Chapter 8 is about time-series and shows how we can detect trends in data over time, and make predictions. The smoothing methods, such as moving averages and exponentially weighted moving aver- ages covered inthis chapter are fine for data which lacks seasonality and when only a relatively short-term forecast is needed. When you have longer-run data and for making predictions, the following chapter has the techniques youneed.
Chapter 9 describes the regression-based approach to time series analysis and forecasting. This approach is powerful when there is some seasonality to your data, for example sales of TV sets show a distinct quarterly pattern (as do umbrellas!).
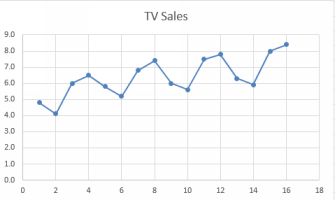
Sales of TV sets showing a quarterly seasonality
Using regression we can detect peaks and troughs, connect them to seasons and calculate their strength. The result is a model which we can use to predict sales into the future.
Chapter 10 is about optimization or making the best use of a limited number of resources. This is highly useful in many business situations. For example, you need to staff a factory with workers of different skillsand pay-levels. There is a minimum amount of skills required for each class of worker, and perhaps also a minimum number of hours for each worker. Using optimization, you can calculate the number of hours toallocate to each worker.
Chapter 11 Optimization can also be used for more complex ‘blend- ing’ problems. Example: You run a paper recycling business. You take in papers and other fibers such as cardboard boxes. How can you mixtogether the various inputs so that your output meets minimum quality requirements, minimizes wastage, and generates the most profit?
Another example: what mix or blend of investments would best suit your requirements?
Chapter 12 concerns calculating the probability of items you can count one by one. For example, what is the probability that more
than five people will come to the service desk in the next half-hour? What is the probability that all of the next three customers will make a purchase? We can solve these problems using the binomial and the Poissondistributions.
Chapter 13 concerns choice under uncertainty: if you have a choice of different actions, each of which has an uncertain outcome, which action should you choose to maximize the expected monetary value? A farmerknows the payoffs he/she will make from different crops provided the weather is in one state or another (sunny/wet) but at the time when the crop decision has to be made, he obviously doesn’t know what the actual state will be. Which crop should he plant? A manufacturer needs to decide whether to invest in constructing a new factory at a time of economic uncertainty: what should he do?
Chapter 14 adds the decision-maker’s risk profile to his or her decision process. Most people are risk averse, and are willing to trade off some risk in exchange for certainty. This chapter shows how to construct autility curve which maps risk attitudes, and then prioritize the decisions in terms of maximum expected utility.
Chapter 15 is a Glossary and contains some basic statistics informa- tion, primarily definitions of terms that the book uses frequently and which have a particular meaning in statistics (for example ‘population’). TheGlossary also discusses why the inferential tech- niques used in statistics are so powerful, allowing us to make inferences about a population based on what appears to be a very small sample.
Under E for Excel in the Glossary, you’ll find some links to screen casts on subjects not directly covered in this book, but which you might find helpful.