Business statistics with Excel and Tableau (2015)
10. Optimization
Linear Programming (LP) is the tool we use to optimize a particular objective function. For example, a manufacturer of carpets wants to get the most profit out of his raw materials and labor force. The objective function is the relationship between the inputs and his costs and thus his profits. Optimization helps the manufacturer find the most efficient allocation of resources. The objective function doesn’t necessarily have tobe in terms of money; it could very well be to allocate working hours efficiently so that everyone has more time off. Frequently we want to maximize the objective function (perhaps make more profit) but we mightalso want to minimize an objective function, such as costs.
Optimization is not particularly difficult, and we will use the Solver add-in to Excel to do the mathematically tricky parts. What is important is the writing up of a correct model in the first place.
Layout of the chapter
Linear programming is not especially difficult, but the work has to be done in a logical and orderly fashion. In this chapter, we will
*spend some time working through the basic steps in setting up an optimization problem * work through the meaning of the Solver output in terms of what the coefficient values actually mean
10.1 How linear programming works
Linear programming works by solving a set of simultaneous equa- tions. The problem to be solved—to maximize a stock return for
95
example—is written as a set of simultaneous equations. The equa- tions may be quite simple, but there may be many of them. Linear Programming finds the best solution to the equations. The job is to find the coefficients for the variables in the equation which maximize or minimize the outcome.
We’ll work through an example first on paper, and then put it into Excel’s Solver add-in to get the solution. The three important steps are:
• Write the simultaneous equations, basically putting into math the wording of the problem. This is probably the toughest part.
• Run the Optimization in Solver, to find the optimal solution.
• Sensitivity analysis to find out how much effect a unit change in a constraint would have.
10.2 Setting up an optimization problem
Optimization problems are usually presented as written questions. The best approach is to determine which are the
• decision variables those variables which you can control. For example, in the carpet factory example, the number of hours given to each worker is a decision variable.
It is usually the size of the decision variable that we are trying to optimize. For the workers, we would want them to have exactly the number of hours which produces the most profitable output. Too few hours and thefactory is working below capacity. On the other hand, too many and money is being wasted. The decision variables go into what Solver calls the changing cells. The convention is to color-code these cells in Excel inred color.
• constraints are constants or givens which we cannot change. The jurisdiction where the factory is located might have legislation restricting the maximum number of hours that an employee can work per day. We would need to add a constraining equation to take account of this fact, even if the solution was financially sub-optimal.
10.3 Example of model development.
A farmer has 50 acres of land at his/her disposal. He also has up to 150 hours of labor and up to 200 tonnes of fertilizer. He can plant either cotton or corn or a mixture. Cotton produces a profit of $400 per acre, corn $200 per acre. Each acre of cotton requires 5 labor hours and 6 tonnes of fertilizer. For corn the equivalent is 3 and 2. How much land should the farmer allocate to each crop?
Let’s call acres of cotton x and acres of corn y. F for fertilizer and L for labor. These four variables are his decision variables because he can allocate crops to land and he can also decide how much labor and fertilizer todeploy. He is searching for the combination of the four decision variables which maximizes his profit.
We know he has 50 acres, so the total acreage cannot exceed this amount. This is a constraint, which can be written as an equation, as shown below. Other constraints are the maximum labor and fertilizer. Obviously hecannot use more than he has.
10.4 Writing the constraint equations
The total acreage devoted to each crop cannot exceed 50:
x + y ≤ 50
The labor and fertilizer are also constraints. Refer back to the question to get the amounts of labor and fertilizer per acre per crop.
For labor, the constraint equation is:
5x + 3y ≤ 150
This equation comes about because for each acre of cotton, the farmer needs 5 hours of labor, while for corn it is 3. We do not know the values of x and y, but whatever they are, we know that 5x plus 3 y must be lessthan or equal to 150, because we only have 150 hours available.
For fertilizer, the constraint equation is:
6x + 2y ≤ 200
10.5 Writing the objective function
What do we want to get out of this: what is the objective? Clearly it is the most efficient mixture of inputs, subject to constraints, producing the largest profit. The objective function is:
MaxProfit = 400x + 200y
In words, find the combination of x and y that maximizes the profit, subject to the constraints we have written. The next task is to put all this into Solver.
10.6 Optimization in Excel (with the Solver add-in)
We will use an Excel spreadsheet and Solver to achieve all three steps.
Open an Excel spreadsheet so that you can follow along.
Cell coloring conventions
I suggest you follow these conventions for color-coding the cells:
• Input cells. These contain all the numeric data given in the statement of the problem. Color input cells in BLUE.
• Changing cells. The values in these cells change to optimize the objective. Code changing cells in RED.
• Objective cell. One cell contains the value of the objective. Color the objective cell in GREY.
Now I’ll work through the farming problem above step by step.
Make sure you have the Solver add-in loaded. To check, open Excel, then click on the Data Tab. If Solver is loaded, you will see the Solver name to the right.
The Solver tab
Below is the Excel spreadsheet with the information that we know already typed in. I have put random values in the red-colored changing cells, just as place holders. These numbers will change when Excel solvesfor the most profitable allocation.
• Type the address of the objective into the Solver dialogue box, and make sure the Max radio button is selected.
• Type in the range of the changing cells.
• Work through the constraints. There are three: labor; fertil- izer; and land.
• Select Simplex LP as the Solving method.
• Press solve.
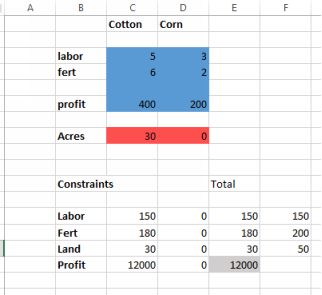
The farming solution
Solver will change the values in the changing cells to maximize the objective cell. I found that 30 acres of cotton and none of corn provided a profit of $12000.
10.7 Sensitivity analysis
Constraints can be either binding or slack. If a constraint is binding, that means that all of that particular resource is being used, and more could be employed if it should become available. We can find out whetherconstraints are binding and also their shadow
price by pressing Sensitivity Analysis after running Solver again. The Sensitivity analysis will appear as a tab at the bottom of your worksheet. For the farming problem, it looks like this:
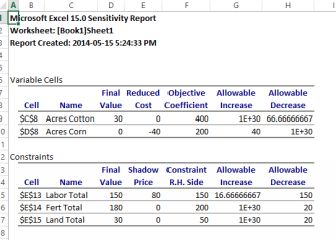
Farming sensitivity report
Let’s let at the Constraints section. Labor uses 150 hours and has a shadow price of $80. The shadow prices indicates the per-unit value of the constrained commodity if the constraint was increased by one unit. If wecould have one more hour of labor, then the profit would increase by $80. Land and fertilizer have a shadow prices of zero because the constraint is slack or non-binding. We are not completely using these resourcesand so we do not need any extra inputs. There are sacks of fertilizer lying around unused. No need to buy more.
The columns Allowable Increase and Allowable Decrease are rele- vant because they tell us how much more of a binding constraint we could use before running the model again. For labor, the amount is 16.67(rounded). If we eased the constraint by more than this amount then we would need to run the new model in Solver again. The same logic for decrease.
10.8 Infeasibility and Unboundedness
Solver is quite robust, but two problems may occur. A solution to an optimization problem is feasible if it satisfies all the constraints. But it is possible for no feasible solution to exist. This occurs if you make a mistake inwriting the model, or the model is too tightly constrained.
Unboundedness
Unboundedness occurs when you have missed out a constraint. There is no maximum (or minimum). Try changing all constraints to >= instead of =< .
10.9 Worked examples
The demanding mother
Most mothers are keen to keep contact with their children. One particular mother is rather demanding. She requires at least 500 minutes per week of contact with you. This can be through tele- phone, visiting or letter-writing (yes! Some people still do that!). Her weekly minimum for phone is 200 minutes, visiting 40 minutes and letters 200 minutes. You assign a cost to these activities. For phone: $5 per minute; visiting $10 per minute; letter-writing $20 per minute. How do you allocate your time so that your cost is the minimum?
Write the equations first. What is the objective?
Let x stand for minutes of phone; y minutes of visiting; and z minutes of letters. You want to minimize the cost of these activities, so the objective is to minimise 200x + 40y + 200z. The constraints are: x + y + z mustbe more than or equal to 500.
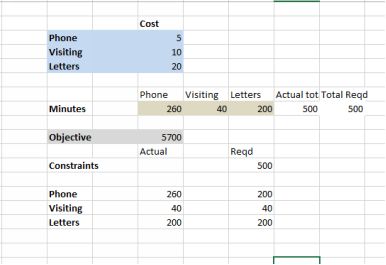
Spreadsheet for demanding mother
Notice that we want to minimize the time, so change the radio button to min rather than max. And when you are typing in the constraints, check that the sign of the inequality is the right way round.
The theater manager
You are the manager of a theater which is in financial trouble. You have to optimize the combination of plays that you will put on to make the most profit. You have five plays in your repertoire, A,B,C,D,E. They have different draw points (appeal to the public) and therefore ticket prices to match. A draw point is how attractive the play is to the general public. The data looks like this:
|
Play |
Draw |
Ticket |
|
A |
2 |
20 |
|
B |
3 |
20 |
|
C |
1 |
20 |
|
D |
5 |
35 |
|
Play |
Draw |
Ticket |
|
E |
7 |
40 |
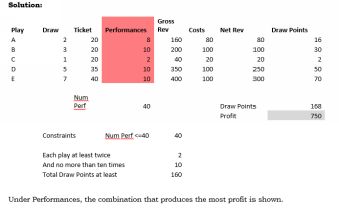
You have these constraints: you have only 40 possible slots. And no play can be put on less than twice or more than ten times (gives the actors a reasonable turn). Each performance costs $10 per ticket sold, regardlessof the ticket price (covers the electricity etc). The total draw points has to exceed 160 to keep the critics happy.
How do you distribute your performances? Which combination of plays produces the highest profit and satisfies the constraints?
We are trying to maximize profit, so look for an objective function that does just that: 20A + 20B + 20C + 35D + 40E. But wait—-we have the $10 cost. So better take that out first, leaving 10A + 10B + 10C + 25D +30E.
With these constraints:
The draw points (the attractiveness of the play to critics): 2A + 3B + 1C + 5D + 7 E >= 160
and no play can be put on more than twice or more than ten times. A <=2 and A <= 10 B <= 2 and B <=10 C <= 2 and C <= 10 D <= 2
and D <=10
and we have only 40 slots, so A + B + C + D + E <= 40
Spreadsheet for theatre problem
More worked examples
19th century farmer
I am a 19th century English farmer. I can grow wheat or barley. Wheat yields 10 bushels an acre, barley 8 bushels an acre. The price of wheat is ten shillings a bushel, barley 5 shillings a bushel. The labour costs forwheat are 3 shillings an acre, for barley 2 shillings an acre. The transportation cost to market for wheat is 1 shilling a bushel, for barley ½ shilling a bushel. I have 100 acres. (a bushel is a measure of volume; an acre isa measure of area; a shilling is a currency unit).
Questions: How do I split up my land?
If I could get one more acre of land, how much would that be worth to me?
Yet another farming question (I use these because most people can imagine fields of land, crops growing and the like. But of course the same techniques are applicable to other business situations).
A farmer has 100 acres of land. He can plant crops or raise sheep. Each hectare of crops provides $100 but requires labor of $50 per acre. He can spend a maximum of $500 on crop labor. Each acre of sheep provides$40 but needs only $10 in labor charges. The labor budget is unlimited.
Worked solution
Call area in crops X and in sheep Y. Then X + Y =< 100 and 50X <= 500 The objective is 100X - 50X + 40Y - 10Y simplifies to 50X + 30Y. My Excel spreadsheet is below.
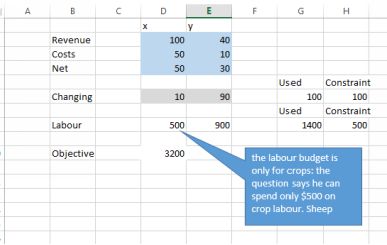
Spreadsheet for the above problem