Business statistics with Excel and Tableau (2015)
11. More complex optimization
Optimization using Solver is a powerful method of solving common business resource-allocation problems. In the previous chapter the problems were relatively simple concerning the allocation of land or time. Butlinear programming can be used to solve more complex and worthwhile problems as we’ll see below. The key requirement is that the analyst is able to define the problem as a set of equations. There is no one method except for thinking carefully and writing out the problem as a set of equations.
To demonstrate, we’ll work through three different types of prob- lem:
*problems concerning proportionality: you need to allocate money to different investments while minimizing risk and keeping returns above a certain amount. What proportion do you put in each investment?
*supply chain problems
*blending problems where you need to mix together inputs from different sources
11.1 Proportionality
Investment decisions example
This example shows how we can ‘weight’ the inputs according to some criteria, in this case their risk. We want to minimize the risk but ensure that the return is above some minimum level. What is the mixture orblend of investments that can do that?
107
The problem: you have an inheritance of $300,000 from an uncle but there are some restrictions: you must invest all the money in four funds; your annual return has to be at least 5%. And you must minimize yourrisk. The four funds your uncle has specified are:
|
Fund |
Risk |
Return |
|
X1 |
10.7 |
4.2 |
|
X2 |
5 |
4 |
|
X3 |
6 |
5.6 |
|
X4 |
6.2 |
4 |
Let’s deal with the objective function first. That is to minimize the risk. We can weight the size of the investment in each fund with its risk index. So, weighting each investment and then dividing by the totalinvestment gives the amount of the risk: which is exactly what we want to minimize. So we want to minimize R (for Risk) like this:
R = 10.7X1 + 5X2 + 6X3 + 6.2X4
300, 000
If you don’t get this, think about what would happen if all the funds were as risky as X1: the total risk would increase. Another way to think of this: if we decrease the number of shares in X1 and instead increase thenumber of X4, what will happen? The risk will decrease.
The constraints: the total investment has to add up to $300,000, so this constraint is
X1 + X2 + X3 + X4 = 300, 000
We also have to achieve a return of at least 5% (no easy matter these days). This constraint is
4.2X1 + 4X2 + 5.6X3 + 4X4≥ 5
Below is my spreadsheet from this problem:
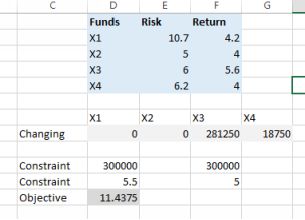
Investment blending
11.2 Supply chain problems
Working out how much to ship from production centers to demand locations is a common problem in supply chain optimization. As I have been stressing, the key to solving problems of this type is to write out theequations which define the model. Here is an example:
You run a company which has bakeries in location A and B. The bakeries ship cartons of bread to your retail stores at locations X, Y, Z. The bakeries have different capacities and each retail store has differentdemands. The costs of delivery per carton from each bakery to each store is below
|
Bakery |
X |
Y |
Z |
Capacity |
|
A |
12 |
13 |
11 |
150 |
|
B |
9 |
17 |
17 |
200 |
|
Demand |
50 |
100 |
90 |
Notation: a delivery from bakery A to location X is Ax and so forth.
The objective function is to minimize the delivery costs. So we want to minimize: 12Ax + 13Ay + 11Az + 9Bx + 17By + 17Bz
Each bakery has a fixed capacity, so Ax + Ay + Az <=150 and Bx + By + Bz <= 200
Supply has to exactly match demand
Ax + Bx = 50 Ay + By = 100 Az + Bz = 90
Notice the strict equality sign. My results are below:
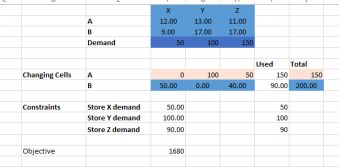
Distribution problem
11.3 Blending problems
Above we discussed linear programming models which were simple but effective. There are other types of Optimization model which are helpful, especially Blending Models, which can also be solved by linearprogramming.
Blending models are used in situations where we have two or more inputs which have to be mixed to some formula. Through Optimization we can find the most profitable mixture. Wine, metals, oil, sausages, recycled paper—-this is a powerful technique. You could probably use it for marketing campaigns. We’ll work though an example which is for oil.
The oil blending problem
The problem: an oil company has 15000 barrels of Crude oil 1 and 20000 barrels of Crude oil 2 on hand. The company sells gasoline and heating oil. These products are made by blending together Crude oil 1 andCrude oil 2. Each barrel of Crude oil 1 has a quality level of 10, and each barrel of Crude oil 2 has a quality level of 5. The gasoline that we produce must have a quality level of at least 8. The heating oil must have a quality level of at least 6. Gasoline sells for $75 a barrel, heating oil for $60. How can we blend the oils together in such a way that meets minimum quality requirements and maximizes profit?
Oil blending solution
First, let’s think through what the decision variables (what goes into the changing cells) might be. You might very well think (as I did first off) that the decision variables would be the amounts of the two oils usedand the amounts produced. But this isn’t enough: we have to blend together the two types of oil. They have to be mixed before they can be sold, and the mixture has to reach some minimum quality standard. Thecompany needs a blending plan.
The inputs:
selling prices (here gasoline = $75, heating oil = $60) availability of oil from suppliers quality level of crude oils: Crude 1 is 10 and Crude 2 is 5
The constraints
Gasoline quality >=8 Heating oil quality >= 6 Quantity of Crude 1
= 15000 Quantity of Crude 2 = 20000
The blending plan:
Gasoline has to have a minimum quality of at least 8, and heating oil must have a minimum quality of at least 6. The Crude oil 1 we
have on hand has a quality level of 10 while Crude oil 2 has a quality level of 5. We want to blend these two crude oils to both achieve the minimum quality standards and make the greatest profit.
Let’s attack the problem by creating total ‘quality points’ (QPs) which represent the quality of oil in a barrel multiplied by the number of barrels of that oil.
Write equations to calculate the quality points:
Total QPs in the gasoline = 10 * amount of Oil 1 + 5 * amount of Oil 2
If for example, we mixed together 50 barrels of Crude oil 1 and 40 barrels of Crude oil 2, the total QPs would be 50 x 10 + 40 x 5 = 700. The average per barrel would be 700/90 = 7.78. This is too low for gasoline (needs8) but acceptable for heating oil. Two points:
we could sell the oil as heating oil, but it is exceeding the minimum quality requirement. We could make more profit by reducing the quality to the minimum, or charge a premium. But this is prescrip- tive work, andwe have to work within the inputs given to us).
The only way to get the oil up to gasoline standards is to increase the amount of Crude oil 1 in the mixture.
If you don’t get this, try a thought experiment: for gasoline, if there was no oil at all from Oil 2, what would be the QP? It would be 10 * the quantity of oil from Oil 1. Again, how about if we blended together 1000barrels from each type of oil: how many QPs would be produced? It would be 10 * 1000 + 5 * 1000 = 15000. Read this through again…it is important.
The blending plan provides us with the constraints we need to ensure that the minimum quality levels are achieved. In the example just above, we blended 2000 barrels to provide a QP of 15000. This is an average of 7.5.Good enough for heating oil, not good enough for gasoline.
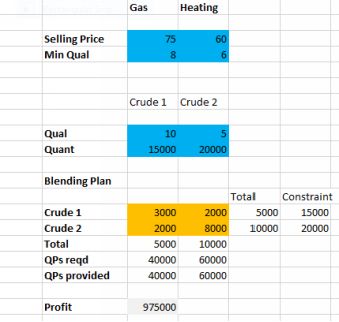
Oil problem solution
Discussion of the solution: note that gasoline sells for more money than heating oil, but the optimal solution suggests that we should sell more heating oil than gasoline. This is because of the constraints on quality.