HTML5, JavaScript and jQuery (Programmer to Programmer) - 2015
Part II Dynamic HTML5 Web Applications with JavaScript and jQuery
Lesson 12 Debugging
Now that you have some working code, it is worth taking a step back to look at the development tools provided by Chrome to help analyze JavaScript-based web applications.
Probably the most important tool for development purposes is a debugger. Debuggers allow you to examine an application while it is running and therefore diagnose the cause of any problems or bugs.
All major browser vendors have introduced development tools such as debuggers into their browsers. For instance, Firefox supports similar tools to the ones you will look at here with the Firebug plugin.
This lesson is very much a practical lesson. It will consist of two Try It sections, and you are encouraged to follow along with the examples.
Both Try It sections will use the same web page to demonstrate the various features in the debugger. This is available from the book's website in the Lesson 12 folder under the name tryit.html, but you can also choose to write it yourself:
<!DOCTYPE html>
<html lang="en">
<head>
<meta charset="utf-8">
<script>
function calculateAbsoluteSumOfArray(a) {
var result = 0;
for (var i = 0; i < a.length; i++) {
var num = a[i];
result = result + Math.absolute(num);
}
return result;
}
function calculateSumOfArray(a) {
var result = 0;
for (var i = 0; i < a.length; i++) {
var num = a[i];
result = result + num;
}
return result;
}
function findHighestSum(arrays) {
var result = Number.NEGATIVE_INFINITY;
for (var i = 0; i < arrays.length; i++) {
var a = arrays[i];
var sum = calculateSumOfArray(a);
if (sum > result) {
result = sum;
}
}
console.log('The largest sum is '+ result);
}
var arrays = [[1,2,3,4,5],[6,4,2],[1.9]];
</script>
</head>
<body>
This page is for trying out the debugger
<p>
<button onclick="findHighestSum(arrays)">Click me to sum arrays</button>
<p>
<button onclick="calculateAbsoluteSumOfArray(arrays[0])">Click me cause an error</button>
</body>
</html>
Try It
In the first Try It, you will debug two functions that are responsible for processing a two-dimensional array that has been defined as follows:
var arrays = [[1,2,3,4,5],[6,4,2],[1.9]];
Note
A two-dimensional array is simply a conventional array where each element is itself an array.
The first function, called findHighestSum, will iterate through all the inner arrays in the array provided, and pass each array in turn to another function called calculateSumOfArray that will sum the numbers in the array. The job of findHighestSum is to determine which of the inner arrays sums to the highest value.
Lesson Requirements
In order to complete this lesson, you will need the Chrome web browser and the tryit.html web page mentioned previously.
Step-by-Step
1. In order to start the debugger, first open the tryit.html page in Chrome. Then use one of the following approaches to open the development tools:
· Command+Option+i on OSX
· F12 or Ctrl+Shift+I on Windows
2. Once the development tools are open, click the Sources tab. Once in this tab, you will notice that the tryit.html page appears in the left-hand panel: Double-click on this to open it in the middle panel (see Figure 12.1).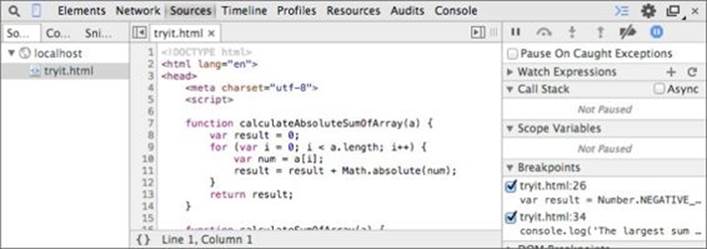
Figure 12.1
3. The first step in debugging code is defining a breakpoint. A breakpoint is the point in the processing when you want the program to pause so you can examine it line by line. Find the first line of the findHighestSum function and click once in the margin where its line number is shown—for me this was line 26. A blue marker should appear in the margin, as shown in Figure 12.2.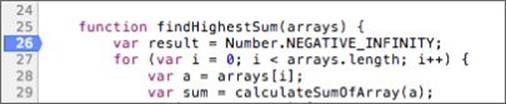
Figure 12.2
4. Click the button Click Me to Sum Arrays. As soon as you click this, the program should display a message stating “Paused in debugger,” and the various panels of the debugger will populate. In addition, the line that the program is currently paused on will be shaded blue, as shown in Figure 12.3.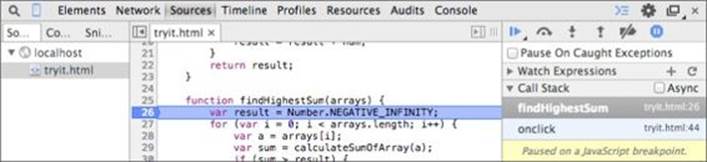
Figure 12.3
5. Now that the program is paused, you can begin interacting with it. One of the most common uses of the debugger is to step through the execution of the program line by line. You can achieve this with a set of buttons in the top right of the debugger, as shown inFigure 12.4.![]()
Figure 12.4
6. If you hover over these buttons, their tooltips will tell you their purpose. You will start by using the second button from the left, which should have the tooltip “Step over next function call.” If you press this button, the execution will jump to the next line in the function. Press this two more times so that the blue line is shading line 29, as shown in Figure 12.3.
7. As the function executes code, a number of local variables have been assigned values. For instance, the arrays variable contains the two-dimensional array, the a variable contains the array you are about to sum up, and the i variable contains the current counter value of the for loop. You can see the values for these variables in the right-hand side of the console, as shown in Figure 12.5. To see the values in any of the arrays, simply click the arrow next to them.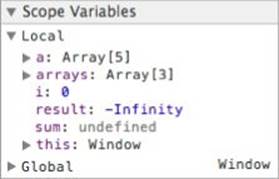
Figure 12.5
8. It is also possible to interact with the program as it executes. For instance, if you swap to the Console tab, you can write code that uses the variables currently in scope, and you can even modify their values (see Figure 12.6).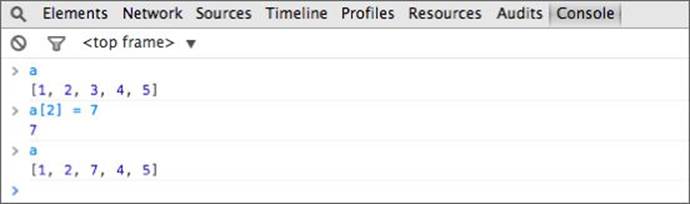
Figure 12.6
This is a great way to try out code before adding it to the web page because you receive immediate feedback from the Console.
There is also a mini-console at the bottom of the Sources tab that can be used for the same purpose, and means you do not need to swap back and forward between tabs.
9. Switch back to the Source tab. You will now step into a function call rather than step over it so click the button with the tooltip Step into next function call. When you do this, execution should jump into the calculateSumOfArray function, and you can now step through this function. Step through this function until it finishes, and watch the local variables update as it executes.
10.When calculateSumOfArray finishes executing, the debugger will immediately return to the findHighestSum function where it left off. Rather than stepping through the rest of the execution, you may decide you want to jump immediately to the line that prints information to the console. In order to do this, add a breakpoint to this line by clicking in the margin, and then press the Resume Script Execution button. When you do this, the debugger should pause on the appropriate line, and the local variables will have been updated to reflect the processing that has occurred.
11.In order to finish the debugging session, simply press Resume Script Execution one more time.
Finding Errors
Debuggers are an excellent way to understand the behavior of a program as it executes, but they are most commonly used to diagnose problems. Programming bugs can be difficult to find in JavaScript code because if a problem occurs the JavaScript simply ceases to execute.
The user of the web page will not even necessarily be aware that an error has occurred; she will simply notice that a piece of functionality does not work as she expects.
This section will therefore walk you through an example of a program with a bug in it, and look at how you can identify and remedy the problem.
Try It
In this Try It, we will press a button that invokes a faulty JavaScript function. This uses the same web page as the previous Try It, so ensure that you have opened this in Chrome.
Lesson Requirements
In order to complete this lesson, you will need the Chrome web browser and the tryit.html example mentioned previously.
Step-by-Step
1. In order to start the debugger, first open the tryit.html page in Chrome. Then use one of the following approaches to open the development tools:
· Command+Option+i on OSX
· F12 or Ctrl+Shift+I on Windows
2. Identify the toolbar shown in Figure 12.7, and press the pause button (on the right-hand side of the toolbar with the tooltip Pause on Exceptions). When you click this, it should turn blue, and an additional checkbox should appear. For this example, it will not matter if you select this checkbox.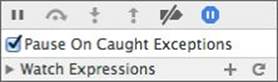
Figure 12.7
3. In order to run the faulty code, click the button with the label Click Me to Cause an Error. As soon as you click this, the debugger should pause on the line that has the error, despite the fact that you did not add a breakpoint to this line. This is shown in Figure 12.8.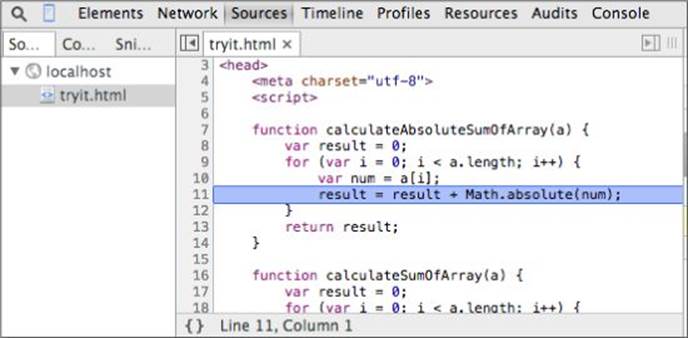
Figure 12.8
4. In order to determine why this line is faulty, copy it from the editor using your keyboard shortcut. Then open the Console tab, paste it in, and press Enter. The cause of the error will be displayed, as shown in Figure 12.9: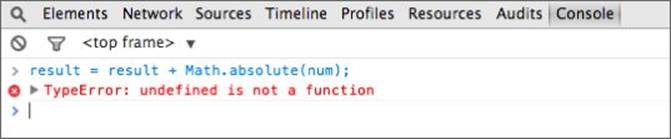
Figure 12.9
5. This shows that you are calling a function that does not exist. The function name has been specified as absolute rather than abs; you can confirm this by executing this alternate version of the code with the function name corrected, as shown in Figure 12.10.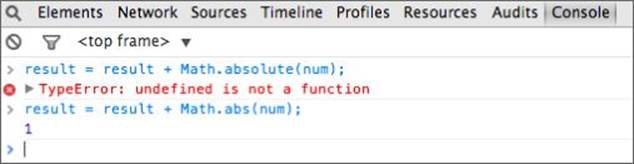
Figure 12.10
6. Once the problem has been identified, you can fix up your source code and try again.
Reference
Please go to the book's website at www.wrox.com/go/html5jsjquery24hr to view the video for Lesson 12, as well as download the code and resources for this lesson.