Beginning HTML5 & CSS3 For Dummies® (2013)
Part II
Getting the Structure and Text Right
6
Tip-Top Tables in HTML
In This Chapter
![]() Understanding table capabilities and benefits
Understanding table capabilities and benefits
![]() Getting to know the pieces and parts of table markup
Getting to know the pieces and parts of table markup
![]() Mapping out a table design
Mapping out a table design
![]() Building simple tables
Building simple tables
![]() Graduating to complex tables
Graduating to complex tables
![]() Making the most of best table practices and techniques
Making the most of best table practices and techniques
In HTML, tables make it easy to lay out data, text, and even images in a grid. Tables help make it easy to present numerical data (which naturally appears in tabular form in spreadsheets and other similar applications). But tables also make it easy and convenient to present all kinds of information that naturally falls into rows and columns, and to help maximize space when introducing lots of terms or other items that would waste too much white space if run up against the left or right margins on a page.
How <table> Got a Bad Name in HTML
Before we dig into the pile of markup you can use to contain and create tables in an HTML document, we must first discuss and dismiss a massive wrong turn that HTML markup took from the mid-1990s up through 2002. This was the period before CSS really made itself a force to be reckoned with in managing web page presentation, with its pinpoint controls over how elements are placed and positioned in a web browser.
Essentially, tables became a go-to design tool for web page layout because they were relatively easy to understand, specify, and use. Designers employed tables to manage what pages looked like and where individual elements would appear. This technique proved especially useful for creating multicolumn page layouts — a technique still beloved by many web page designers even today. But because CSS can handle such things more directly and easily, there’s no reason to use tables for that purpose any more.
However, the “table era” in web page design left a bad taste in the mouths of many web page designers. Since then, too many of them have decided to forgo tables altogether simply because they were put to inappropriate uses at a time when CSS couldn’t pick up the slack.
Today, we think it’s time to redeem tables and to put them back to work where it makes sense to use them. When you have lots of numbers, or numerous fields of text information that fall naturally into rows and columns tables can be useful and informative. What’s more, they provide the most compact and intelligible way to present such information on a web page, so you should use them for that purpose.
What’s in a Table? LOTS of Markup
The primary markup container for tables in HTML is the table element. That is, you use the opening <table> tag to denote the start of a table, and you add the closing </table> tag to end it. Also, the basic building blocks for table data in HTML are the table row (<tr>) and table data (<td>) elements, when a table consists of as many rows as there are <tr> elements (plus any header or footer rows) and as many columns as the maximum number of <td> elements in any given table row.
Between these opening and closing tags, you can find the following elements in this very interesting and prescribed (in other words, mandatory) order:
![]() Zero or one <caption> elements to define a caption for a table (if there's one such element, or no caption for the table if it is absent). If it is used, a <caption> element must follow immediately after the opening <table> tag.
Zero or one <caption> elements to define a caption for a table (if there's one such element, or no caption for the table if it is absent). If it is used, a <caption> element must follow immediately after the opening <table> tag.
![]() Zero or one column group (<colgroup>) elements to define column groupings for the table (if there's one such element, or no column groupings if the element is absent). It must appear after any <caption> element, if one is present, and before any of the following table elements.
Zero or one column group (<colgroup>) elements to define column groupings for the table (if there's one such element, or no column groupings if the element is absent). It must appear after any <caption> element, if one is present, and before any of the following table elements.
![]() Zero or one table heading (<thead>) elements to define the heading section for a table (if there's one such element, or no table heading section if the element is absent). Often, a first table heading row spans the entire width of the table to identify the whole thing, and the first heading row is followed by a second row of individual headings for each column in the table.
Zero or one table heading (<thead>) elements to define the heading section for a table (if there's one such element, or no table heading section if the element is absent). Often, a first table heading row spans the entire width of the table to identify the whole thing, and the first heading row is followed by a second row of individual headings for each column in the table.
![]() Zero or more table body (<tbody>) elements to identify actual content for the table. A table may have multiple <tbody> elements, so it's unusual in HTML in that a table can have only one head but multiple bodies!
Zero or more table body (<tbody>) elements to identify actual content for the table. A table may have multiple <tbody> elements, so it's unusual in HTML in that a table can have only one head but multiple bodies!
![]() Zero or one table footer (<tfoot>) to provide information for the bottom of a table. Browsers can use <thead>, <tbody>, and <tfoot> to decide what to scroll (the table body, usually) and what to leave always present on the screen. The table footer is a special case when it comes to where in the sequence of table markup it can appear. It can always appear last in the sequence (as it does in this list), but it can also appear right after any of these elements that are present (in this order): <caption>, <colgroup>, and <thead>. However, it would appear before <tbody>and <tr> elements. In this special case, <tfoot> cannot also appear at the end of the table. Not allowed!
Zero or one table footer (<tfoot>) to provide information for the bottom of a table. Browsers can use <thead>, <tbody>, and <tfoot> to decide what to scroll (the table body, usually) and what to leave always present on the screen. The table footer is a special case when it comes to where in the sequence of table markup it can appear. It can always appear last in the sequence (as it does in this list), but it can also appear right after any of these elements that are present (in this order): <caption>, <colgroup>, and <thead>. However, it would appear before <tbody>and <tr> elements. In this special case, <tfoot> cannot also appear at the end of the table. Not allowed!
![]() If there is no <tbody> element present (which would ordinarily define the table body in a table with a defined table header and possibly also a footer section), the table row (<tr>) element defines rows for the data that the table actually presents. Inside each table row are as many table data (<td>) elements as there are cells in that row.
If there is no <tbody> element present (which would ordinarily define the table body in a table with a defined table header and possibly also a footer section), the table row (<tr>) element defines rows for the data that the table actually presents. Inside each table row are as many table data (<td>) elements as there are cells in that row.
 Because HTML table syntax and markup order can be tricky and complicated, it's even more worthwhile than usual to run all of your table markup through the W3C validator (http://validator.w3.org) to make sure it's correct.
The structure of an HTML table is easier to understand if we represent it by using basic container markup only, with some hopefully illuminating comments, like so:
<!DOCTYPE html>
<html>
<head>
<meta charset="UTF-8">
<title>Basic Table Markup Structure and Sequence</title>
</head>
<body>
<table border="1">
<caption>Table 6-1: HTML Markup Structure and Sequence</caption>
<thead><tr><th>Element</th><th>Description</th></tr></thead>
<!-- inside all table containers, you still use table rows -->
<!-- this includes thead, tbody, and tfoot as shown here -->
<!-- Use th for bold headings in both header and footer -->
<tbody>
<tr><td>table</td><td>overall table container</td></tr>
<tr><td>caption</td><td>table caption text</td></tr>
<tr><td>tbody</td><td>table body container</td></tr>
<tr><td>tfoot</td><td>table footer container</td></tr>
</tbody>
<tfoot><tr><td>Element</td><td>Description</td></tr></tfoot>
</table>
</body>
</html>
Figure 6-1 shows how a browser displays this table. (We added the border="1" entry to the table element to draw an outline around the edge of each table cell, which makes the table stand out a little better.)
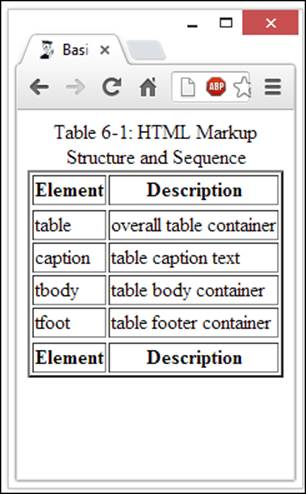
Figure 6-1: This simple table also illustrates typical HTML table structure.
Setting Up a Table Border
As shown in the HTML document rendered earlier in Figure 6-1, you can apply the border attribute to the table element like this:
<table border="1">
This is an interesting beast in that you must define the border as having the value one ("1") for it to validate properly. Even so, our various test browsers showed us a border around the table as long as any value was supplied for the border attribute. To turn off the border, we had to remove the border="value" text entirely from the markup. Earlier versions of HTML used the value to define the width of the border around the table. That's no longer the case for HTML5, where it's strictly a toggle (turns on border if present, no border if absent). You must use CSS to control table border thickness, shading, color, and all the other great properties it allows you to manage.
The Table Head (<thead>) and Its Elements
In the preceding section, we discuss numerous elements associated with the head of an HTML table, itself a table element called <thead>. Those table elements are summarized in . . . wait for it . . . Table 6-1! (Alas, to build this puppy, we had to use Word's far-less-transparent table-handling features rather than the glorious and crystal clear HTML markup we prefer.)
Table 6-1 HTML Table Head Markup
|
Element |
Description/Notes |
|
caption |
Encloses a caption for the table (appears above the table content). |
|
colgroup |
Specifies properties for a group of columns within a table. (Use the col element within a colgroup element to apply properties on a per-column basis.) |
|
col |
Specifies per-column properties within a column group. |
|
thead |
Defines the overall container for table header content. |
|
tr |
Identifies each row of content inside a table header. |
|
th or td |
Use th for bold, centered column heads; use td for plain, left-justified heads. |
A complex table heading might have multiple rows of headings above the columns and do interesting things with column properties. Here’s some slightly more advanced markup to give you an idea of what this can mean. Here we take the markup rendered in Figure 6-1 and snaz up the table headings and column handling. Figure 6-2 shows the results.
<!DOCTYPE html>
<html>
<head>
<meta charset="UTF-8">
<title>Basic Table Markup Structure and Sequence</title>
</head>
<body>
<table border="1">
<caption>Table 6-1: HTML Markup Structure and Sequence</caption>
<colgroup>
<col style="background-color: orange; font-size: 120%;">
<col style="background-color: gray; color: white;"
</colgroup>
<thead>
<tr> <th colspan="2">Table Markup Explained</th></tr>
<tr><th>Element</th><th>Description</th></tr>
</thead>
<!-- inside all table containers, you still use table rows -->
<!-- this includes thead, tbody, and tfoot as shown here -->
<!-- Use th for bold headings in both header and footer -->
<tbody>
<tr><td>table</td><td>overall table container</td></tr>
<tr><td>caption</td><td>table caption text</td></tr>
<tr><td>tbody</td><td>table body container</td></tr>
<tr><td>tfoot</td><td>table footer container</td></tr>
</tbody>
<tfoot><tr><th>Element</th><th>Description</th></tr></tfoot>
</table>
</body>
</html>
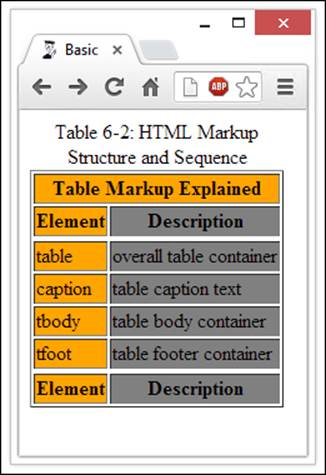
Figure 6-2: The table has two lines of heading information, and the colors for table columns spice it up.
Managing Table Layouts
If you look at things the right way, all the interesting capability and complexity in HTML tables builds from three basic elements:
![]() Borders: Every basic table has exactly four edges that compose a rectangle.
Borders: Every basic table has exactly four edges that compose a rectangle.
![]() Cells: These are the individual areas for data, information, images, or whatever, inside the borders of a table.
Cells: These are the individual areas for data, information, images, or whatever, inside the borders of a table.
![]() Cell span: Within the four-walled structure of a table, you can add or delete cell walls (as shown with the cells on the right side of the table in Figure 6-3). When you delete cell walls, you make a cell span multiple rows or columns — and that’s exactly what makes tables so flexible in accommodating different and interesting cell arrangements.
Cell span: Within the four-walled structure of a table, you can add or delete cell walls (as shown with the cells on the right side of the table in Figure 6-3). When you delete cell walls, you make a cell span multiple rows or columns — and that’s exactly what makes tables so flexible in accommodating different and interesting cell arrangements.
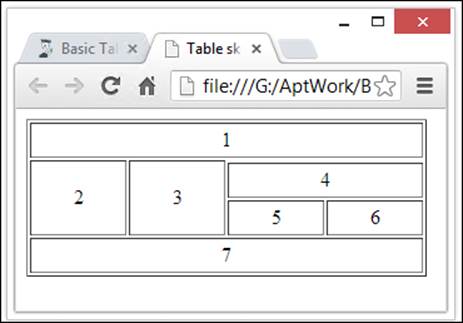
Figure 6-3: It’s not quite a Chinese puzzle box layout, but it is visually interesting.
 Cell spanning and cell width work differently. When you span cells, you change cell space by combining or merging cells. This step removes cell walls, so to speak. When you adjust the dimensions of a cell, usually using CSS width and height controls, you can specify how much space they will occupy. In Figure 6-3, we show how you can create an interesting layout simply by spanning the cells in the top and bottom rows (labeled 1 and 7), with two left cells (cells 2 and 3) that span two rows, and three right cells (cell 4 spanning two columns, and cells 5 and 6 side by side).
Leaving aside details on how to control overall table width and individual cell heights and widths, here’s what the basic HTML for such a table looks like:
<!DOCTYPE html>
<html>
<head>
<meta charset="UTF-8">
<title>Table sketch</title>
</head>
<body>
<table border="1">
<tr><td colspan="4"> 1 </td></tr>
<tr><td rowspan="3" > 2 </td>
<td rowspan="3" > 3 </td></tr>
<tr><td colspan="2"> 4 </td></tr>
<tr><td> 5 </td><td> 6 </td></tr>
<tr><td colspan="4"> 7 </td></tr>
</table>
</body>
</html>
 Tables can become complex. You need to plan them carefully. You can find the HTML file for the preceding figure on the book’s website at:
www.dummieshtml.com/html5cafe/ch06/06fig03.html
Careful examination of this file shows that we included numbers for each of the boxes in that table, numbered 1 through 7, to demonstrate how the table lays out. As you’re developing your own table structures, we encourage you to take a similar approach so you can see and understand exactly what you’re doing. Try labeling the individual boxes with incrementing numbers so you can see how the organization plays itself out on a web page.
You don't need to populate your table with real content or mess around much with the sizing approach that the file contains in its CSS style sections. (Using CSS style is covered in Chapters 11 through 19 of this book.) Count the total number of cells across in your table (four in the example case presented in the preceding section), add one to that number, and then multiply the result by four em-widths to get the table width (20em in the example). Use 4em as the cell width in the table data (<td>) element style information, and you're good to go. If you keep the overall table width in sync with the number of cells across, you can't go wrong!
After you’ve worked out all the kinks with the arrangement of the individual cells, you can start tweaking the style attributes to your heart’s content to make the table as readable and attractive as possible. First, though, you’ll want to get the arrangement right. After that, everything else is window dressing.
Making Good Table Bodies
If you want to get a really good idea about the representational power of HTML tables, you could do a lot worse than to check out the monthly Employment Situation Summary that the United States Bureau of Labor Statistics cranks out near the beginning of each month to report on the previous month’s employment (and unemployment) statistics. You can find archived versions of these reports at:
www.bls.gov/schedule/archives/empsit_nr.htm
For the discussion that follows, we used the report archived for March 2013 as the data source. You can find that report at:
www.bls.gov/news.release/archives/empsit_04052013.htm
It was published on April 5, 2013, in case you’re wondering about the numbers at the end of the HTML filename you see. To open that page, you can type the URL if you like, or visit the Chapter 6 section of our HTML5 Cafe to access a live link. If you call that page up in your web browser and scroll down a bit, you see a whole slew of tables, including Summary Tables A and B, and then a bit farther down inside this mammoth document are Tables A-1 through A-15, and B-1 through B-9. That’s a lot of tables!
By all means, please dig into the source markup for these tables. (You can access them by clicking the tool icon at the far top-right corner in Chrome, then clicking Tools, and then clicking View Source. In Internet Explorer, simply click the View menu and choose Source. Similar methods apply to Firefox, Safari, Opera, and so forth.) The source markup is a great source of information and inspiration for how to make good use of HTML table markup, as well as how CSS helps you control the positioning, formatting, look, and feel of such tables. It takes some time to puzzle through these examples (they’re BIG), but they will repay your efforts with insight and understanding. Try it: It’s a great way to hone your skills.
Shaping a solid table
For this table-construction exercise, you're going to draw some data from the hard-working economists and statisticians at the U.S. Bureau of Labor Statistics. Go to www.bls.gov/news.release/archives/empsit_04052013.htm and scroll down to Table B-9: Indexes of Aggregate Weekly Hours and Payroll, shown in Figure 6-4. The figure no-doubt shows teeny-tiny type, but it should nonetheless give you some idea of what you're looking for online.
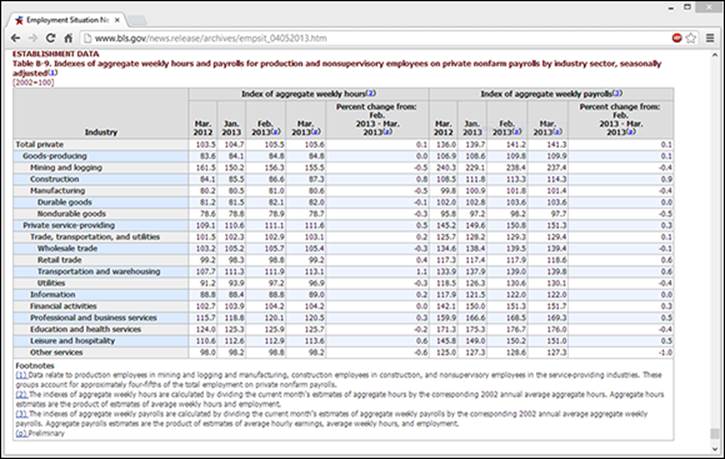
Figure 6-4: As tables in the Employment Situation Summary go, B-9 is simple and compact.
As you examine Table B-9, here’s what you see:
1. The caption at the top is a sort of rust color and begins with ESTABLISHMENT DATA Table B-9: Indexes of Aggregate. . . . This kind of information is just what the caption element is intended to capture and deliver.
2. Below the caption is a set of table headings — a table header, in other words — with a light gray background and various column headings. At the left is a list of industries. Then the table has two sets of columns (labeled Index of Aggregate Weekly Hours and Index of Aggregate Weekly Payrolls), each with four columns of dates and a Percent Change column from February to March 2013.
3. The table body starts with text that reads Total Private and continues down 19 rows until it gets to Other Services, with rows in column 1 (Industry) alternating between a white and a light blue background color. After that, the two sets of columns spell out data for aggregate weekly hours and weekly payrolls, respectively, with five individual columns in each set: March 2012, January through March 2013, and a percent change from the previous month (February 2013) to the present month (March 2013).
4. The table footer includes three footnotes numbered 1 through 3. The special marker, (p), indicates preliminary (that is, not final) data.
Guess what? You already know how to mark up all of this data! We don’t spell out all the details completely, though you’re welcome to play around with this information to recreate the table if you like. We can tell you how to build such a table by the numbers, as it were:
1. The table caption can be captured inside a caption element. You can use the line break (<br>) element to break the line after ESTABLISHMENT DATA and before the actual detailed caption that begins >Table B-9: Indexes of Aggregate. . . . Use the line break element again to break the line before stating the scale indicator "[2002=100]."
2. All of the headings should be contained inside a <thead> element. You use the table heading (<th>) element for each heading cell, so it will be centered and in boldface inside each such cell. The Industry cell should take a rowspan="2" attribute so it fills the entire height of the header area at left, and the Index of . . . cells should each take a colspan="5" attribute so each one covers the four date and percent change columns for its category. All three of those items will appear in the first table heading row, each in its own table heading (<th>) cell. The remaining ten items appear in the second table heading row in their order of appearance in the table. Each of those ten items also appears in its own table heading (<th>) cell. Setting widths for the Industry and various date and percentage columns in the CSS for the header sets widths for the entire rest of the table.
3. In the table body, one row corresponds to each line of data from the online source, starting with the industry name at left and then continuing with the numerical values for dates and percentages in each of the two groups at the right. This task involves 11 table data (<td>) elements for each row shown in that table. Very simple, very mechanical, very easy.
4. The table footer entries all appear in a footer section, which should take a colspan="11" attribute to flow across the entire width of the table. The Footnotes legend can appear inside a single table row (<tr>) and table data (<td>) cell, the latter set to boldface. (Don't use <th>, or the footnote text will be centered.) Each remaining footnote appears inside a single table row and table data cell as indicated in the table.
By using these techniques, you can create a solid, attractive table for presenting numerical and textual data. If you take your time and think your way through what you want your users to see, you can build a preliminary structure in HTML. Then you can start arranging cells and tweaking them until you get them just right. You and Goldilocks — what a team!
Sitting at the Footer of the Table
As the table example from the preceding section shows, you can do all kinds of interesting things with the footer. Here are some ideas for information that you might want to include, should your data require interpretation, explanation, or additional information:
![]() Use footnotes with numeric or letter keys to provide information about specific entries. Where such entries recur, one common footnote entry works well to label such information. For instance, in the table from Figure 6-4, the (p) for preliminary occurs in multiple column headings, but has just one footnote.
Use footnotes with numeric or letter keys to provide information about specific entries. Where such entries recur, one common footnote entry works well to label such information. For instance, in the table from Figure 6-4, the (p) for preliminary occurs in multiple column headings, but has just one footnote.
![]() If your table features icons, specific graphical elements, or special characters as labels, you can use the footer to provide a legend or a key for such things. You can set up a simple two-column layout with the icon or whatever on the left and its explanation or value on the right.
If your table features icons, specific graphical elements, or special characters as labels, you can use the footer to provide a legend or a key for such things. You can set up a simple two-column layout with the icon or whatever on the left and its explanation or value on the right.
![]() When you reproduce tabular data from an online or published source, you can use a footer entry to provide proper attribution to the source, along with a link to the original (which many owners of copyrighted material require you to include).
When you reproduce tabular data from an online or published source, you can use a footer entry to provide proper attribution to the source, along with a link to the original (which many owners of copyrighted material require you to include).
![]() When your tables repeat over time — as with the U.S. Bureau of Labor Statistics reports — you can include notes in the footer to explain what’s new, what’s been removed, or what’s changed as the content and layout adapt to fluid events and situations.
When your tables repeat over time — as with the U.S. Bureau of Labor Statistics reports — you can include notes in the footer to explain what’s new, what’s been removed, or what’s changed as the content and layout adapt to fluid events and situations.
![]() Where data cell values result from specific calculations or corrections, you can use footer information to document the calculations that apply, or the corrections used to produce the data shown.
Where data cell values result from specific calculations or corrections, you can use footer information to document the calculations that apply, or the corrections used to produce the data shown.
We could go on forever in this vein, but we have to imagine you have the idea by this point and can go on to spin out more ideas and applications for table footers. Go ahead: Knock yourself out. We approve!
Exploring and Explaining a Table
We have uploaded the HTML markup for Table B-9 to the HTML5 Cafe website. You can find it at:
www.dummieshtml.com/html5cafe/ch06/TableB-9.html
If you look through this markup, you can see that we did an almost-perfect job of predicting how the table was architected. In fact, the only item we got wrong deals with the table footer — of which there isn’t one. Instead, the U.S. Bureau of Labor Statistics page designers elected to include straightforward text paragraphs for the footnote head, and each of the footnotes that follow, before closing out the table markup. This keeps the text inside the table frame without obligating column management for text data that’s intended to span the entire width of the table anyway.
Oh caption, my caption
The caption uses a line break element to separate the all-caps ESTABLISHMENT DATA from the actual table name (Table B-9: Indexes of Aggregate Weekly Hours . . .). But the separation of the scale information ([2002=100]) depends on use of a pair of span elements in the thead section, which forces a line break when transitioning from the main caption text to this supplementary label.
If you examine the table header source code in the file, you also find that they use inter-document links (explained in Chapter 8) to make it easy to jump directly to footnotes as they appear in the table. (Savvy users employ a Back button or backspace key to return to whence they jumped, too.) These are all nice touches worth emulating.
Is the header dead yet?
With all apologies to Glenn Frey for this section title, there's nothing to complain about in how the U.S. Bureau of Labor Statistics designers put this table head together in the table shown earlier in Figure 6-4. They used the rowspan and colspan attributes in the first table row to get the layout as it appears, and the column headings in the second row march out in sequence just as they should.
As you look at the source code, notice how the designer lays out each row in the table: You see a pair of <tr></tr> tags for each row, along with just the right number of data cells (usually denoted <td></td>). But because we're in the header section for this table, you can use table heading (<th>) markup to make up a complete table row by creating the proper number of cells.
You can say what you like about the Feds, but this is some of the most readable production HTML we’ve ever seen. Even if it isn’t HTML5 (yet), it’s incredibly clean, well laid out, and easy to read and follow. (Maybe all those taxpayer dollars aren’t being wasted after all.)
Marching through the table body
If you look at the individual table rows in the markup, you can see the same regular, predictable structure repeating for each one. The difference between the Industry cells (which appear with alternating blue and white backgrounds) hinges on the alternating presence or absence of agreenbar class for the table row in which they reside. Each table row follows a regular structure, with a table heading (<th>) cell in the industry column at the far left, and table data (<td>) cells for all remaining data in the other ten cells in each row.
Here’s the markup for one row in the body of Table B-9 to give you a taste of what it looks and reads like:
<tr>
<th id="ces_table9.r.1"><p class="sub0">Total private</p></th>
<td><span class="datavalue">103.5</span></td>
<td><span class="datavalue">104.7</span></td>
<td><span class="datavalue">105.5</span></td>
<td><span class="datavalue">105.6</span></td>
<td><span class="datavalue">0.1</span></td>
<td><span class="datavalue">136.0</span></td>
<td><span class="datavalue">139.7</span></td>
<td><span class="datavalue">141.2</span></td>
<td><span class="datavalue">141.3</span></td>
<td><span class="datavalue">0.1</span></td>
</tr>
The special datavalue CSS class formats data value cells (columns 2 through 11) with a unique CSS identifier (ces_table9.r.1) for the leftmost cell. A paragraph class (sub0) designates CSS for the heading that reads "Total Private" in the preceding HTML snippet. That's how detailed layout, positioning, and appearance controls are applied to table information throughout. But what's most noteworthy is how simple, regular, and predictable the overall markup is. Our best guess: A program is generating that HTML automatically, probably from a spreadsheet somewhere.
Finishing with the footer
We admit it once again: We expected to see a table footer (<tfoot> element) at the bottom of the table shown earlier in Figure 6-4. What we saw instead was a second table body (<tbody>) with a single table row (and yes, with a single data cell <td colspan="11">). However, within that lone table data cell, the content is laid out in a single paragraph (using the <p> element), with manual line breaks (<br>) between each individual footnote. Here's what that markup looks like:
<tbody>
<tr class="footnotes">
<td class="footnotes" colspan="11">
<p class="footnotes">
<span class="footnotestitle">Footnotes<br /></span>
<a id="ces_table9.f.1" name="ces_table9.f.1">(1) </a>Data relate to production employees in mining and logging and manufacturing, construction employees in construction, and nonsupervisory employees in the service-providing industries. These groups account for approximately four-fifths of the total employment on private nonfarm payrolls.<br />
<a id="ces_table9.f.2" name="ces_table9.f.2">(2) </a>The indexes of aggregate weekly hours are calculated by dividing the current month's estimates of aggregate hours by the corresponding 2002 annual average aggregate hours. Aggregate hours estimates are the product of estimates of average weekly hours and employment.<br />
<a id="ces_table9.f.3" name="ces_table9.f.3">(3) </a>The indexes of aggregate weekly payrolls are calculated by dividing the current month's estimates of aggregate weekly payrolls by the corresponding 2002 annual average aggregate weekly payrolls. Aggregate payrolls estimates are the product of estimates of average hourly earnings, average weekly hours, and employment.<br />
<a id="ces_table9.f.p" name="ces_table9.f.p">(p) </a>Preliminary<br />
</p>
</td>
</tr>
</tbody>
There's absolutely nothing wrong with this approach, but there's no reason why the designers couldn't have used the <tfoot> element instead, either. That's the nice thing about learning HTML: When you get acquainted with the structure and the syntax, you quickly discover that you have many ways to do what needs to be done. This one works quite nicely and is very readable.