HTML5: The Missing Manual Matthew MacDonald (2013)
Part 2. Video, Graphics, and Glitz
Chapter 8. Basic Drawing with the Canvas
As you learned in Chapter 1, one of HTML5’s goals is to make it easier to put rich applications inside otherwise ordinary web pages. In this case, the word “rich” doesn’t have anything to do with your bank account. Instead, a rich application is one that’s decked out with slick graphics, interactive features, and showy frills like animation.
One of the most important HTML5 tools for rich applications is the canvas, a drawing surface where you can let your inner Picasso loose. Compared with every other HTML element, the canvas is unique because it requires JavaScript. There’s no way to draw shapes or paint pictures without it. That means the canvas is essentially a programming tool—one that takes you far beyond the original document-based idea of the Web.
At first, using the canvas can feel like stuffing your page with a crude version of Windows Paint. But dig deeper, and you’ll discover that the canvas is the key to a range of graphically advanced applications, including some you’ve probably already thought about (like games, mapping tools, and dynamic charts) and others that you might not have imagined (like musical lightshows and physics simulators). In the not-so-distant past, these applications were extremely difficult without the help of a browser plug-in like Flash. Today, with the canvas, they’re all possible, provided you’re willing to put in a fair bit of work.
In this chapter, you’ll learn how to create a canvas and fill it up with lines, curves, and simple shapes. Then you’ll put your skills to use by building a simple painting program. And, perhaps most importantly, you’ll learn how you can get canvas-equipped pages to work on old browsers that don’t support HTML5.
NOTE
For some developers, the canvas will be indispensable. For others, it will just be an interesting diversion. (And for some, it may be interesting but still way too much work compared with a mature programming platform like Flash.) But one thing is certain: This straightforward drawing surface is destined to be much more than a toy for bored programmers.
Getting Started with the Canvas
The <canvas> element is the place where all your drawing takes place. From a markup point of view, it’s as simple as can be. You supply three attributes: id, width, and height:
<canvas id="drawingCanvas" width="500" height="300"></canvas>
The id attribute gives the canvas a unique name, which you’ll need when your script code goes searching for it. The width and height attributes set the size of your canvas, in pixels.
NOTE
You should always set the size of your canvas through the width and height attributes, not the width and height style sheet properties. To learn about the possible problem that can occur if you use style sheet sizing, see the box on My Pictures Are Squashed!.
Ordinarily, the canvas shows up as a blank, borderless rectangle (which is to say it doesn’t show up at all). To make it stand out on the page, you can apply a background color or a border with a style sheet rule like this:
canvas {
border: 1px dashed black;
}
Figure 8-1 shows this starting point.
To work with a canvas, you need to fire off a bit of JavaScript that takes two steps. First, your script must use the indispensable document.getElementById() method to grab hold of the canvas object. In this example, you’ll name the canvas drawingCanvas, so the code looks like this:
var canvas = document.getElementById("drawingCanvas");
This code is nothing new, as you use the getElementById() method whenever you need to find an HTML element on your page.
NOTE
If you aren’t familiar with JavaScript, you won’t get far with the canvas. To brush up with the absolute bare-minimum essentials, read Appendix B.
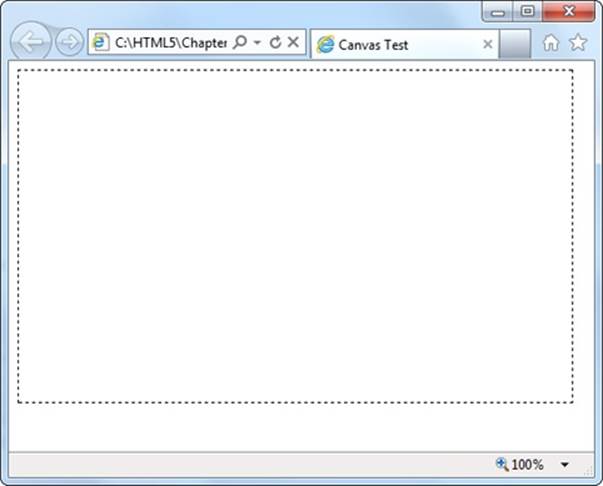
Figure 8-1. Every canvas begins as an empty rectangle somewhere on a web page. To put even a single line inside, you need to write some JavaScript code.
Once you have the canvas object, you can take the second essential step. You use the canvas object’s getContext() method to retrieve a two-dimensional drawing context, like this:
var context = canvas.getContext("2d");
You can think of the context as a supercharged drawing tool that handles all your canvas tasks, like painting rectangles, writing text, pasting an image, and so on. It’s a sort of one-stop shop for canvas drawing operations.
NOTE
The fact that the context is explicitly called two-dimensional (and referred to as 2d in the code) raises an obvious question—namely, is there a three-dimensional drawing context? Not yet, but the creators of HTML5 have clearly left space for one in the future.
You can grab the context object and start drawing at any point: for example, when the page first loads, when the visitor clicks a button, or at some other point. When you’re just starting out with the canvas, you probably want to create a practice page that gets to work straightaway. Here’s a template for a page that does just that:
<!DOCTYPE html>
<html lang="en">
<head>
<meta charset="utf-8">
<title>Canvas Test</title>
<style>
canvas {
border: 1px dashed black;
}
</style>
<script>
window.onload = function() {
var canvas = document.getElementById("drawingCanvas");
var context = canvas.getContext("2d");
// (Put your fabulous drawing code here.)
};
</script>
</head>
<body>
<canvas id="drawingCanvas" width="500" height="300"></canvas>
</body>
</html>
The <body> of this page includes the <canvas> element and no other markup. The <style> section of this page makes the canvas stand out with a border. The <script> section handles the window.onload event, which occurs once the browser has completely loaded the page. The code then gets the canvas, creates a drawing context, and gets ready to draw. You can use this example as the starting point for your own canvas experiments.
NOTE
Of course, when you’re using the canvas in a real page on your website, you’ll want to declutter a bit by snipping out the JavaScript code and putting it in an external script file (Moving the Code to a Script File). But for now, this template gives you single-page convenience. If you want to type the examples in on your own, you can get this markup from the CanvasTemplate.html file on the try-out site (http://prosetech.com/html5).
Straight Lines
Now you’re just about ready to start drawing. But before you add anything on a canvas, you need to understand its coordinate system. Figure 8-2 shows you how it works.
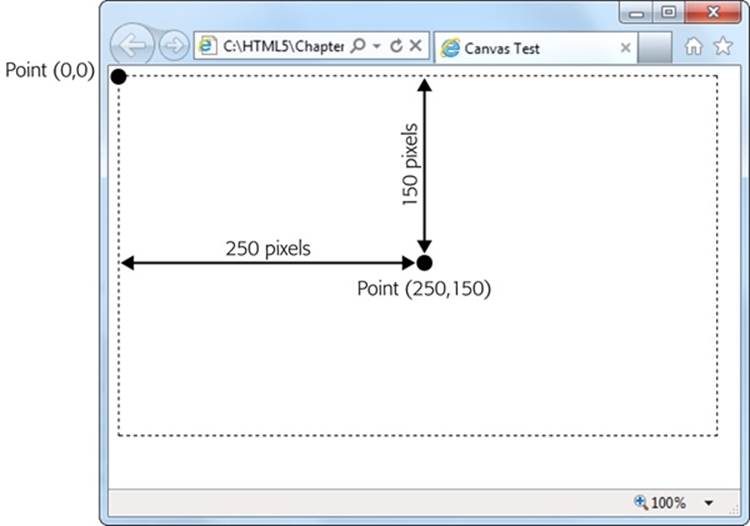
Figure 8-2. As with every other HTML element, the canvas designates its top-left corner as the point (0,0). As you move right, the x-value increases, and as you move down, the y-value increases. If a canvas is 500 x 300 pixels, then the bottom-right corner is point (500, 300).
The simplest thing you can draw on a canvas is a solid line. Doing that takes three actions with the drawing context. First, you use the moveTo() method to move to the point where you want the line to start. Second, you use the lineTo() method to travel from the current point to the end of the line. Third, you call the stroke() method to make the line actually appear:
context.moveTo(10,10);
context.lineTo(400,40);
context.stroke();
Or think of it this way: First you lift up your pen and put it where you want (using moveTo), then you drag the pen across the canvas (using lineTo), then you make the line appear (using stroke). This result is a thin (1-pixel) black line from point (10,10) to point (400,40).
Happily, you can get a little fancier with your lines. At any point before you call the stroke() method that winks your line into existence, you can set three drawing context properties: lineWidth, strokeStyle, and lineCap. These properties affect everything you draw from that point on, until you change them.
You use lineWidth to set the width of your lines, in pixels. Here’s a thick, 10-pixel line:
context.lineWidth = 10;
You use strokeStyle to set the color of your lines. You can use an HTML color name, an HTML color code, or the CSS rgb() function which lets you assemble a color from red, green, and blue components. (This approach is useful because most drawing and painting programs use the RGB system.) No matter which one you use, you need to wrap the whole value in quotation marks, as shown here:
// Set the color (brick red) using an HTML color code:
context.strokeStyle = "#cd2828";
// Set the color (brick red) using the rgb() function:
context.strokeStyle = "rgb(205,40,40)";
NOTE
This property is named strokeStyle rather than strokeColor because you aren’t limited to plain colors. As you’ll see later on, you can use color blends called gradients (Filling Shapes with Gradients) and image-based patterns (Filling Shapes with Patterns).
Finally, use lineCap to decide how you want to cap off the ends of your lines. The default is to make a squared-off edge with butt, but you can also use round (to round off the edge) or square (which looks the same as butt, but extends the line an amount equal to half its thickness on each end).
And here’s the complete script code you need to draw three horizontal lines, with different line caps (Figure 8-3). To try this code out, pop it into any JavaScript function you want. To make it run right away, put it in the function that handles the window.onload event, as shown on Straight Lines:
var canvas = document.getElementById("drawingCanvas");
var context = canvas.getContext("2d");
// Set the line width and color (for all the lines).
context.lineWidth = 20;
context.strokeStyle = "rgb(205,40,40)";
// Draw the first line, with the standard butt ending.
context.moveTo(10,50);
context.lineTo(400,50);
context.lineCap = "butt";
context.stroke();
// Draw the second line, with a round cap.
context.beginPath();
context.moveTo(10,120);
context.lineTo(400,120);
context.lineCap = "round";
context.stroke();
// Draw the third line, with a square cap.
context.beginPath();
context.moveTo(10,190);
context.lineTo(400,190);
context.lineCap = "square";
context.stroke();
This example introduces one new feature: the beginPath() method of the drawing context. When you call beginPath(), you start a new, separate segment of your drawing. Without this step, every time you call stroke(), the canvas will attempt to draw everything over again. This is a particular problem if you’re changing other context properties. In this case, you’d end up drawing over your existing content with the same shapes but a new color, thickness, or line cap.
NOTE
While you do need to begin new segments by calling beginPath(), you don’t need to do anything special to end a segment. Instead, the current segment is automatically considered “finished” the moment you create a new segment.
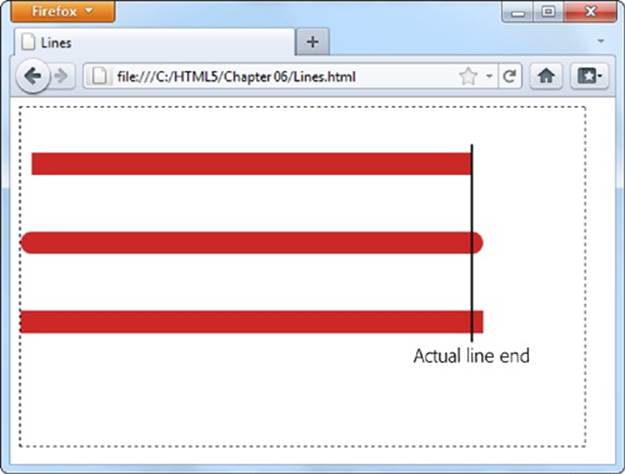
Figure 8-3. The top line uses the standard butt ending, while the lines below have added caps (round or square), which extend the line by an amount equal to half the line’s thickness.
Paths and Shapes
In the previous example, you separated different lines by starting a new path for each one. This method lets you give each line a different color (and a different width and cap style). Paths are also important because they allow you to fill custom shapes. For example, imagine you create a red-outlined triangle using this code:
context.moveTo(250,50);
context.lineTo(50,250);
context.lineTo(450,250);
context.lineTo(250,50);
context.lineWidth = 10;
context.strokeStyle = "red";
context.stroke();
But if you want to fill that triangle, the stroke() method won’t help you. Instead, you need to close the path by calling closePath(), pick a fill color by setting the fillStyle property, and then call the fill() method to make it happen:
context.closePath();
context.fillStyle = "blue";
context.fill();
It’s worth tweaking a couple of things in this example. First, when closing a path, you don’t need to draw the final line segment, because calling closePath() automatically draws a line between the last drawn point and the starting point. Second, it’s best to fill your shape first, and thendraw its outline. Otherwise, your outline may be partially overwritten by the fill.
Here’s the complete triangle-drawing code:
var canvas = document.getElementById("drawingCanvas");
var context = canvas.getContext("2d");
context.moveTo(250,50);
context.lineTo(50,250);
context.lineTo(450,250);
context.closePath();
// Paint the inside.
context.fillStyle = "blue";
context.fill();
// Draw the outline.
context.lineWidth = 10;
context.strokeStyle = "red";
context.stroke();
Notice that you don’t need to use beginPath() in this example, because the canvas starts you off with a new path automatically. You need to call beginPath() only when you need a new path—for example, when changing line settings or drawing a new shape. Figure 8-4 shows the result of running this JavaScript.
NOTE
When drawing connecting line segments (like the three sides of this triangle), you can set the drawing context’s lineJoin property to round or bevel the edges (by using the values round or bevel—the default is mitre).
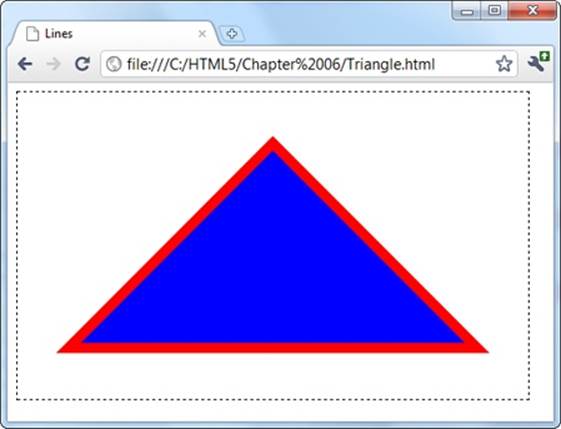
Figure 8-4. To create a closed shape like this triangle, use moveTo() to get to the starting point, lineTo() to draw each line segment, and closePath() to complete the shape. You can then fill it with fill() and outline it with stroke().
Most of the time, when you want a complex shape, you’ll need to assemble a path for it, one line at a time. But there’s one shape that’s important enough to get special treatment: the rectangle. You can fill a rectangular region in one step using the fillRect() method. You supply the coordinate for the top-left corner, the width, and the height.
For example, to place a 100 x 200 pixel rectangle starting at point (0,10), use this code:
fillRect(0,10,100,200);
The fillRect() method gets the color to use from the fillStyle property, just like the fill() method.
Similarly, you can use strokeRect() to draw the outline of a rectangle in one step:
strokeRect(0,10,100,200);
The strokeRect() method uses the current lineWidth and strokeStyle properties to determine the thickness and color of the outline, just as the stroke() method does.
Curved Lines
If you want something more impressive than lines and rectangles (and who doesn’t?), you’ll need to understand four methods that can really throw you for a curve: arc(), arcTo(), bezierCurveTo(), and quadraticCurveTo(). All of these methods draw curved lines in different ways, and they all require at least a smattering of math (and some need a whole lot more).
The arc() method is the simplest of the bunch. It draws a portion of a circle’s outline. To draw an arc, you first need to visualize an imaginary circle, and then decide which part of the edge you need, as explained in Figure 8-5. You’ll then have all the data you need to pass to the arc()method.
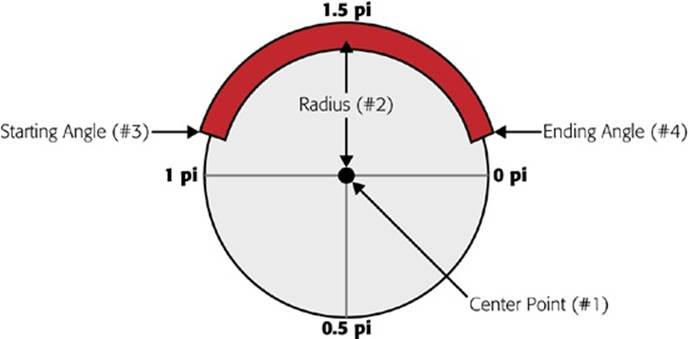
Figure 8-5. An arc seems simple enough, but you need several pieces of information to describe it completely. First, you need to pin down the imaginary circle. That requires the coordinates of the center point (#1) and the radius that indicates how big the circle is (#2). Next, you need to describe the length of the arc, which requires the angle where the arc starts (#3) and the angle where it ends (#4). You must supply angles in radian coordinates, which are expressed as fractions of the constant pi. (So 1 pi is halfway around the circle, and 2 pi is all the way around, as indicated here.)
Once you’ve sorted out all the details you need, you can call the arc() method:
var canvas = document.getElementById("drawingCanvas");
var context = canvas.getContext("2d");
// Create variables to store each detail about the arc.
var centerX = 150;
var centerY = 300;
var radius = 100;
var startingAngle = 1.25 * Math.PI;
var endingAngle = 1.75 * Math.PI;
// Use this information to draw the arc.
context.arc(centerX, centerY, radius, startingAngle, endingAngle);
context.stroke();
Or, call closePath() before you call stroke() to add a straight line between the two ends of the arc. This creates a closed semi-circle.
Incidentally, a circle is simply an arc that stretches all the way around. You can draw it like this:
var canvas = document.getElementById("drawingCanvas");
var context = canvas.getContext("2d");
var centerX = 150;
var centerY = 300;
var radius = 100;
var startingAngle = 0;
var endingAngle = 2 * Math.PI;
context.arc(centerX, centerY, radius, startingAngle, endingAngle);
context.stroke();
NOTE
The arc() method doesn’t let you draw an ellipse (a flattened circle). To get that, you need to do more work—either use some of the more sophisticated curve methods described next, or use a transform (Transforms) to stretch out an ordinary circle as you draw it.
The three other curve methods—arcTo(), bezierCurveTo(), and quadraticCurveTo()—are a bit more intimidating to the geometrically challenged. They involve a concept called control points—points that aren’t included in the curve, but influence the way it’s drawn. The most famous example is the Bézier curve, which is used in virtually every computer illustration program ever created. It’s popular because it creates a curve that looks smooth no matter how small or big you draw it. Figure 8-6 shows how control points shape a Bézier curve.
And here’s the code that creates the curve from Figure 8-6:
var canvas = document.getElementById("drawingCanvas");
var context = canvas.getContext("2d");
// Put the pen where the curve starts.
context.moveTo(62, 242);
// Create variables for the two control points and the end point of the curve.
var control1_x = 187;
var control1_y = 32;
var control2_x = 429;
var control2_y = 480;
var endPointX = 365;
var endPointY = 133;
// Draw the curve.
context.bezierCurveTo(control1_x, control1_y, control2_x, control2_y,
endPointX, endPointY);
context.stroke();
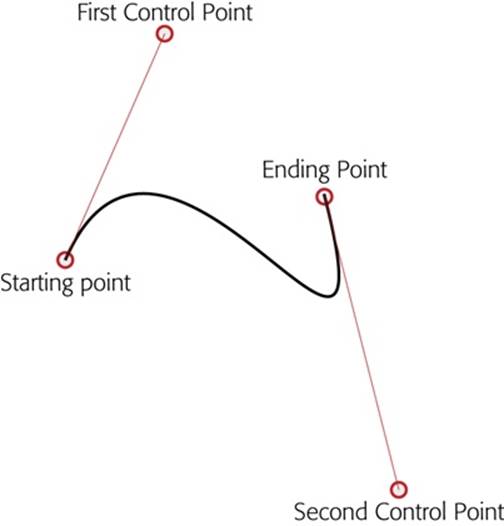
Figure 8-6. A Bézier curve has two control points. The start of the curve runs parallel to the first control point. The end of the curve runs parallel to the second control point. In between, the line curves. The amount of curvature is influenced by the distance to the control point—the farther away the point is, the stronger its “pull.” It’s sort of like gravity, but in reverse.
The outline of a complex, organic shape often involves a series of arcs and curves glued together. Once you’re finished, you can call closePath() to fill or outline the entire shape. The best way to learn about curves is to play with one on your own. You can find a perfect test page athttp://tinyurl.com/html5bezier (Figure 8-7).
Transforms
A transform is a drawing technique that lets you shift the canvas’s coordinate system. For example, imagine you want to draw the same square in three places. You could call fillRect() three times, with three different points:
var canvas = document.getElementById("drawingCanvas");
var context = canvas.getContext("2d");
// Draw a 30x30 square, at three places.
context.rect(0, 0, 30, 30);
context.rect(50, 50, 30, 30);
context.rect(100, 100, 30, 30);
context.stroke();
Or you could call fillRect() three times, with the same point, but shift the coordinate system each time so the square actually ends up in three different spots, like so:
var canvas = document.getElementById("drawingCanvas");
var context = canvas.getContext("2d");
// Draw a square at (0,0).
context.rect(0, 0, 30, 30);
// Shift the coordinate system down 50 pixels and right 50 pixels.
context.translate(50, 50);
context.rect(0, 0, 30, 30);
// Shift the coordinate system down a bit more. Transforms are cumulative,
// so now the (0,0) point will actually be at (100,100).
context.translate(50, 50);
context.rect(0, 0, 30, 30);
context.stroke();
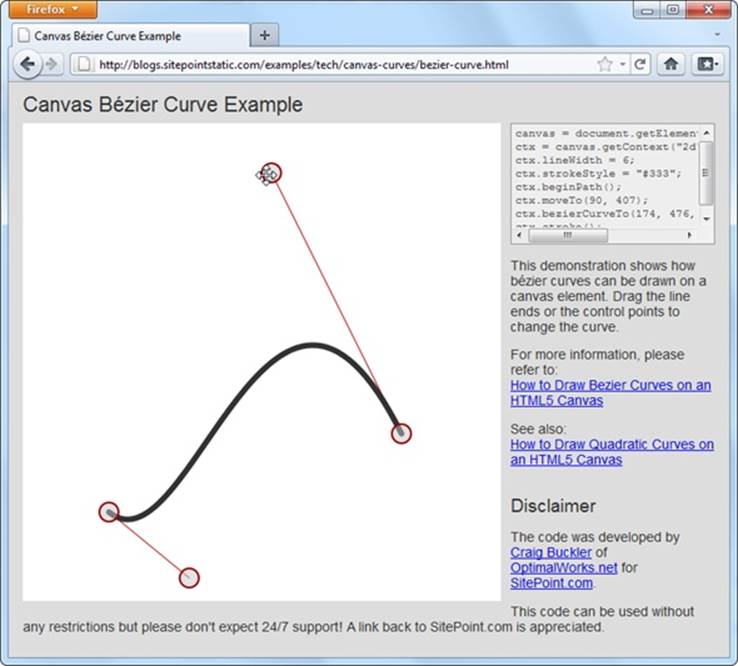
Figure 8-7. This page (found at http://tinyurl.com/html5bezier) lets you tweak all the details of a Bézier curve by clicking and pulling with the mouse. Best of all, as you drag the starting point, control points, and end point, the page generates the corresponding snippet of HTML5 canvas code that you can use to create the same curve on your own canvas. You can find a similarly great test page for quadratic curves at http://tinyurl.com/html5quadratic.
FREQUENTLY ASKED QUESTION: CANVAS DRAWING FOR MATH-PHOBES
How do I get all the shapes with none of the headaches?
If you’re hoping to use the canvas to create eye-catching graphics, but you don’t want to pick up a degree in geometry, you might be a bit frustrated. Fortunately, there are several approaches that can help you draw what you want without worrying about the mathematical underpinnings:
§ Use a drawing library. Why draw everything the hard way when you can use someone else’s drawing library to draw circles, triangles, ellipses, and polygons in a single step? The idea is simple—you call a higher-level method (say, fillEllipse(), with the appropriate coordinates), and the JavaScript library translates that to the correct canvas operations. Two good examples areFabric.js (http://fabricjs.com) and KineticJS (http://kineticjs.com). However, these libraries (and more) are still evolving—and rapidly. It’s too soon to say which ones will have real staying power, but you could read a lively debate and some developer suggestion on the popular question-and-answer Stack Overflow site (http://tinyurl.com/canvas-libraries).
§ Draw bitmap images. Instead of painstakingly drawing each shape you need, you can copy ready-made graphics to your canvas. For example, if you have an image of a circle with a file name circle.png, you can insert that into your canvas using the approach shown on Drawing Images. However, this technique won’t give you the same flexibility to manipulate your image (for example, to stretch it, rearrange it, remove part of it, and so on).
§ Use an export tool. If you have a complex graphic and you need to manipulate it on the canvas or make it interactive, drawing a fixed bitmap isn’t good enough. But a conversion tool that can examine your graphic and generate the right canvas-creation code just might solve your problem. One intriguing example is the Ai→Canvas plug-in for Adobe Illustrator (http://visitmix.com/labs/ai2canvas), which converts Adobe Illustrator artwork to an HTML page with JavaScript code that painstakingly recreates the picture on a canvas.
Both versions of this code have the same effect: They draw three squares, in the same three spots.
At first glance, transforms may seem like nothing more than a way to make a somewhat complicated drawing task even more complicated. But transforms can work magic in some tricky situations. For example, suppose you have a function that draws a series of complex shapes that, put together, create a picture of a bird. Now, say you want to animate that bird, so it appears to fly around the canvas. (You’ll see a basic example of animation on the canvas on A Basic Animation.)
Without transforms, you’d need to adjust every coordinate in your drawing code each time you drew the bird. But with transforms, you can leave your drawing code untouched and simply tweak the coordinate system over and over again.
Transforms come in several different flavors. In the previous example, a translate transform was used to move the center point of the coordinate system—that’s the (0,0) point that’s usually placed in the top-left corner of the canvas. Along with the translate transform, there’s also a scaletransform (which lets you draw things bigger or smaller), a rotate transform (which lets you turn the coordinate system around), and a matrix transform (which lets you stretch and warp the coordinate system in virtually any way—provided you understand the complex matrix math that underpins the visual effect you want).
Transforms are cumulative. The following example moves the (0,0) point to (100,100) with a translate transform and then rotates the coordinate system around that point several times. Each time, it draws a new square, creating the pattern shown in Figure 8-8:
var canvas = document.getElementById("drawingCanvas");
var context = canvas.getContext("2d");
// Move the (0,0) point. This is important, because
// the rotate transform turns around this point.
context.translate(100, 100);
// Draw 10 squares.
var copies = 10;
for (var i=1; i<copies; i++) {
// Before drawing the square, rotate the coordinate system.
// A complete rotation is 2*Math.PI. This code does a fraction of this
// for each square, so that it has rotated around completely by the time
// it's drawn the last one.
context.rotate(2 * Math.PI * 1/(copies-1));
// Draw the square.
context.rect(0, 0, 60, 60);
}
context.stroke();
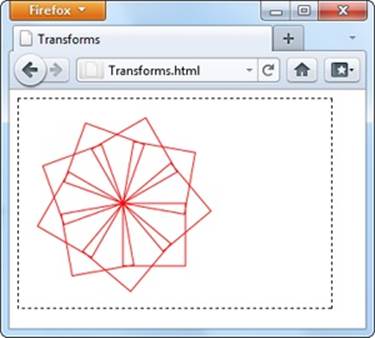
Figure 8-8. By drawing a series of rotated squares, you can create Spirograph-like patterns.
TIP
You can use the drawing context’s save() method to save the current state of the coordinate system. Later on, you can use the restore() method to return to your previous saved state. You might want to call save() before you’ve applied any transforms, so you can call restore() to get the coordinate system back to normal. And in long, complex drawing tasks, you might save the state many times. This list of saved states acts like the web page history in a browser. Each time you call restore(), the coordinate system reverts to the immediately preceding state.
Transforms are somewhat beyond the scope of this chapter. If you want to explore them in more detail, Mozilla (the company that created Firefox) has some helpful documentation and examples at http://tinyurl.com/canvas-transforms.
Transparency
So far, you’ve been dealing with solid colors. However, the canvas also lets you use partial transparency to layer one shape over another. There are two ways to use transparency with the canvas. The first approach is to set a color (through the fillStyle or strokeStyle properties) with the rgba() function, instead of the more common rgb() function. The rgba() function takes four arguments—the numbers for the red, green, and blue color components (from 0 to 255), and an additional number for the alpha value (from 0 to 1), which sets the color’s opacity. An alpha value of 1 is completely solid, while an alpha value of 0 is completely invisible. Set a value in between—for example, 0.5—and you get a partially transparent color that any content underneath shows through.
NOTE
What content is underneath and what content is on top depends solely on the order of your drawing operations. For example, if you draw a circle first, and then a square at the same location, the square will be superimposed on top of the circle.
Here’s an example that draws a circle and a triangle. They both use the same fill color, except that the triangle sets the alpha value to 0.5, making it 50 percent opaque:
var canvas = document.getElementById("drawingCanvas");
var context = canvas.getContext("2d");
// Set the fill and outline colors.
context.fillStyle = "rgb(100,150,185)";
context.lineWidth = 10;
context.strokeStyle = "red";
// Draw a circle.
context.arc(110, 120, 100, 0, 2*Math.PI);
context.fill();
context.stroke();
// Remember to call beginPath() before adding a new shape.
// Otherwise, the outlines of both shapes will
// be merged together in an unpredictable way.
context.beginPath();
// Give the triangle a transparent fill.
context.fillStyle = "rgba(100,150,185,0.5)";
// Now draw the triangle.
context.moveTo(215,50);
context.lineTo(15,250);
context.lineTo(315,250);
context.closePath();
context.fill();
context.stroke();
Figure 8-9 shows the result.
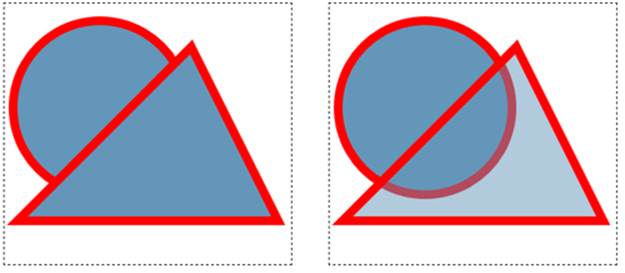
Figure 8-9. Left: Two solid shapes, one on top of the other. Right: One solid shape, with a semitransparent shape on top. Semitransparent shapes look lighter (because they let the white background through), and they allow you to see whatever content you’ve drawn underneath. Notice that in this example, the semitransparent shape uses a fully opaque color for its border.
The other way to use transparency is to set the drawing context’s globalAlpha property, like this:
context.globalAlpha = 0.5;
// Now this color automatically gets an alpha value of 0.5:
context.fillStyle = "rgb(100,150,185)";
Do that, and everything you draw from that point on (until you change globalAlpha again) will use the same alpha value and get the same degree of transparency. This includes both stroke colors and fill colors.
So which approach is better? If you need just a single transparent color, use rgba(). If you need to paint a variety of shapes with different colors, and they all need the same level of transparency, use globalAlpha. The globalAlpha property is also useful if you want to paint semitransparent images on your canvas, as you’ll learn to do on A Basic Animation.
Composite Operations
So far, this chapter has assumed that when you put one shape on top of another, the second shape paints over the first, obscuring it. The canvas works this way most of the time. However, the canvas also has the ability to use more complex composite operations.
A composite operation is a rule that tells the canvas how to display two images that overlap. The default composite operation is source-over, which tells the canvas that the new shape should be painted over the first shape (that is, on top of the first shape). If the new shape overlaps with the first shape, the new shape obscures it.
NOTE
In the lingo of composite operations, the source is the new object you’re drawing, and the destination is the existing content on the canvas that you’ve already drawn.
But other composition options are possible. For example, you can use xor, which tells the canvas to show nothing at all in the area where the shapes overlap. Figure 8-10 shows an overview of the different composite operations.
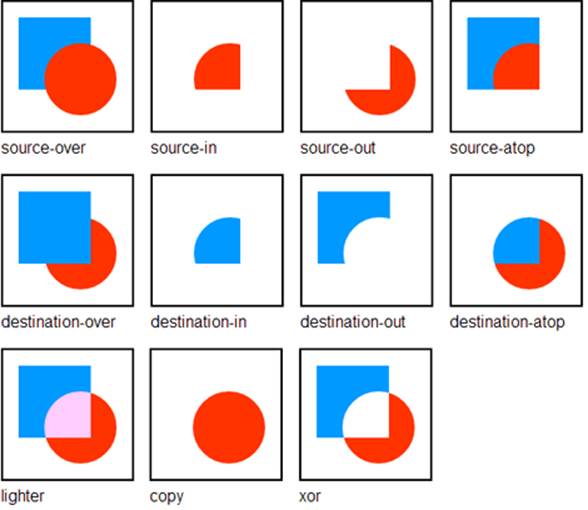
Figure 8-10. Here are the 11 possible composite operations and their effects. There used to be 12, but browser makers couldn’t agree on how to perform the calculations for the darker composite operation, and it was dropped.
To change the current composite operation that the canvas uses, simply set the drawing context’s globalCompositeOperation property before you draw the second shape, like this:
context.globalCompositeOperation = "xor";
For example, to create the source-atop combination shown in the top-right corner of Figure 8-10, you’d use this code:
var canvas = document.getElementById("drawingCanvas");
var context = canvas.getContext("2d");
// Draw a rectangle.
context.fillStyle = "blue";
context.fillRect(15,15,70,70);
// Choose the global composite operation.
context.globalCompositeOperation = "source-atop";
// Draw a circle overtop.
context.fillStyle = "red";
context.beginPath();
context.arc(75, 75, 35, 0, Math.PI*2, true);
context.fill();
Used cleverly, a composite operation can provide shortcuts for certain drawing tasks, like drawing complex shapes. Hard-core canvas coders can even use these shortcuts to improve performance by reducing the number of drawing operations they perform.
In the recent past, browsers didn’t quite agree on how to deal with certain composite operations. Fortunately, these quirks have now been ironed out. The only issue is with any polyfills that you use to get canvas support on old browsers. Right now, the only polyfill that supports composite operations is FlashCanvas Pro (The Canvas Fallback and Feature Detection).
Building a Basic Paint Program
The canvas still has a fair bit more in store for you. But you’ve covered enough ground to build your first practical canvas-powered program. It’s the simple painting program shown in Figure 8-11.
The JavaScript that makes this example work is longer than the examples you’ve seen so far, but still surprisingly straightforward. You’ll consider it piece by piece in the following sections.
TIP
If you’re curious about the style sheet rules that create the blue toolbars above and below the canvas, you want to see the whole example in one piece, or you just want to paint something in your browser, then you can use the Paint.html file on the try-out site (http://prosetech.com/html5).
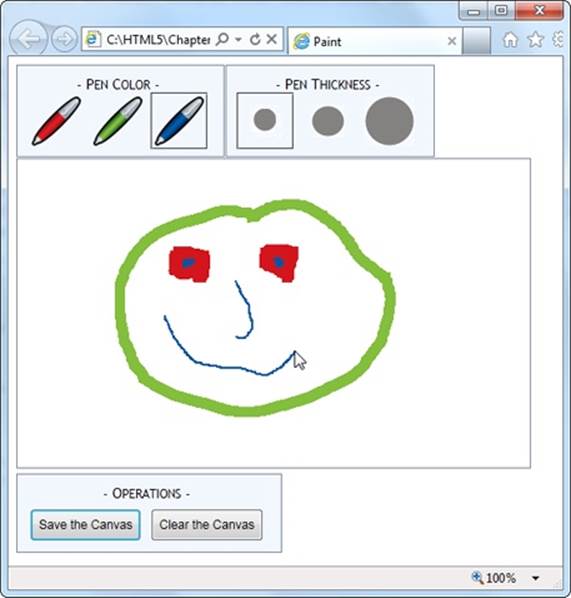
Figure 8-11. To express yourself with this paint program, just pick a pen color, pick a pen thickness, and scribble away with the mouse.
Preparing to Draw
First, when the page loads, the code grabs the canvas object and attaches functions that will handle several JavaScript events for different mouse actions: onMouseDown, onMouseUp, onMouseOut, and onMouseMove. (As you’ll see, these events control the drawing process.) At the same time, the page also stores the canvas in a handy global variable (named canvas), and the drawing context in another global variable (named context). This way, these objects will be easily available to the rest of the code:
var canvas;
var context;
window.onload = function() {
// Get the canvas and the drawing context.
canvas = document.getElementById("drawingCanvas");
context = canvas.getContext("2d");
// Attach the events that you need for drawing.
canvas.onmousedown = startDrawing;
canvas.onmouseup = stopDrawing;
canvas.onmouseout = stopDrawing;
canvas.onmousemove = draw;
};
To get started with the paint program, the person using the page chooses the pen color and pen thickness from the two toolbars at the top of the window. These toolbars are simple <div> elements styled to look like nice steel-blue boxes, with a handful of clickable <img> elements in them. For example, here’s the toolbar with the three color choices:
<div class="Toolbar">
- Pen Color -<br>
<img id="redPen" src="pen_red.gif" alt="Red Pen"
onclick="changeColor('rgb(212,21,29)', this)">
<img id="greenPen" src="pen_green.gif" alt="Green Pen"
onclick="changeColor('rgb(131,190,61)', this)">
<img id="bluePen" src="pen_blue.gif" alt="Blue Pen"
onclick="changeColor('rgb(0,86,166)', this)">
</div>
The important part of this markup is the <img> element’s onclick attribute. Whenever the web page visitor clicks a picture, the <img> element calls the changeColor() function. The changeColor() function accepts two pieces of information—the new color, which is set to match the icon, and a reference to the <img> element that was clicked. Here’s the code:
// Keep track of the previous clicked <img> element for color.
var previousColorElement;
function changeColor(color, imgElement) {
// Change the current drawing color.
context.strokeStyle = color;
// Give the newly clicked <img> element a new style.
imgElement.className = "Selected";
// Return the previously clicked <img> element to its normal state.
if (previousColorElement != null) previousColorElement.className = "";
previousColorElement = imgElement;
}
The changeColor() code takes care of two basic tasks. First, it sets the drawing context’s strokeStyle property to match the new color; this takes a single line of code. Second, it changes the style of the clicked <img> element, giving it a solid border, so it’s clear which color is currently active. This part requires a bit more work, because the code needs to keep track of the previously selected color so it can remove the solid border around that <img> element.
The changeThickness() function performs an almost identical task, only it alters the lineWidth property to have the appropriate thickness:
// Keep track of the previously clicked <img> element for thickness.
var previousThicknessElement;
function changeThickness(thickness, imgElement) {
// Change the current drawing thickness.
context.lineWidth = thickness;
// Give the newly clicked <img> element a new style.
imgElement.className = "Selected";
// Return the previously clicked <img> element to its normal state.
if (previousThicknessElement != null) {
previousThicknessElement.className = "";
}
previousThicknessElement = imgElement;
}
This code gets all the drawing setup out of the way, but this example still isn’t ready to run. The next (and final) step is to add the code that performs the actual drawing.
Drawing on the Canvas
Drawing begins when the user clicks down on the canvas with the mouse button. The paint program uses a global variable named isDrawing to keep track of when drawing is taking place, so the rest of the code knows whether it should be writing on the drawing context.
As you saw earlier, the onMouseDown event is linked to the startDrawing() function. It sets the isDrawing variable, creates a new path, and then moves to the starting position to get ready to draw something:
var isDrawing = false;
function startDrawing(e) {
// Start drawing.
isDrawing = true;
// Create a new path (with the current stroke color and stroke thickness).
context.beginPath();
// Put the pen down where the mouse is positioned.
context.moveTo(e.pageX - canvas.offsetLeft, e.pageY - canvas.offsetTop);
}
In order for the paint program to work properly, it needs to start drawing at the current position—that’s where the mouse is hovering when the user clicks down. However, getting the right coordinates for this point is a bit tricky.
The onMouseDown event provides coordinates (through the pageX and the pageY properties shown in this example), but these coordinates are relative to the whole page. To calculate the corresponding coordinate on the canvas, you need to subtract the distance between the top-left corner of the browser window and the top-left corner of the canvas.
The actual drawing happens while the user is moving the mouse. Every time the user moves the mouse, even just a single pixel, the onMouseMove event fires and the code in the draw() function runs. If isDrawing is set to true, then the code calculates the current canvas coordinate—where the mouse is right now—and then calls lineTo() to add a tiny line segment to the new position and stroke() to draw it:
function draw(e) {
if (isDrawing == true) {
// Find the new position of the mouse.
var x = e.pageX - canvas.offsetLeft;
var y = e.pageY - canvas.offsetTop;
// Draw a line to the new position.
context.lineTo(x, y);
context.stroke();
}
}
If the user keeps moving the mouse, the draw() function keeps getting called, and another short piece of line keeps getting added. This line is so short—probably just a pixel or two—that it doesn’t even look like a straight line when the user starts scribbling.
Finally, when the user releases the mouse button or moves the cursor off to the side, away from the canvas, the onMouseUp or onMouseOut events fire. Both of these trigger the stopDrawing() function, which tells the application to stop drawing:
function stopDrawing() {
isDrawing = false;
}
So far, this code covers almost all there is to the simple paint program. The only missing details are the two buttons under the canvas, which offer to clear or save the current work. Click clear, and the clearCanvas() function blanks out the entire surface, using the drawing context’sclearRect() method:
function clearCanvas() {
context.clearRect(0, 0, canvas.width, canvas.height);
}
The save option is slightly more interesting, and you’ll consider it next.
Saving the Picture in the Canvas
When it comes to saving the picture in a canvas, there are countless options. First, you need to decide how you’re going to get the data. The canvas gives you three basic options:
§ Use a data URL. Converts the canvas to an image file and then converts that image data to a sequence of characters, formatted as a URL. This gives you a nice, portable way to pass the image data around (for example, you can hand it to an <img> element or send it off to the web server). The paint program uses this approach.
§ Use the getImageData() method. Grabs the raw pixel data, which you can then manipulate as you please. You’ll learn to use getImageData() on Hit Testing with Pixel Colors.
§ Store a list of “steps.” Lets you store, for example, an array that lists every line you drew on the canvas. Then you can save that data and use it to recreate the image later. This approach takes less storage space, and it gives you more flexibility to work with or edit the image later on. Unfortunately, it works only if you keep track of all the steps you’re taking, using a technique like the one you’ll see in the circle-drawing example (Keeping Track of What You’ve Drawn).
If that seems a bit intimidating, well, you’re not done quite yet. Once you decide what you want to save, you still need to decide where to save it. Here are some options for that:
§ In an image file. For example, you can let the web surfer save a PNG or JPEG on the computer. That’s the approach you’ll see next.
§ In the local storage system. You’ll learn how that works in Chapter 10.
§ On the web server. Once you transfer the data, the web server could store it in a file or a database and make it available the next time the web page user visits.
To make the save feature work in the paint program, the code uses a feature called data URLs. To get a URL for the current data, you simply use the canvas’s toDataURL() method:
var url = canvas.toDataURL();
When you call toDataURL() without supplying any arguments, you get a PNG-formatted picture. Alternatively, you can supply an image type to request that format instead:
var url = canvas.toDataURL("image/jpeg");
But if the browser is unable to honor your format request, it will still send you a PNG file, converted to a long string of letters.
At this point, you’re probably wondering what a data URL looks like. Technically, it’s a long string of base-64 encoded characters that starts with the text data:image/png;base64. It looks like gobbledygook, but that’s OK, because it’s supposed to be readable by computer programs (like browsers). Here’s a data URL for the current canvas picture:
data:image/png;base64,iVBORw0KGgoAAAANSUhEUgAAAfQAAAEsCAYAAAA1u0HIAAAAAXNSR
0IArs4c6QAAAARnQU1BAACxjwv8YQUAACqRSURBVHhe7Z1bkB1Hecdn5uxFFzA2FWOnsEEGiiew
nZgKsrWLrZXMRU9JgZQKhoSHVK...gAAEIQAACEIBAiAT+HxAYpeqDfKieAAAAAElFTkSuQmCC
This example leaves out a huge amount of the content in the middle (where the ellipsis is) to save space. If it was all left in, this data URL would fill five pages in this book.
NOTE
Base-64 encoding is a system that converts image data to a long string of characters, numbers, and a small set of special characters. It avoids punctuation and all the bizarre extended characters, so the resulting text is safe to stick in a web page (for example, to set the value of a hidden input field or the src attribute in an <img> element).
So, it’s easy to convert a canvas to image data in the form of a data URL. But once you have that data URL, what can you do with it? One option is to send it to the web server for long-term storage. You can see an example of a web page that does that, using a sprinkling of PHP script on the server, at http://tinyurl.com/5uud9ob.
If you want to keep your data on the client, your options are a bit more limited. Some browsers will let you navigate directly to a data URL. That means you can use code like the following to navigate to the image:
window.location = canvas.toDataURL();
A more reliable technique is to hand the data URL over to an <img> element. Here’s what the paint program does (Figure 8-12):
function saveCanvas() {
// Find the <img> element.
var imageCopy = document.getElementById("savedImageCopy");
// Show the canvas data in the image.
imageCopy.src = canvas.toDataURL();
// Unhide the <div> that holds the <img>, so the picture is now visible.
var imageContainer = document.getElementById("savedCopyContainer");
imageContainer.style.display = "block";
}
This code doesn’t exactly “save” the image data, because the image hasn’t yet been stored permanently, in a file. However, it takes just one more step to save the data once it’s in an image. The web page visitor simply needs to right-click the image and choose the Save command. This isn’t quite as convenient as a file download or the Save dialog box, but it’s the only client-side option that works reliably in all browsers.
NOTE
Firefox has the built-in ability to save canvas content. Just right-click any canvas (not the image copy) and choose Save Image As. Other browsers, like Chrome and Internet Explorer, don’t offer this option.
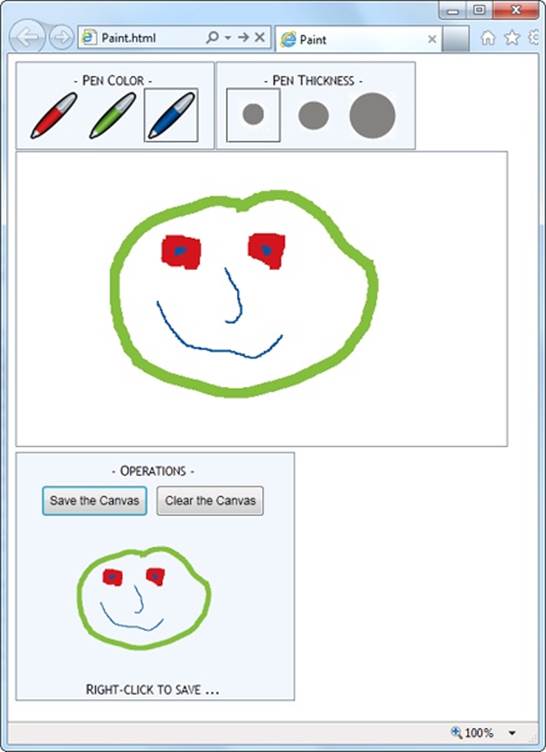
Figure 8-12. Here, the data URL is used to transmit information to an <img> element. The <img> element has been given a smaller size, to distinguish it from the main canvas. If you want to save this image as a respectable .png file, simply right-click the image and choose “Save picture as,” just as you would with any other picture in a web page.
NOTE
The data URL feature is one of several canvas features that may fail to work if you’re running a test page from your computer hard drive. To avoid problems, upload your work to a live web server for testing.
GEM IN THE ROUGH: CANVAS-BASED PAINT PROGRAMS
A paint program is one of the first examples that comes to mind when people start exercising their canvas-programming muscles. It’s thus no surprise that you can Google up many more paint program examples on the Web, including some ridiculously advanced versions. Here are two favorites:
§ iPaint (http://tinyurl.com/js-ipaint). This straightforward program looks like Microsoft Paint in a web browser. However, it adds at least one feature traditional Paint doesn’t—the ability to select and manipulate the objects in your picture after you’ve drawn them.
§ Sketchpad (http://mugtug.com/sketchpad). This amazingly tricked-out painting program has support for advanced illustration features like shape manipulation, marquee selection, textures, and even Spirograph drawing.
Browser Compatibility for the Canvas
You’ve come a long way with the canvas already. Now it’s time to step back and answer the question that hangs over every new HTML5 feature: When is it safe to use it?
Fortunately, the canvas is one of the better-supported parts of HTML5. The latest version of every mainstream browser supports it. Of course, the more up-to-date the browser, the better—later builds of these browsers improve the drawing speed of the canvas and remove occasional glitches.
You’re not likely to run into an old browser that doesn’t support the canvas, except for versions of Internet Explorer before IE 9. And that’s the clear issue that today’s canvas users will be thinking about: How can you put the canvas in your pages without locking out IE 8 and IE 7?
As with many HTML5 features, you have two compatibility choices. Your first option is to detect when canvas support is missing and try to fall back on a different approach. Your second option is to fill the gap with another tool that can simulate the HTML5 canvas, so your pages will work—as written—on old browsers. In the case of the canvas, the second approach is the surprise winner, as you’ll learn in the next section.
Polyfilling the Canvas with ExplorerCanvas
There are several solid workarounds that grant canvas-like abilities to aging copies of IE. The first is the ExplorerCanvas library (also called excanvas), by Google engineer and JavaScript genius Erik Arvidsson. It simulates the HTML5 canvas in Internet Explorer 7 or 8, using nothing but JavaScript and a now out-of-date technology called VML (Vector Markup Language).
NOTE
VML is a specification for creating line art and other illustrations using markup in an HTML document. It’s now been replaced by a similar, but better supported, standard called SVG (Scalable Vector Graphics), which browsers are just beginning to support. Today, VML still lingers in a few Microsoft products, like Microsoft Office and Internet Explorer. This makes it a reasonable substitute for the canvas, albeit with some limitations.
You can download ExplorerCanvas from http://code.google.com/p/explorercanvas. To use it, copy the excanvas.js file to the same folder as your web page, and add a script reference like this to your web page:
<head>
<title>...</title>
<!--[if lt IE 9]>
<script src="excanvas.js"></script>
<![endif]-->
...
<head>
Notice that this reference is conditional. Versions of Internet Explorer that are earlier than IE 9 will use it, but IE 9 and non-IE browsers will ignore the script altogether.
From this point, you can use the <canvas> without any serious headaches. For example, this change is all you need to get the basic paint program (shown on Building a Basic Paint Program) working in old versions of IE.
NOTE
If you plan to draw text on your canvas (a feature discussed on Drawing Text), you’ll also need the help of a second JavaScript library, called Canvas-text, which works in conjunction with ExplorerCanvas. You can download it from http://code.google.com/p/canvas-text.
Polyfilling the Canvas with FlashCanvas
Of course, the ExplorerCanvas isn’t perfect. If you use advanced features, you’ll probably run into something that doesn’t look right. The main features that aren’t supported in ExplorerCanvas include radial gradients, shadows, clipping regions, raw pixel processing, and data URLs. And although someone may update ExplorerCanvas in the future to add these features, it doesn’t seem likely—the current build of ExplorerCanvas is a few years old and the code hasn’t been touched in a while.
If you have really ambitious plans—for example, you’re planning to create complex animations or a side-scrolling game—you might find that ExplorerCanvas isn’t fast enough to keep up. In this situation, you can consider switching to a different polyfill that uses a high-performance browser plug-in like Silverlight or Flash. You can review all your options on GitHub’s polyfill page at http://tinyurl.com/polyfills. Or, go straight to one of the best: the free FlashCanvas library at http://code.google.com/p/flashcanvas. Like ExplorerCanvas, you can plug it into your page using a single line of JavaScript. But unlike ExplorerCanvas, it uses the Flash plug-in, without a trace of VML.
FlashCanvas also has a grown-up professional version called FlashCanvas Pro. It adds support for a few additional features, like global composite operations (Composite Operations) and shadows (Shadows and Fancy Fills).
FlashCanvas Pro is free for noncommercial use (get it at http://flashcanvas.net/download). Or, if you’re a business or an individual planning to make some money, you can buy FlashCanvas Pro for a small fee (currently $31) at http://flashcanvas.net/purchase. You can compare the canvas support of ExplorerCanvas, FlashCanvas, and FlashCanvas Pro at http://flashcanvas.net/docs/canvas-api.
Like ExplorerCanvas, the FlashCanvas project isn’t seeing much action these days. However, in its current state it remains a reliable choice for canvas support in old browsers. If you’re planning to create a truly ambitious canvas-powered site—for example, a real-time game—you’ll need to test out FlashCanvas to see if it supports everything you need to do.
NOTE
When you combine a canvas-powered page with a library like FlashCanvas, you get truly impressive support on virtually every browser known to humankind. Not only do you get support for slightly older versions of IE through Flash, but you also get support for Flash-free mobile devices like the iPad and iPhone through HTML5.
The Canvas Fallback and Feature Detection
The most popular way to extend the reach of pages that use the canvas is with ExplorerCanvas and FlashCanvas. However, they aren’t the only options.
The <canvas> element supports fallback content, just like the <audio> and <video> elements you explored in the last chapter. For example, you could apply this sort of markup to use the canvas (if it’s supported) or to display an image (if it isn’t):
<canvas id="logoCreator" width="500" height="300">
<p>The canvas isn't supported on your computer, so you can't use our
dynamic logo creator.</p>
<img src="logo.png" alt="Standard Company Logo">
</canvas>
This technique is rarely much help. Most of the time, you’ll use the canvas to draw dynamic graphics or to create some sort of interactive graphical application, and a fixed graphic just can’t compensate. One alternative is to place a Flash application inside the <canvas> element. This approach is especially good if you already have a Flash version of your work but you’re moving to the canvas for future development. It lets you offer a working Flash-based solution to old versions of IE, while letting everyone else use the plug-in-free canvas.
If you’re using Modernizr (Feature Detection with Modernizr), you can test for canvas support in your JavaScript code. Just test the Modernizr.canvas property, and check the Modernizr.canvastext property to look for the canvas’s text-drawing feature (which was a later addition to the canvas drawing model). If you don’t detect canvas support in the current browser, then you can use any workaround you’d like.
FREQUENTLY ASKED QUESTION: CANVAS ACCESSIBILITY
Is it possible to make the canvas more accessible?
One of the key themes of HTML5, the semantic elements, and the past few chapters is accessibility—designing a page that provides information to assistive software, so it can help people with disabilities use your website. After all this emphasis, it may come as a shock that one of HTML5’s premier new features has no semantics or accessibility model at all.
The creators of HTML5 are working to patch the hole. However, no one is quite certain of the best solution. One proposal is to create a separate document model for assistive devices, which would then mirror the canvas content. The problem here is that it’s up to the author to keep this “shadow” model in sync with the visuals, and lazy or overworked developers are likely to pass on this responsibility if it’s at all complicated.
A second proposal is to extend image maps (an existing HTML feature that divides pictures into clickable regions) so they act as a layer over the top of the canvas. Because an image map is essentially a group of links, it could hold important information for assistive software to read and report to the user.
Currently, there’s no point in thinking too much about either of these ideas, because they’re both still being debated. In the meantime, it makes sense to use the canvas for a variety of graphical tasks, like arcade games (most of which can’t practically be made accessible) and data visualization (as long as you have the data available in text form elsewhere on the page). However, the canvas isn’t a good choice for an all-purpose page design element. So if you’re planning to use the canvas to create a fancy heading or a menu for your website, hold off for now.