HTML5: The Missing Manual Matthew MacDonald (2013)
Part 2. Video, Graphics, and Glitz
Chapter 9. Advanced Canvas: Interactivity and Animation
The canvas is a huge, sprawling feature. In the previous chapter, you learned how to draw line art and even create a respectable drawing program in a few dozen lines of JavaScript. But the canvas has more up its sleeve than that. Not only can it show dynamic pictures and host paint programs, but it can also play animations, process images with pixel-perfect control, and run interactive games. In this chapter, you’ll learn the practical beginnings for all these tasks.
First, you’ll start by looking at drawing context methods that let you paint different types of content on a canvas, including images and text. Next, you’ll learn how to add some graphical pizzazz with shadows, patterned fills, and gradients. Finally, you’ll learn practical techniques to make your canvas interactive and to host live animations. Best of all, you can build all of these examples with nothing more than ordinary JavaScript and raw ambition.
NOTE
For the first half of this chapter, you’ll focus on small snippets of drawing code. You can incorporate this code into your own pages, but you’ll need to first add a <canvas> element to your page and create a drawing context, as you learned on Getting Started with the Canvas. In the second half of this chapter, you’ll look at much more ambitious examples. Although you’ll see most (or all) of the canvas-drawing code that these examples use, you won’t get every page detail. To try out the examples for yourself, visit the try-out site at http://prosetech.com/html5.
Other Things You Can Draw on the Canvas
Using the canvas, you can painstakingly recreate any drawing you want, from a bunch of lines and triangles to a carefully shaded portrait. But as the complexity of your drawing increases, so does the code. It’s extremely unlikely that you’d write by hand all the code you need to create a finely detailed picture.
Fortunately, you have other options. The drawing context isn’t limited to lines and curves—it also has methods that let you slap down pre-existing images, text, patterns, and even video frames. In the following sections, you’ll learn how to use these methods to get more content on your canvas.
Drawing Images
You’ve probably seen web pages that build maps out of satellite images, downloaded and stitched together. That’s an example of how you can take images you already have and combine them to get the final image that you want.
The canvas supports ordinary image data through the drawing context’s logically named drawImage() method. To put an image in your canvas, you call drawImage() and pass in an image object and your coordinates, like this:
context.drawImage(img, 10, 10);
But before you can call drawImage(), you need the image object. HTML5 gives you three ways to get it. First, you can build it yourself out of raw pixels, one pixel at a time, using createImageData(). This approach is tedious and slow (although you’ll learn more about per-pixel manipulation on Hit Testing with Pixel Colors).
Your second option is to use an <img> element that’s already on your page. For example, if you have this markup:
<img id="arrow_left" src="arrow_left.png">
You can copy that picture onto the canvas with this code:
var img = document.getElementById("arrow_left");
context.drawImage(img, 10, 10);
The third way that you can get an image for use with drawImage() is by creating an image object and loading an image picture from a separate file. The disadvantage to this approach is that you can’t use your image with drawImage() until that picture has been completely downloaded. To prevent problems, you need to wait until the image’s onLoad event occurs before you do anything with the image.
To understand this pattern, it helps to look at an example. Imagine you have an image named maze.png that you want to display on a canvas. Conceptually, you want to take this series of steps:
// Create the image object.
var img = new Image();
// Load the image file.
img.src = "maze.png";
// Draw the image. (This could fail, because the picture
// might not be downloaded yet.)
context.drawImage(img, 0, 0);
The problem here is that setting the src attribute starts an image download, but your code carries on without waiting for it to finish. The proper way to arrange this code is like this:
// Create the image object.
var img = new Image();
// Attach a function to the onload event.
// This tells the browser what to do after the image is loaded.
img.onload = function() {
context.drawImage(img, 0, 0);
};
// Load the image file.
img.src = "maze.png";
This may seem counterintuitive, since the order in which the code is listed doesn’t match the order in which it will be executed. In this example, the context.drawImage() call happens last, shortly after the img.src property is set.
Images have a wide range of uses. You can use them to add embellishments to your line drawings, or as a shortcut to avoid drawing by hand. In a game, you can use images for different objects and characters, positioned appropriately on the canvas. And fancy paint programs use them instead of basic line segments so the user can draw “textured” lines. You’ll see some practical examples that use image drawing in this chapter.
TROUBLESHOOTING MOMENT: MY PICTURES ARE SQUASHED!
If you attempt to draw a picture and find that it’s inexplicably stretched, squashed, or otherwise distorted, the most likely culprit is a style sheet rule.
The proper way to size the canvas is to use its height and width attributes in your HTML markup. You might think you could remove these in your markup, leaving a tag like this:
<canvas></canvas>
And replace them with a style sheet rule that targets your canvas, like this one:
canvas {
height: 300px;
width: 500px;
}
But this doesn’t work. The problem is that the CSS height and width properties aren’t the same as the canvas height and width properties. If you make this mistake, what actually happens is that the canvas gets its default size (300 x 150 pixels). Then, the CSS size properties stretch or squash the canvas to fit, causing it to resize its contents accordingly. As a result, when you put an image on the canvas, it’s squashed too, which is decidedly unappealing.
To avoid this problem, always specify the canvas size using its height and width attributes. And if you need a way to change the size of the canvas based on something else, use a bit of JavaScript code to change the <canvas> element’s height and width when needed.
Slicing, Dicing, and Resizing an Image
The drawImage() function accepts a few optional arguments that let you alter the way your image is painted on the canvas. First, if you want to resize the image, you can tack on the width and height you want, like this:
context.drawImage(img, 10, 10, 30, 30);
This function makes a 30 x 30 pixel box for the image, with the top-left corner at point (10,10). Assuming the image is naturally 60 x 60 pixels, this operation squashes it by half in both dimensions, leaving it just a quarter as big as it would ordinarily be.
If you want to crop a piece out of the picture, you can supply the four extra arguments to drawImage() at the beginning of the argument list. These four points define the position and size of the rectangle you want to cut out of the picture, as shown here:
context.drawImage(img, source_x, source_y, source_width, source_height, x, y,
width, height);
The last four arguments are the same as in the previous example—they define the position and size that the cropped picture should have on the canvas.
For example, imagine you have a 200 x 200 pixel image and you want to paint just the top half. To do that, you create a box that starts at point (0,0) and has a width of 200 and a height of 100. You can then draw it on the canvas at point (75,25), using this code:
context.drawImage(img, 0, 0, 200, 100, 75, 25, 200, 100);
Figure 9-1 shows exactly what’s happening in this example.
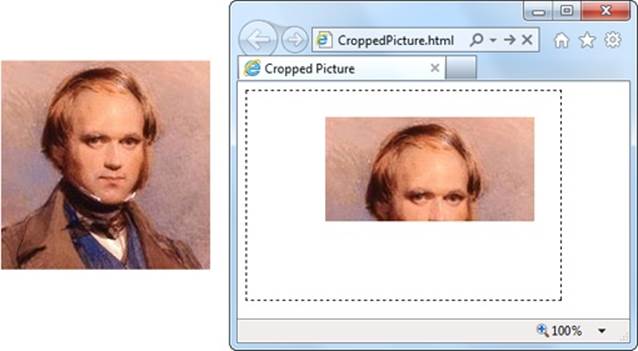
Figure 9-1. Left: The original source image. Right: A cropped portion of the source image, on the canvas.
If you want to do more—for example, skew or rotate an image before you draw it, the drawImage() method can’t keep up. However, you can use transforms to alter the way you draw anything and everything, as explained on Transforms.
GEM IN THE ROUGH: DRAWING A VIDEO FRAME
The first parameter of the drawImage() method is the image you want to draw. As you’ve seen, this can be an Image object you’ve just created, or an <img> element that’s elsewhere on the page.
But that’s not the whole story. HTML5 actually allows two more substitutions. Instead of an image, you can throw in a complete <canvas> element (not the one you’re drawing on). Or, you can use a currently playing <video> element, with no extra work:
var video =
document.getElementById("videoPlayer");
context.drawImage(video, 0, 0,
video.clientWidth, video.clientWidth);
When this code runs, it grabs a single frame of video—the frame that’s being played at the very instant the code runs. It then paints that picture onto the canvas.
This ability opens the door to a number of interesting effects. For example, you can use a timer to grab new video frames while playback is under way and keep painting them on a canvas. If you do this fast enough, the copied sequence of images on the canvas will look like another video player.
To get more exotic, you can change something about the copied video frame before you paint it. For example, you could scale it larger or smaller, or dip into the raw pixels and apply a Photoshop-style effect. For an example, read the article at http://html5doctor.com/video-canvas-magic. It shows how you can play a video in grayscale simply by taking regular snapshots of the real video and converting each pixel in each frame to a color-free shade of gray.
Drawing Text
Text is another thing that you wouldn’t want to assemble yourself out of lines and curves. And the HTML5 canvas doesn’t expect you to. Instead, it includes two drawing context methods that can do the job.
First, before you draw any text, you need to set the drawing context’s font property. You use a string that uses the same syntax as the all-in-one CSS font property. At a bare minimum, you must supply the font size, in pixels, and the font name, like this:
context.font = "20px Arial";
You can supply a list of font names, if you’re not sure that your font is supported:
context.font = "20px Verdana,sans-serif";
And optionally, you can add italics or bold at the beginning of the string, like this:
context.font = "bold 20px Arial";
You can also use a fancy web font, courtesy of CSS3. All you need to do is register the font name first, using a style sheet (as described on Web Fonts).
Once the font is in place, you can use the fillText() method to draw your text. Here’s an example that puts the top-left corner of the text at the point (10,10):
context.textBaseline = "top";
context.fillStyle = "black";
context.fillText("I'm stuck in a canvas. Someone let me out!", 10, 10);
You can put the text wherever you want, but you’re limited to a single line. If you want to draw multiple lines of text, you need to call fillText() multiple times.
TIP
If you want to divide a solid paragraph over multiple lines, you can create your own word wrapping algorithm. The basic idea is this: Split your sentence into words, and see how many words fit in each line using the drawing context’s measureText() method. It’s tedious to do, but the sample code at http://tinyurl.com/6ec7hld can get you started.
Instead of using fillText(), you can use the other text-drawing method, strokeText(). It draws an outline around your text, using the strokeStyle property for its color and the lineWidth property for its thickness. Here’s an example:
context.font = "bold 40px Verdana,sans-serif";
context.lineWidth = "1";
context.strokeStyle = "red";
context.strokeText("I'm an OUTLINE", 20, 50);
When you use strokeText(), the middle of the text stays blank. Of course, you can use fillText() followed by strokeText() if you want colored, outlined text. Figure 9-2 shows both pieces of text in a canvas.
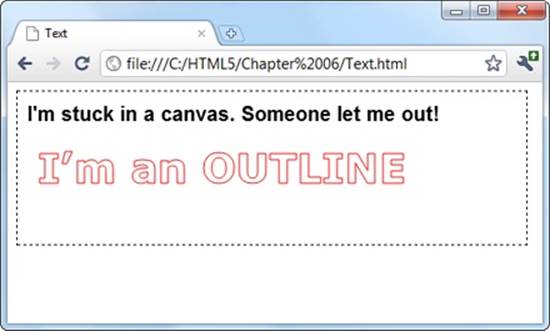
Figure 9-2. The canvas makes it easy to draw solid text and outlined text.
TIP
Drawing text is much slower than drawing lines and images. The speed isn’t important if you’re creating a static, unchanging image (like a chart), but it may be an issue if you’re creating an interactive, animated application. If you need to optimize performance, you may find that it’s better to save your text in an image file and then draw it on the canvas with drawImage().
Shadows and Fancy Fills
So far, when you’ve drawn lines and filled shapes on the canvas, you’ve used solid colors. And while there’s certainly nothing wrong with that, ambitious painters will be happy to hear that the canvas has a few fancier drawing techniques. For example, the canvas can draw an artfully blurred shadow behind any shape. Or, it can fill a shape by tiling a small graphic across its surface. But the canvas’s fanciest painting frill is gradients, which you can use to blend two or more colors into a kaleidoscope of patterns.
In the following sections, you’ll learn to use all these features, simply by setting different properties in the canvas’s drawing context.
Adding Shadows
One handy canvas feature is the ability to add a shadow behind anything you draw. Figure 9-3 shows some snazzy shadow examples.
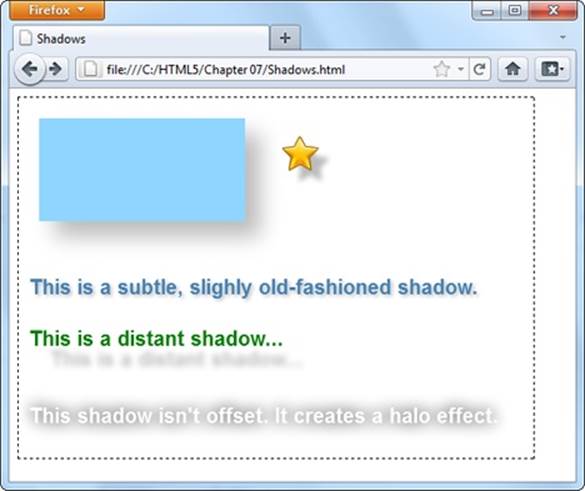
Figure 9-3. Shadows work equally well with shapes, images, and text. One nifty feature is the way that shadows work with images that have transparent backgrounds, like the star at the top right corner of this page. As you can see, the shadow follows the outline of the star shape, not the square box that delineates the entire image. (At the time of this writing, only Internet Explorer and Firefox support this feature.) Shadows also pair nicely with text, so you can create a range of different effects, depending on the shadow settings you pick.
Essentially, a shadow looks like a blurry version of what you would ordinarily draw (lines, shapes, images, or text). You control the appearance of shadows using several drawing context properties, as outlined in Table 9-1.
Table 9-1. Properties for creating shadows
|
PROPERTY |
DESCRIPTION |
|
shadowColor |
Sets the shadow’s color. You could go with black or a tinted color, but a nice midrange gray is generally best. Another good technique is to use a semitransparent color (Transparency) so the content that’s underneath still shows through. When you want to turn shadows off, set shadowColor back to transparent. |
|
shadowBlur |
Sets the shadow’s “fuzziness.” A shadowBlur of 0 creates a crisp shadow that looks just like a silhouette of the original shape. By comparison, a shadowBlur of 20 is a blurry haze, and you can go higher still. Most people agree that some fuzz (a blur of at least 3) looks best. |
|
shadowOffsetX and shadowOffsetY |
Positions the shadow relative to the content. For example, set both properties to 5, and the shadow will be bumped 5 pixels to the right and 5 pixels down from the original content. You can also use negative numbers to move the shadow the other way (left and up). |
The following code creates the assorted shadows shown in Figure 9-3:
// Draw the shadowed rectangle.
context.rect(20, 20, 200, 100);
context.fillStyle = "#8ED6FF";
context.shadowColor = "#bbbbbb";
context.shadowBlur = 20;
context.shadowOffsetX = 15;
context.shadowOffsetY = 15;
context.fill();
// Draw the shadowed star.
context.shadowOffsetX = 10;
context.shadowOffsetY = 10;
context.shadowBlur = 4;
img = document.getElementById("star");
context.drawImage(img, 250, 30);
context.textBaseline = "top";
context.font = "bold 20px Arial";
// Draw three pieces of shadowed text.
context.shadowBlur = 3;
context.shadowOffsetX = 2;
context.shadowOffsetY = 2;
context.fillStyle = "steelblue";
context.fillText("This is a subtle, slightly old-fashioned shadow.", 10, 175);
context.shadowBlur = 5;
context.shadowOffsetX = 20;
context.shadowOffsetY = 20;
context.fillStyle = "green";
context.fillText("This is a distant shadow...", 10, 225);
context.shadowBlur = 15;
context.shadowOffsetX = 0;
context.shadowOffsetY = 0;
context.shadowColor = "black";
context.fillStyle = "white";
context.fillText("This shadow isn't offset. It creates a halo effect.", 10,
300);
Filling Shapes with Patterns
So far, you’ve filled the shapes you’ve drawn with solid or semitransparent colors. But the canvas also has a fancy fill feature that lets you slather the inside with a pattern or a gradient. Using these fancy fills is a sure way to jazz up plain shapes. Using a fancy fill is a two-step affair. First, you create the fill. Then, you attach it to the fillStyle property (or, occasionally, the strokeStyle property).
To make a pattern fill, you start by choosing a small image that you can tile seamlessly over a large area (see Figure 9-4). You need to load the picture you want to tile into an image object using one of the techniques you learned about earlier, such as putting a hidden <img> on your page (Drawing Images), or loading it from a file and handling the onLoad event of the <img> element (Drawing Images). This example uses the first approach:
var img = document.getElementById("brickTile");
Once you have your image, you can create a pattern object using the drawing context’s createPattern() method. At this point, you pick whether you want the pattern to repeat horizontally (repeat-x), vertically (repeat-y), or in both dimensions (repeat):
var pattern = context.createPattern(img, "repeat");
The final step is to use the pattern object to set the fillStyle or strokeStyle property:
context.fillStyle = pattern;
context.rect(0, 0, canvas.width, canvas.height);
context.fill();
This creates a rectangle that fills the canvas with the tiled image pattern, as shown in Figure 9-4.
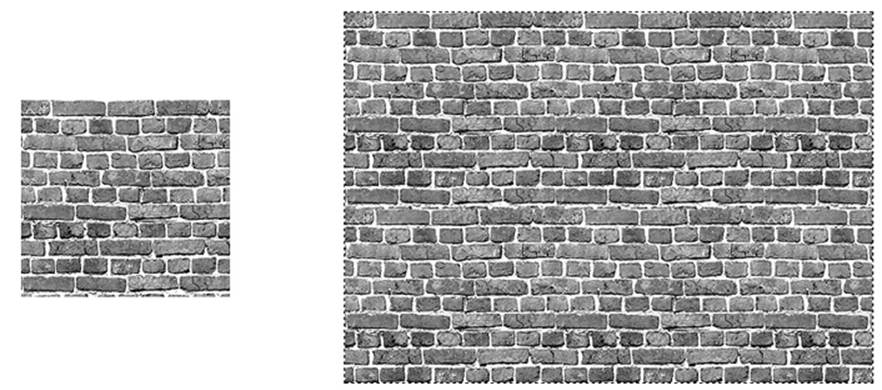
Figure 9-4. Left: An image that holds a single tile. Right: The pattern created by tiling the image over an entire canvas.
Filling Shapes with Gradients
The second type of fancy fill is a gradient, which blends two or more colors. The canvas supports linear gradients and radial gradients, and Figure 9-5 compares the two.
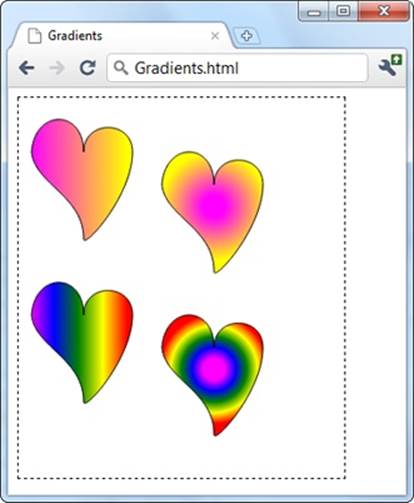
Figure 9-5. A linear gradient (top left) blends from one line of color to another. A radial gradient (top right) blends from one point of color to another. Both types support more than two colors, allowing you to create a banded effect with linear gradients (bottom left) or a ring effect with radial gradients (bottom right).
TIP
If you’re looking at these gradients in a black-and-white print copy of this book, give your head a shake and try out the examples at http://prosetech.com/html5, so you can see the wild colors for yourself. (The sample code also includes the drawing logic for the hearts, which stitches together four Bézier curves in a path.)
Unsurprisingly, the first step to using a gradient fill is creating the right type of gradient object. The drawing context has two methods that handle this task: createLinearGradient() and createRadialGradient(). Both work more or less the same way: They hold a list of colors that kick in at different points.
The easiest way to understand gradients is to start by looking at a simple example. Here’s the code that’s used to create the gradient for the top-left heart in Figure 9-5:
// Create a gradient from point (10,0) to (100,0).
var gradient = context.createLinearGradient(10, 0, 100, 0);
// Add two colors.
gradient.addColorStop(0, "magenta");
gradient.addColorStop(1, "yellow");
// Call another function to draw the shape.
drawHeart(60, 50);
// Paint the shape.
context.fillStyle = gradient;
context.fill();
context.stroke();
When you create a new linear gradient, you supply two points that represent the starting point and ending point of a line. This line is the path over which the color change takes place.
The gradient line is important, because it determines what the gradient looks like (see Figure 9-6). For example, consider a linear gradient that transitions from magenta to yellow. It could make this leap in a few pixels, or it could blend it out over the entire width of the canvas. Furthermore, the blend could be from left to right, top to bottom, or slanted somewhere in between. The line determines all these details.
TIP
Think of a gradient as a colorful design just under the surface of your canvas. When you create a gradient, you’re creating this colorful, but hidden, surface. When you fill a shape, you cut a hole that lets part of that gradient show through. The actual result—what you see in your canvas—depends on both the settings of your gradient and the size and position of your shape.
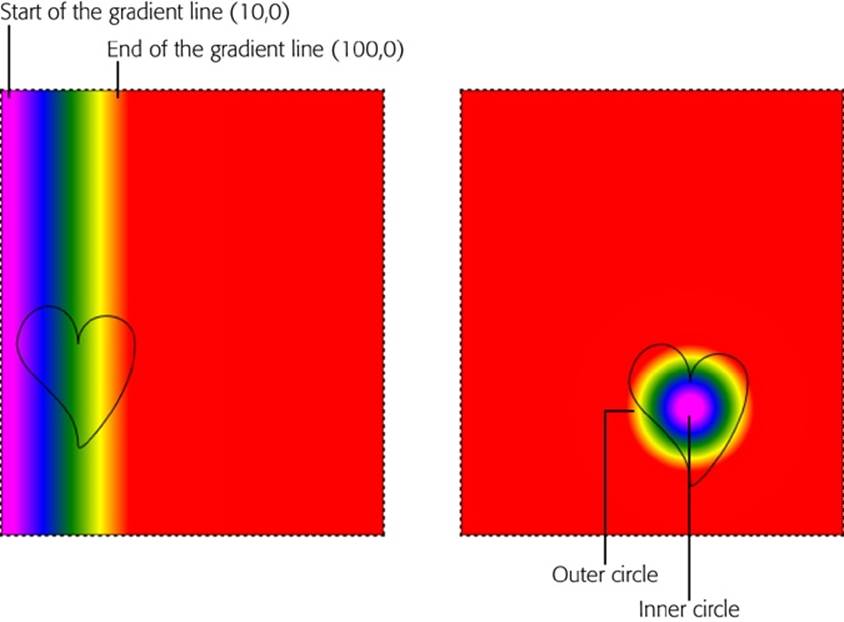
Figure 9-6. Left: Here’s the gradient generated for the bottom-left heart from Figure 9-5. When you use that gradient to fill a shape, you see just a portion of it. Right: The same is true for this radial gradient, which is used for the bottom-right heart in Figure 9-5.
In this example, the gradient line starts at point (10,0) and ends at point (100,0). These points tell you several important things:
§ The gradient is horizontal. That means it blends colors from left to right. You know this because the two points have the same y-coordinate. If, on the other hand, you wanted to blend from top to bottom, you could use points like (0,10) and (0,100). If you wanted it to stretch diagonally from top left to bottom right, you could use (10,10) and (100,100).
§ The actual color blend spans just 90 pixels (starting when the x-coordinate is 10 and ending when the x-coordinate is 100). In this example, the heart shape is just slightly smaller than the gradient dimensions, which means you see most of the gradient in the heart.
§ Beyond the limits of this gradient, the colors become solid. So if you make the heart wider, you’ll see more solid magenta (on the left) and solid yellow (on the right).
TIP
Often, you’ll create a gradient that’s just barely bigger than the shape you’re painting, as in this example. However, other approaches are possible. For example, if you want to paint several shapes using different parts of the same gradient, you might decide to create a gradient that covers the entire canvas.
To actually set the colors in a gradient, you call the gradient’s addColorStop() method. Each time you do, you supply an offset from 0 to 1, which sets where the color appears in the blend. A value of 0 means the color appears at the very start of the gradient, while a value of 1 puts the color at the very end. Change these numbers (for example, to 0.2 and 0.8), and you can compress the gradient, exposing more solid color on either side.
When you create a two-color gradient, 0 and 1 make most sense for your offsets. But when you create a gradient with more colors, you can choose different offsets to stretch out some bands of colors while compressing others. The bottom-left heart in Figure 9-5 splits its offsets evenly, giving each color an equal-sized band:
var gradient = context.createLinearGradient(10, 0, 100, 0);
gradient.addColorStop("0", "magenta");
gradient.addColorStop(".25", "blue");
gradient.addColorStop(".50", "green");
gradient.addColorStop(".75", "yellow");
gradient.addColorStop("1.0", "red");
drawHeart(60, 200);
context.fillStyle = gradient;
context.fill();
context.stroke();
NOTE
If the room is starting to revolve around you, don’t panic. After all, you don’t need to understand everything that happens in a gradient. You can always just tweak the numbers until an appealing blend of colors appears in your shape.
You use the same process to create a radial gradient as you do to create a linear one. But instead of supplying two points, you must define two circles. That’s because a radial gradient is a blend of color that radiates out from a small circle to a larger, containing circle. To define each of these circles, you supply the center point and radius.
In the radial gradient example shown in the top right of Figure 9-5, the colors blend from a center point inside the heart, at (180,100). The inner color is represented by a 10-pixel circle, and the outer color is a 50-pixel circle. Once again, if you go beyond these limits, you get solid colors, giving the radial gradient a solid magenta core and solid yellow surroundings. Here’s the code that draws the two-color radial gradient:
var gradient = context.createRadialGradient(180, 100, 10, 180, 100, 50);
gradient.addColorStop(0, "magenta");
gradient.addColorStop(1, "yellow");
drawHeart(180, 80);
context.fillStyle = gradient;
context.fill();
context.stroke();
NOTE
Most often, you’ll choose the same center point for both the inner and outer circles. However, you could offset one from the other, which can stretch, squash, and distort the blend of colors in interesting ways.
Using this example, you can create the final, multicolored radial gradient that’s in the bottom-right corner of Figure 9-5. You simply need to move the center point of the circles to the location of the heart and add a different set of color stops—the same ones that you used for the multicolored linear gradient:
var gradient = context.createRadialGradient(180, 250, 10, 180, 250, 50);
gradient.addColorStop("0","magenta");
gradient.addColorStop(".25","blue");
gradient.addColorStop(".50","green");
gradient.addColorStop(".75","yellow");
gradient.addColorStop("1.0","red");
drawHeart(180, 230);
context.fillStyle = gradient;
context.fill();
context.stroke();
Now you have the smarts to create more psychedelic patterns than a 1960s revival party.
Putting It Together: Drawing a Graph
Now that you’ve slogged your way through the better part of the canvas’s drawing features, it’s time to pause and enjoy the fruits of your labor. In the following example, you’ll take some humdrum text and numbers and use the canvas to create simple, standout charts.
Figure 9-7 shows the starting point: a two-page personality test that’s light on graphics. The user answers the questions on the first page and then clicks Get Score to move to the second page. The second page reports the personality scores according to the infamous five-factor personality model (see the box on How to Convert One Personality into Five Numbers).
The JavaScript code that makes this example work is pretty straightforward. When the user clicks a number button, its background is changed to indicate the user’s choice. When the user completes the quiz, a simple algorithm runs the answers through a set of scoring formulas to calculate the five personality factors. If you want to examine this code or to take the test, visit the try-out site at http://prosetech.com/html5.
So far, there’s no HTML5 magic. But consider how you could improve this two-page personality test by graphing the personality scores so that each factor is shown visually. Figure 9-8 shows the revamped version of the personality test results page, which uses this technique.

Figure 9-7. Click your way through the questions (top), and then review the scores (bottom). Unfortunately, without a scale or any kind of visual aid, it’s difficult for ordinary people to tell what these numbers are supposed to mean.
UP TO SPEED: HOW TO CONVERT ONE PERSONALITY INTO FIVE NUMBERS
This five-factor personality test ranks you according to five personality “ingredients,” which are usually called openness, conscientiousness, extraversion, agreeableness, and neuroticism. These factors were cooked up when researchers analyzed the thousands of personality-describing adjectives in the English language.
To pick just five factors, psychologists used a combination of hard-core statistics, personality surveys, and a computer. They identified which adjectives people tend to tick off together and used that to distill the smallest set of personality super-traits. For example, people who describe themselves as outgoing usually also describe themselves as social and gregarious, so it makes sense to combine all these traits into a single personality factor (which psychologists call extraversion). By the time the researchers had finished chewing through their set of nearly 20,000 adjectives, they had managed to boil them down to five closely interrelated factors.
You can learn more about the five-factor personality model at http://tinyurl.com/big-five-p, or in the book Your Brain: The Missing Manual (by this author).
To show these charts, the page uses five separate canvases, one for each personality factor. Here’s the markup:
<header>
<h1>Five Factor Personality Test</h1>
<p>The Results</p>
</header>
<div class="score">
<h2 id="headingE">Extraversion: </h2>
<canvas id="canvasE" height="75" width="550"></canvas>
</div>
<div class="score">
<h2 id="headingA">Accommodation: </h2>
<canvas id="canvasA" height="75" width="550"></canvas>
</div>
<div class="score">
<h2 id="headingC">Conscientiousness: </h2>
<canvas id="canvasC" height="75" width="550"></canvas>
</div>
<div class="score">
<h2 id="headingN">Neuroticism: </h2>
<canvas id="canvasN" height="75" width="550"></canvas>
</div>
<div class="score">
<h2 id="headingO">Openness: </h2>
<canvas id="canvasO" height="75" width="550"></canvas>
</div>
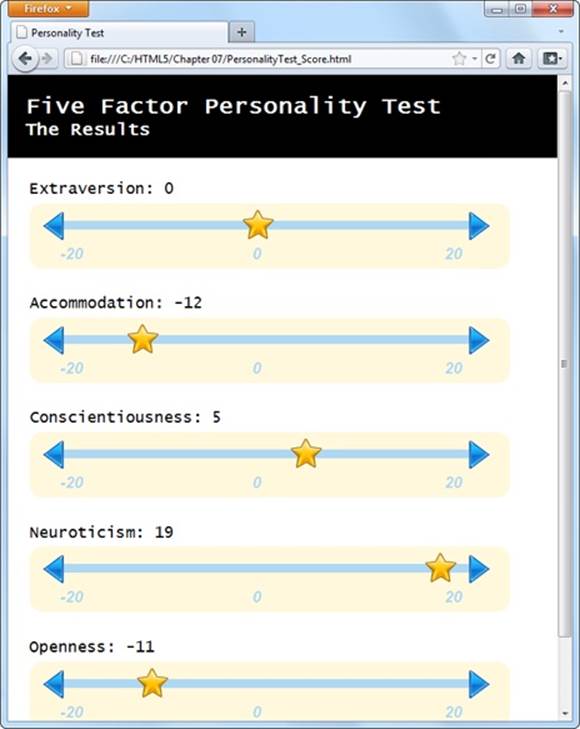
Figure 9-8. This page combines several different types of canvas drawing, including lines, images, and text. But the most interesting part of it is the way it dynamically draws these simple graphs, based on your answers in the personality quiz.
Each chart is drawn by the same custom JavaScript function, named plotScore(). The page calls this function five times, using different arguments each time. For example, to draw the extraversion chart at the top of the page, the code passes the topmost canvas element, the extraversion score (as a number from -20 to 20), and the text title (“Extraversion”):
window.onload = function() {
...
// Get the <canvas> element for the extraversion score.
var canvasE = document.getElementById("canvasE");
// Add the score number to the corresponding heading.
// (The score is stored in a variable named extraversion.)
document.getElementById("headingE").innerHTML += extraversion;
// Plot the score in the corresponding canvas.
plotScore(canvasE, extraversion, "Extraversion");
...
}
The plotScore() function runs through a bit of drawing code that will seem familiar to you by now. It uses the various drawing context methods to draw the different parts of the score graph:
function plotScore(canvas, score, title) {
var context = canvas.getContext("2d");
// Draw the arrows on the side of the chart line.
var img = document.getElementById("arrow_left");
context.drawImage(img, 12, 10);
img = document.getElementById("arrow_right");
context.drawImage(img, 498, 10);
// Draw the line between the arrows.
context.moveTo(39, 25);
context.lineTo(503, 25);
context.lineWidth = 10;
context.strokeStyle = "rgb(174,215,244)";
context.stroke();
// Write the numbers on the scale.
context.fillStyle = context.strokeStyle;
context.font = "italic bold 18px Arial";
context.textBaseline = "top";
context.fillText("-20", 35, 50);
context.fillText("0", 255, 50);
context.fillText("20", 475, 50);
// Add the star to show where the score ranks on the chart.
img = document.getElementById("star");
context.drawImage(img, (score+20)/40*440+35-17, 0);
}
The most important bit is the final line, which plots the star at the right position using this slightly messy equation:
context.drawImage(img, (score+20)/40*440+35-17, 0);
Here’s how it works. The first step is to convert the score into a percentage from 0 to 100 percent. Ordinarily, the score falls between -20 and 20, so the first operation the code needs to carry out is to change it to a value from 0 to 40:
score+20
You can then divide that number by 40 to get the percentage:
(score+20)/40
Once you have the percentage, you need to multiply it by the length of the line. That way, 0 percent ends up at the far left side, while 100 percent ends up at the opposite end, and everything else falls somewhere in between:
(score+20)/40*440
This code would work fine if the line stretched from the x-coordinate 0 to the x-coordinate 400. But in reality the line is offset a bit from the left edge, to give it a bit of padding. You need to offset the star by the same amount:
(score+20)/40*440+35
But this lines the left edge of the start up with the proper position, when really you want to line up its midpoint. To correct this issue, you need to subtract an amount that’s roughly equal to half the start’s width:
(score+20)/40*440+35-17
This gives you the final x-coordinate for the star, based on the score.
NOTE
It’s a small jump to move from fixed drawings to dynamic graphics like the ones in this example, which tailor themselves according to the latest data. But once you’ve made this step, you can apply your skills to build all sorts of interesting data-driven graphics, from traditional pie charts to infographics that use dials and meters. And if you’re looking for a way to simplify the task, check out one of the canvas graphic libraries, which include pre-written JavaScript routines for drawing common types of graphs based on your data. Two good examples are RGraph (www.rgraph.net) and ZingChart (www.zingchart.com).
Making Your Shapes Interactive
The canvas is a non-retained painting surface. That means that the canvas doesn’t keep track of what drawing operations you’ve performed. Instead, it just keeps the final result—the grid of colored pixels that makes up your picture.
For example, if you draw a red square in the middle of your canvas, the moment you call stroke() or fill(), that square becomes nothing more than a block of red pixels. It may look like a square, but the canvas has no memory of its squareness.
This model makes drawing fast. However, it also makes life difficult if you want to add interactivity to your drawing. For example, imagine you want to create a smarter version of the painting program you saw on Building a Basic Paint Program. You want people to be able to not only draw a line, but also draw a rectangle. (That part’s easy.) And you want people to be able to not only draw a rectangle, but also select it, drag it to a new place, resize it, change its color, and so on. Before you can give them all that power, you need to deal with several complications. First, how do you know if someone has clicked on the rectangle? Second, how do you know the details about the rectangle—its coordinates, size, stroke color, and fill color? And third, how do you know the details about every other shape on the canvas—which you’ll need to know if you need to change the rectangle and repaint the canvas?
To solve these problems and make your canvas interactive, you need to keep track of every object you paint. Then, when users click somewhere, you need to check whether they’re clicking one of the shapes (a process known as hit testing). If you can tackle these two tasks, the rest—changing one of your shapes and repainting the canvas—is easy.
Keeping Track of What You’ve Drawn
In order to be able to change and repaint your picture, you need to know everything about its contents. For example, consider the circle-drawing program shown in Figure 9-9. To keep things simple, it consists entirely of separately sized, differently colored circles.
To keep track of an individual circle, you need to know its position, radius, and fill color. Rather than create dozens of variables to store all this information, it makes sense to put all four details in a small package. That package is a custom object.
If you haven’t created a custom object before, here’s the standard technique. First, you create a function that’s named after your type of object. For example, if you want to build a custom object for a circle creation, you might name the function Circle(), like this:
function Circle() {
}
Next, you need your object to store some data. You do that by using a keyword named this to create properties. For example, if you want to give your circle object a property named radius, so you can keep track of its size, you would assign a starting value to this.radius inside theCircle() function.
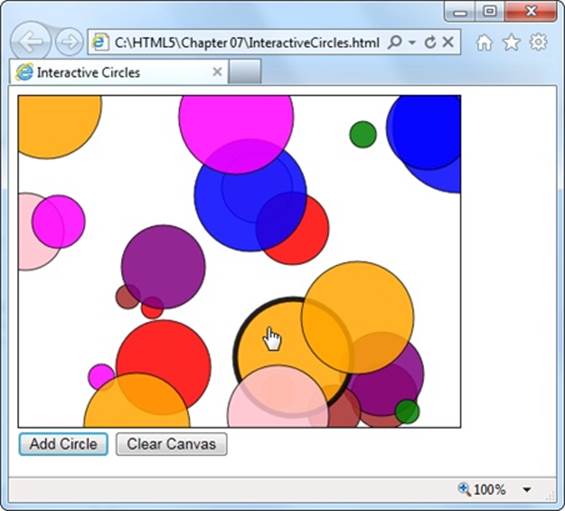
Figure 9-9. This circle-drawing program is interactive. You can click to select a circle (at which point it becomes highlighted with a different border color) and drag it to a new position.
Here’s a function that defines a circle with three details: the x- and y-coordinates, and the radius of the circle:
function Circle() {
this.x = 0;
thix.y = 0;
this.radius = 15;
}
The numbers you set in the Circle() function are just default values. When you use the function to create a new circle object, you can change each property value.
Once you’ve added all the properties you need, you’re ready to use your function to create live objects. In this case, that means using the Circle() function to create a new circle object. The trick is that you don’t want to call the function—instead, you want to create a new copy of it with thenew keyword. Here’s an example:
// Create a new circle object, and store it in a variable named myCircle.
var myCircle = new Circle();
Once you have a live circle object, you can access all the circle details as properties:
// Change the radius.
myCircle.radius = 20;
If you want to get a bit fancier, you can pass arguments to the Circle() function. That way, you can create a circle object and set all the circle properties in one step. Here’s the version of the Circle() function that’s used for the page in Figure 9-9:
function Circle(x, y, radius, color) {
this.x = x;
this.y = y;
this.radius = radius;
this.color = color;
this.isSelected = false;
}
The isSelected property takes a true or false value. When someone clicks the circle, isSelected is set to true, and then the drawing code knows to paint a different border around it.
Using this version of the Circle() function, you can use code like this to create a circle object:
var myCircle = new Circle(0, 0, 20, "red");
Of course, the whole point of the circle-drawing program is to let people draw as many circles as they want. That means just one circle object won’t do. Instead, you need to create an array that can hold all the circles. Here’s the global variable that makes this work in the current example:
var circles = [];
The rest of the code is easy. When someone clicks the Add Circle button to create a new circle, it triggers the addRandomCircle() function. The addRandomCircle() function creates a new circle with a random size, color, and position:
function addRandomCircle() {
// Give the circle a random size and position.
var radius = randomFromTo(10, 60);
var x = randomFromTo(0, canvas.width);
var y = randomFromTo(0, canvas.height);
// Give the circle a random color.
var colors = ["green", "blue", "red", "yellow", "magenta",
"orange", "brown", "purple", "pink"];
var color = colors[randomFromTo(0, 8)];
// Create the new circle.
var circle = new Circle(x, y, radius, color);
// Store it in the array.
circles.push(circle);
// Redraw the canvas.
drawCircles();
}
This code makes use of a custom function named randomFromTo(), which generates random numbers in a set range.
(To play with the full code, visit http://prosetech.com/html5.)
The final step in this sequence is actually painting the canvas, based on the current collection of circles. After a new circle is created, the addRandomCircle() function calls another function, named drawCircles(), to do the job. The drawCircles() function moves through the array of circles, using this loop:
for(var i=0; i<circles.length; i++) {
var circle = circles[i];
...
}
This code uses the trusty for loop (which is described in Appendix B). The block of code in the braces runs once for each circle. The first line of code grabs the current circle and stores it in a variable, so it’s easy to work with.
Here’s the complete drawCircles() function, which fills the canvas with the current collection of circles:
function drawCircles() {
// Clear the canvas and prepare to draw.
context.clearRect(0, 0, canvas.width, canvas.height);
context.globalAlpha = 0.85;
context.strokeStyle = "black";
// Go through all the circles.
for(var i=0; i<circles.length; i++) {
var circle = circles[i];
// Draw the circle.
context.beginPath();
context.arc(circle.x, circle.y, circle.radius, 0, Math.PI*2);
context.fillStyle = circle.color;
context.fill();
context.stroke();
}
}
NOTE
Each time the circle-drawing program refreshes the display, it starts by clearing everything away with the clearRect() method. Paranoid programmers might worry that this step would cause a flicker, as the canvas goes blank and the circles disappear, then reappear. However, the canvas is optimized to prevent this problem. It doesn’t actually clear or paint anything until all your drawing logic has finished, at which point it copies the final product to the canvas in one smooth step.
Right now, the circles still aren’t interactive. However, the page has the all-important plumbing that keeps track of every circle that’s drawn. Although the canvas is still just a block of colored pixels, the code knows the precise combination of circles that creates the canvas—and that means it can manipulate those circles at any time.
In the next section, you’ll see how you can use this system to let the user select a circle.
Hit Testing with Coordinates
If you’re creating interactive shapes, you’ll almost certainly need to use hit testing, a technique that checks whether a given point has “hit” another shape. In the circle-drawing program, you want to check whether the user’s click has hit upon a circle or just empty space.
More sophisticated animation frameworks (like those provided by Flash and Silverlight) handle hit testing for you. And there are add-on JavaScript libraries for the canvas (like KineticJS) that aim to offer the same conveniences, but none is mature enough to recommend without reservations. So the best bet is for canvas fans to start by learning to write their own hit testing logic. (After you’ve done that, you can consider pumping up the canvas with one of the JavaScript libraries discussed in the box on Canvas Animations for Busy (or Lazy) People.)
To perform hit testing, you need to examine each shape and calculate whether the point is inside the bounds of that shape. If it is, the click has “hit” that shape. Conceptually, this process is straightforward, but the actual details—the calculations you need to figure out whether a shape has been clicked—can get messy.
The first thing you need is a loop that moves through all the shapes. This loop looks a little different from the one that the drawCircles() function uses:
for (var i=circles.length-1; i>=0; i--) {
var circle = circles[i];
...
}
Notice that the code actually moves backward through the array, from finish to start. It starts at the end (where the index is equal to the total number of items in the array, minus 1), and counts back to the beginning (where the index is 0). The backward looping is deliberate, because in most applications (including this one), the objects are drawn in the same order they’re listed in the array. That means later objects are superimposed over earlier ones, and when shapes overlap, it’s always the shape on top that should get the click.
To determine if a click has landed in a shape, you need to use some math. In the case of a circle, you need to calculate the straight-line distance from the clicked point to the center of the circle. If the distance is less than or equal to the radius of the circle, then the point lies inside its bounds.
In the current example, the web page handles the onClick event of the canvas to check for circle clicks. When the user clicks the canvas, it triggers a function named canvasClick(). That function figures out the click coordinates and then sees if they intersect any circle:
function canvasClick(e) {
// Get the canvas click coordinates.
var clickX = e.pageX - canvas.offsetLeft;
var clickY = e.pageY - canvas.offsetTop;
// Look for the clicked circle.
for (var i=circles.length; i>0; i--) {
// Use Pythagorean theorem to find the distance from this point
// and the center of the circle.
var distanceFromCenter =
Math.sqrt(Math.pow(circle.x - clickX, 2) + Math.pow(circle.y - clickY, 2))
// Does this point lie in the circle?
if (distanceFromCenter <= circle.radius) {
// Clear the previous selection.
if (previousSelectedCircle != null) {
previousSelectedCircle.isSelected = false;
}
previousSelectedCircle = circle;
// Select the new circle.
circle.isSelected = true;
// Update the display.
drawCircles();
// Stop searching.
return;
}
}
}
NOTE
You’ll look at another way to do hit testing—by grabbing raw pixels and checking their color—when you create a maze game, on Hit Testing with Pixel Colors.
To finish this example, the drawing code in the drawCircles() function needs a slight tweak. Now it needs to single out the selected circle for special treatment (in this case, a thick, bold border):
function drawCircles() {
...
// Go through all the circles.
for(var i=0; i<circles.length; i++) {
var circle = circles[i];
if (circle.isSelected) {
context.lineWidth = 5;
}
else {
context.lineWidth = 1;
}
...
}
}
There’s no end of ways that you can build on this example and make it smarter. For example, you can add a toolbar of commands that modify the selected circle—for example, changing its color or deleting it from the canvas. Or, you can let the user drag the selected circle around the canvas. To do that, you simply need to listen for the onMouseMove event of the canvas, change the circle coordinates accordingly, and call the drawCircles() function to repaint the canvas. (This technique is essentially a variation of the mouse-handling logic in the paint program on Building a Basic Paint Program, except now you’re using mouse movements to drag a shape, not draw a line.) The try-out site (http://prosetech.com/html5) includes a variation of this example named InteractiveCircles_WithDrag.html that demonstrates this technique.
The lesson is clear: If you keep track of what you draw, you have unlimited flexibility to change it and redraw it later on.
Animating the Canvas
Drawing one perfect picture can seem daunting enough. So it’s no surprise that even seasoned web developers approach the idea of drawing several dozen each second with some trepidation. The whole challenge of animation is to draw and redraw canvas content fast enough that it looks like it’s moving or changing right in front of your visitors.
Animation is an obvious and essential building block for certain types of applications, like real-time games and physics simulators. But simpler forms of animation make sense in a much broader range of canvas-powered pages. You can use animation to highlight user interactivity (for example, making a shape glow, pulse, or twinkle when someone hovers over it). You can also use animation to draw attention to changes in content (for example, fading in a new scene or creating graphs and charts that “grow” into the right positions). Used in these ways, animation is a powerful way to give your web applications some polish, make them feel more responsive, and even help them stand out from the crowd of web competitors.
A Basic Animation
It’s easy enough to animate a drawing on an HTML5 canvas. First, you set a timer that calls your drawing over and over again—typically 30 or 40 times each second. Each time, your code repaints the entire canvas from scratch. If you’ve done your job right, the constantly shifting frames will blend into a smooth, lifelike animation.
JavaScript gives you two ways to manage this repetitive redrawing:
§ Use the setTimeout() function. This tells the browser to wait a few milliseconds and then run a piece of code—in this case, that’s your canvas-drawing logic. Once your code finishes, you call setTimeout() to ask the browser to call it again, and so on, until you want your animation to end.
§ Use the setInterval() function. Tells your browser to run a piece of code at regular intervals (say, every 20 milliseconds). It has much the same effect as setTimeout(), but you need to call setInterval() only once. To stop the browser from calling your code, you callclearInterval().
If your drawing code is quick, both of these have the same effect. If your drawing code is less than snappy, then the setInterval() approach will do a better job of keeping your redraws precisely on time, but possibly at the expense of performance. (In the worst-case situation, when your drawing code takes a bit longer than the interval you’ve set, your browser will struggle to keep up, your drawing code will run continuously, and your page may briefly freeze up.) For this reason, the examples in this chapter use the setTimeout() approach.
When you call setTimeout(), you supply two pieces of information: the name of the function you want to run, and the amount of time to wait before running it. You give the amount of time as a number of milliseconds (thousandths of a second), so 20 milliseconds (a typical delay for animation) is 0.02 seconds. Here’s an example:
var canvas;
var context;
window.onload = function() {
canvas = document.getElementById("canvas");
context = canvas.getContext("2d");
// Draw the canvas in 0.02 seconds.
setTimeout(drawFrame, 20);
};
This call to setTimeout() is the heart of any animation task. For example, imagine you want to make a square fall from the top of the page to the bottom. To do this, you need to keep track of the square’s position using two global variables:
// Set the square's initial position.
var squarePosition_y = 0;
var squarePosition_x = 10;
Now, you simply need to change the position each time the drawFrame() function runs, and then redraw the square in its new position:
function drawFrame() {
// Clear the canvas.
context.clearRect(0, 0, canvas.width, canvas.height);
// Call beginPath() to make sure you don't redraw
// part of what you were drawing before.
context.beginPath();
// Draw a 10x10 square, at the current position.
context.rect(squarePosition_x, squarePosition_y, 10, 10);
context.lineStyle = "black";
context.lineWidth = 1;
context.stroke();
// Move the square down 1 pixel (where it will be drawn
// in the next frame).
squarePosition_y += 1;
// Draw the next frame in 20 milliseconds.
setTimeout(drawFrame, 20);
}
Run this example, and you’ll see a square that plummets from the top of the canvas and carries on, disappearing past the bottom edge.
In a more sophisticated animation, the calculations get more complex. For example, you may want to make the square accelerate to simulate gravity, or bounce at the bottom of the page. But the basic technique—setting a timer, calling a drawing function, and redrawing the entire canvas—stays exactly the same.
Animating Multiple Objects
Now that you’ve learned the basics of animation and the basics of making interactive canvas drawings, it’s time to take the next step and merge them together. Figure 9-10 shows a test page with an animation of falling, bouncing balls. The page uses the familiar setTimeout() method you met in the last section, but now the drawing code has to manage an essentially unlimited number of flying balls.
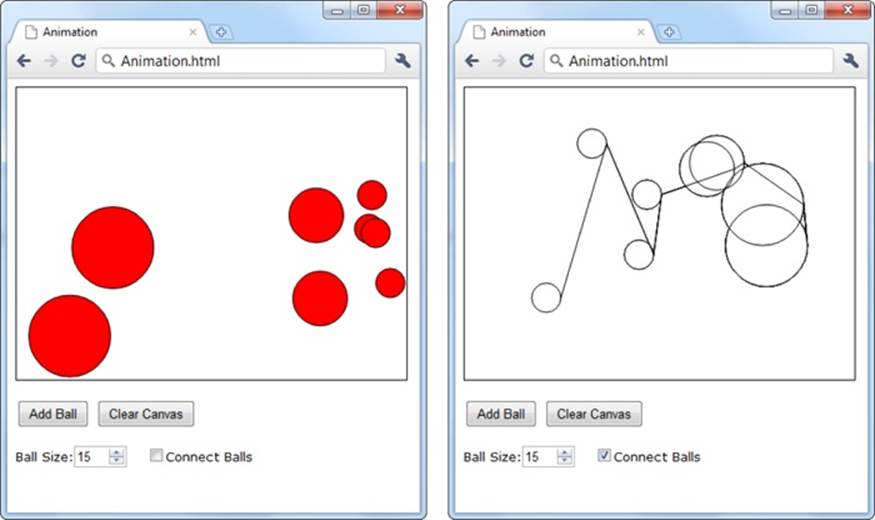
Figure 9-10. This test page lets you add as many balls as you want. You can choose the size of each ball (the default is a 15-pixel radius), and you can switch on connecting lines (shown on right). Once added, each ball begins its own independent journey, falling down and picking up speed until it collides with the bottom of the canvas and bounces off somewhere else.
TIP
Pictures can’t do justice to animations. To find out how animations like the one in Figure 9-10 look and feel, you can try out the examples for yourself at http://prosetech.com/html5.
UP TO SPEED: ANIMATION PERFORMANCE
Because of these rapid redraws, it’s clear that animation will tax the abilities of the canvas far more than ordinary drawing does. However, the canvas holds up surprisingly well. Modern browsers use performance-enhancing features like hardware acceleration, which farms out some of the graphical work to the computer’s video card, rather than using its CPU for everything. And even though JavaScript isn’t the fastest language on the block, it’s quite possible to create a complex, high-speed animation—even a real-time arcade game—without using anything except script code and the canvas.
However, canvas performance can become a problem for people using underpowered mobile devices, like iPhones or phones running Google’s Android operating system. Tests have shown that an animation that can run at 60 fps (frames per second) on a desktop browser probably tops out at a jerky 10 fps on a smartphone. So if you want to create an application for mobile visitors, make sure you test before you get too far into your design, and be prepared to sacrifice some of the animation eye candy to keep things running smoothly.
To manage all the balls in Figure 9-10, you need to reuse the custom object trick you picked up on Keeping Track of What You’ve Drawn. Only now you need to track an array of ball objects, and each ball needs not only a position (represented by the properties x and y), but also a speed (represented by dx or dy):
// These are the details that represent an individual ball.
function Ball(x, y, dx, dy, radius) {
this.x = x;
this.y = y;
this.dx = dx;
this.dy = dy;
this.radius = radius;
this.color = "red";
}
// This is an array that will hold all the balls on the canvas.
var balls = [];
NOTE
In mathematics lingo, dx is the rate that x is changing, and dy is the rate that y is changing. So as the ball is falling, each frame x increases by the dx amount and y increases by the dy amount.
When the visitor clicks the Add Ball button, a simple bit of code creates a new ball object and stores it in the balls array:
function addBall() {
// Get the requested size.
var radius = parseFloat(document.getElementById("ballSize").value);
// Create the new ball.
var ball = new Ball(50,50,1,1,radius);
// Store it in the balls array.
balls.push(ball);
}
The Clear Canvas button has the complementary task of emptying the balls array:
function clearBalls() {
// Remove all the balls.
balls = [];
}
However, neither the addBall() nor the clearBalls() function actually draws anything. Neither one even calls a drawing function. Instead, the page sets itself up to call the drawFrame() function, which paints the canvas in 20 milliseconds intervals:
var canvas;
var context;
window.onload = function() {
canvas = document.getElementById("canvas");
context = canvas.getContext("2d");
// Redraw every 20 milliseconds.
setTimeout(drawFrame, 20);
};
The drawFrame() function is the heart of this example. It not only paints the balls on the canvas, but it also calculates their current position and speed. The drawFrame() function uses a number of calculations to simulate more realistic movement—for example, making balls accelerate as they fall and slow down when they bounce off of obstacles. Here’s the complete code:
function drawFrame() // Clear the canvas.
context.clearRect(0, 0, canvas.width, canvas.height);
context.beginPath();
// Go through all the balls.
for(var i=0; i<balls.length; i++) {
// Move each ball to its new position.
var ball = balls[i];
ball.x += ball.dx;
ball.y += ball.dy;
// Add in a "gravity" effect that makes the ball fall faster.
if ((ball.y) < canvas.height) ball.dy += 0.22;
// Add in a "friction" effect that slows down the side-to-side motion.
ball.dx = ball.dx * 0.998;
// If the ball has hit the side, bounce it.
if ((ball.x + ball.radius > canvas.width) || (ball.x - ball.radius < 0)) {
ball.dx = -ball.dx;
}
// If the ball has hit the bottom, bounce it, but slow it down slightly.
if ((ball.y + ball.radius > canvas.height) || (ball.y - ball.radius < 0))
{
ball.dy = -ball.dy*0.96;
}
// Check if the user wants lines.
if (!document.getElementById("connectedBalls").checked) {
context.beginPath();
context.fillStyle = ball.fillColor;
}
else {
context.fillStyle = "white";
}
// Draw the ball.
context.arc(ball.x, ball.y, ball.radius, 0, Math.PI*2);
context.lineWidth = 1;
context.fill();
context.stroke();
}
// Draw the next frame in 20 milliseconds.
setTimeout(drawFrame, 20);
}
TIP
If you’re fuzzy about how the if statements work in this example, and what operators like ! and || really mean, check out the summary of logical operators on Conditional Logic in Appendix B.
The sheer amount of code can seem a bit intimidating. But the overall approach hasn’t changed. The code performs the same steps:
1. Clear the canvas.
2. Loop through the array of balls.
3. Adjust the position and velocity of each ball.
4. Paint each ball.
5. Set a timeout so the drawFrame() method will be called again, 20 milliseconds later.
The complex bit is step 3, where the ball is tweaked. This code can be as complicated as you like, depending on the effect you’re trying to achieve. Gradual, natural movement is particularly difficult to model, and it usually needs more math.
Finally, now that you’ve done all the work tracking each ball, it’s easy to add interactivity. In fact, you can use virtually the same code you used to detect clicks in the circle-drawing program on Hit Testing with Coordinates. Only now, when a ball is clicked, you want something else to happen—for example, you might choose to give the clicked ball a sudden boost in speed, sending it ricocheting off to the side. (The downloadable version of this example, available at http://prosetech.com/html5, does exactly that.)
To see this example carried to its most impressive extreme, check out the bouncing Google balls at http://tinyurl.com/6byvnk5. When left alone, the balls are pulled, magnet-like, to spell the word “Google.” But when your mouse moves in, they’re repulsed, flying off to the far corners of the canvas and bouncing erratically. And if you’re still hungry for more animation examples, check out the poke-able blob at http://www.blobsallad.se and the somewhat clichéd flying star field at http://tinyurl.com/crn3ed.
FREQUENTLY ASKED QUESTION: CANVAS ANIMATIONS FOR BUSY (OR LAZY) PEOPLE
Do I really need to calculate everything on my own? For real?
The most significant drawback to canvas animation is the fact that you need to do everything yourself. For example, if you want a picture to fly from one side of the canvas to the other, you need to calculate its new position in each frame, and then draw the picture in its proper location. If you have several things being animated at the same time in different ways, your logic can quickly get messy. By comparison, life is much easier for programmers who are using a browser plug-in like Flash or Silverlight. Both technologies have built-in animation systems, which allow developers to give instructions like “Move this shape from here to there, taking 45 seconds.” Or, even better, “Move this shape from the top of the window to the bottom, using an accelerating effect that ends with a gentle bounce.”
To fill this gap, enterprising JavaScript developers have begun creating higher-level drawing and animation systems that sit on top of the canvas. Using these JavaScript libraries, you can pick the effects you want, without having to slog through all the math. The catch? There are at least a half-dozen high quality frameworks for canvas animation, each with its own distinct model and subtle quirks. And it’s impossible to pick which of the evolving toolkits of today will become the best-supported and most widely accepted leaders of tomorrow. Some of the most worthy candidates today are Fabric.js (http://fabricjs.com), Paper.js (http://paperjs.org), EaselJS (www.createjs.com), and KineticJS (http://kineticjs.com). You can read some recent developer opinions on these libraries at http://tinyurl.com/canvas-libraries.
A Practical Example: The Maze Game
So far, you’ve explored how to combine the canvas with some key programming techniques to make interactive drawings and to perform animations. These building blocks take the canvas beyond mere drawing and into the realm of complete, self-contained applications—like games or Flash-style mini-apps.
Figure 9-11 shows a more ambitious example that takes advantage of what you’ve learned so far and builds on both concepts. It’s a simple game that invites the user to guide a small happy face icon through a complex maze. When the user presses an arrow key, the happy face starts moving in that direction (using animation) and stops only when it hits a wall (using hit testing).
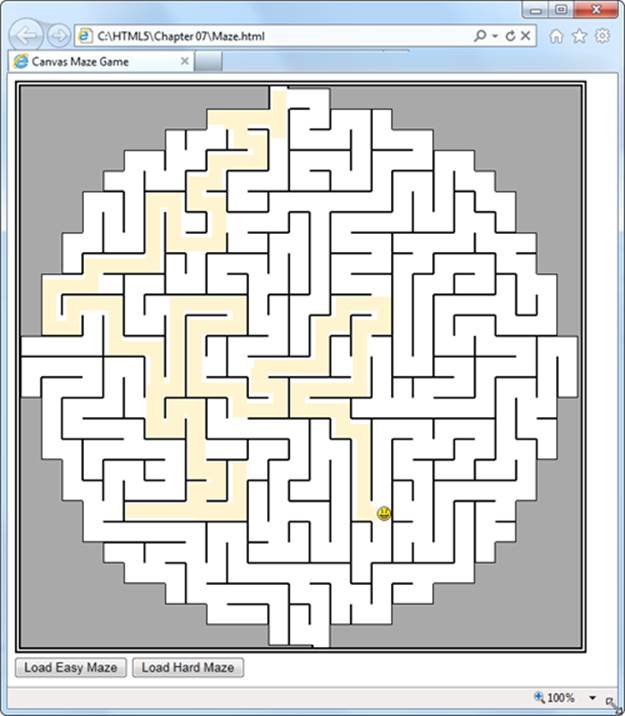
Figure 9-11. Guide the face through the maze. To a user, it looks like a fun game. To a developer, it’s a potent mix of the HTML5 canvas and some smart JavaScript.
Of course, there’s a trade-off. If you’re going to rely on the canvas to build something sophisticated, you’ll need to dig your way through a significant amount of code. The following sections show you the essentials, but be prepared to flex your JavaScript muscles.
NOTE
You can run this example from your local computer if you’re using Internet Explorer 9. But on other browsers, it works only if you first put your page (and the graphics it uses) on a test web server. To save the trouble, run this example from the try-out site at http://prosetech.com/html5.
Setting Up the Maze
Before anything can happen, the page needs to set up the canvas. Although you could paint the entire maze out of lines and rectangles, you’d need a lot of drawing code. Writing that drawing code by hand would be extremely tedious. You’d need to have a mental model of the entire maze, and then draw each short wall segment using a separate drawing operation. If you went this route, you’d almost certainly use a tool that automatically creates your drawing code. For example, you might draw the maze in Adobe Illustrator and then use a plug-in to convert it to canvas code (Transforms).
Another option is to take a preexisting graphic of a maze and paint that on the canvas. This is particularly easy, because the web is filled with free pages that will create mazes for you. Using one of these pages, you set a few details—for example, the size, shape, colors, density, and complexity of the maze—and the page creates a downloadable graphic. (To try it out for yourself, just Google maze generator.)
This example uses maze pictures. When the page first loads, it takes a picture file (named maze.png) and draws that on the canvas. Here’s the code that kicks that process off when the page first loads:
// Define the global variables for the canvas and drawing context.
var canvas;
var context;
window.onload = function() {
// Set up the canvas.
canvas = document.getElementById("canvas");
context = canvas.getContext("2d");
// Draw the maze background.
drawMaze("maze.png", 268, 5);
// When the user presses a key, run the processKey() function.
window.onkeydown = processKey;
};
This code doesn’t actually draw the maze background. Instead, it hands the work off to another function, named drawMaze().
Because this example uses a separate maze-drawing function, it’s not limited to a single maze. Instead, it lets you load any maze graphic you want. You simply need to call drawMaze() and pass in the file name of the maze picture, along with the coordinates for where the happy face should start. Here’s the drawMaze() code that does the job:
// Keep track of the current face position.
var x = 0;
var y = 0;
function drawMaze(mazeFile, startingX, startingY) {
// Load the maze picture.
imgMaze = new Image();
imgMaze.onload = function() {
// Resize the canvas to match the size of the maze picture.
canvas.width = imgMaze.width;
canvas.height = imgMaze.height;
// Draw the maze.
var imgFace = document.getElementById("face");
context.drawImage(imgMaze, 0,0);
// Draw the face.
x = startingX;
y = startingY;
context.drawImage(imgFace, x, y);
context.stroke();
// Draw the next frame in 10 milliseconds.
setTimeout(drawFrame, 10);
};
imgMaze.src = mazeFile;
}
This code uses the two-step image drawing method explained on Drawing Images. First, it sets a function that will handle the image’s onLoad event and draw the maze image after it loads. Second, it sets the src attribute on the image object, which loads the image and triggers the code. This two-step process is a bit more complicated than just pulling the picture out of a hidden <img> element on the page, but it’s necessary if you want to create a function that’s flexible enough to load any maze picture you want.
When the maze image is loaded, the code adjusts the size of the canvas to match, places the face at its proper position, and then paints the face image. Finally, it calls setTimeout() to start drawing frames.
NOTE
The downloadable version of this example (at http://prosetech.com/html5) is slightly more sophisticated. It lets the user load a new maze at any time—even while the happy face is still moving around the current maze. To make this work, it adds a bit of extra code in the drawMaze() function to stop the happy face (if it’s currently moving) and halt the animating process, before loading the background and starting it again.
Animating the Face
When the user hits a key, the face begins moving. For example, if the user presses the down key, the happy face continues moving down until it hits a barrier or another key is pressed.
To make this work, the code uses two global variables that track the happy face’s speed—in other words, how many pixels it will move in the x or y dimension, per frame. The variables that do this are named dx and dy, just as they were in the bouncing ball example (Animating Multiple Objects). The difference is that you don’t need an array for this page, because there’s only one happy face:
var dx = 0;
var dy = 0;
When the user presses a key, the canvas calls the processKey() function. The function then checks if one of the arrow keys was pressed and adjusts the speed accordingly. To identify an arrow key, the code checks its key code against a known value. For example, a key code of 38 always represents the up arrow key. The processKey() function ignores all other keys except the arrow keys:
function processKey(e) {
// If the face is moving, stop it.
dx = 0;
dy = 0;
// The up arrow was pressed, so move up.
if (e.keyCode == 38) {
dy = -1;
}
// The down arrow was pressed, so move down.
if (e.keyCode == 40) {
dy = 1;
}
// The left arrow was pressed, so move left.
if (e.keyCode == 37) {
dx = -1;
}
// The right arrow was pressed, so move right.
if (e.keyCode == 39) {
dx = 1;
}
}
The processKey() function doesn’t change the current position of the happy face, or attempt to draw it. Instead, this task happens every 10 milliseconds, when the drawFrame() function is called.
The drawFrame() code is fairly straightforward, but detailed. It performs several tasks. First, it checks if the face is moving in either direction. If not, there’s really no work to be done:
function drawFrame() {
if (dx != 0 || dy != 0) {
If the face is moving, the drawFrame() code draws a yellow patch in the current face position (which creates the “trail” effect. It then moves the face to its new position:
context.beginPath();
context.fillStyle = "rgb(254,244,207)";
context.rect(x, y, 15, 15);
context.fill()
// Increment the face's position.
x += dx;
y += dy;
Next, the code calls checkForCollision() to see if this new position is valid. (You’ll see the code for this hit testing function in the next section.) If the new position isn’t valid, the face has hit a wall, and the code must move the face back to its old position and stop it from moving:
if (checkForCollision()) {
x -= dx;
y -= dy;
dx = 0;
dy = 0;
}
Now the code is ready to draw the face, where it belongs:
var imgFace = document.getElementById("face");
context.drawImage(imgFace, x, y);
And check if the face has reached the bottom of the maze (and has thus completed it). If so, the code shows a message box:
if (y > (canvas.height - 17)) {
alert("You win!");
return;
}
}
If not, the code sets a timeout so the drawFrame() method will be called again, 10 milliseconds later:
// Draw a new frame in 10 milliseconds.
setTimeout(drawFrame, 10);
}
You’ve now seen all the code for the maze game, except the innovative bit of logic in the checkForCollision() function, which handles the hit testing. That’s the topic you’ll tackle next.
Hit Testing with Pixel Colors
Earlier in this chapter, you saw how you can use mathematical calculations to do your hit testing. However, there’s another approach you can use. Instead of looking through a collection of objects you’ve drawn, you can grab a block of pixels and look at their colors. This approach is simpler in some ways, because it doesn’t need all the objects and the shape tracking code. But it works only if you can make clear-cut assumptions about the colors you’re looking for.
NOTE
The pixel-based hit-testing approach is the perfect approach for the maze example. Using this sort of hit testing, you can determine when the happy face runs into one of the black walls. Without this technique, you’d need a way to store all the maze information in memory and then determine if the current happy-face coordinates overlap one of the maze’s wall lines.
The secret to the color-testing approach is the canvas’s support for manipulating individual pixels—the tiny dots that comprise every picture. The drawing context provides three methods for managing pixels: getImageData(), putImageData(), and createImageData(). You usegetImageData() to grab a block of pixels from a rectangular region and examine them (as in the maze game). You can also modify the pixels and use putImageData() to write them back to the canvas. And finally, createImageData() lets you create a new, empty block of pixels that exists only in memory, the idea being that you can customize them and then write them to the canvas with putImageData().
To understand a bit more about the pixel-manipulation methods, consider the following code. First, it grabs a 100 x 50 square of pixels from the current canvas, using getImageData():
// Get pixels starting at point (0,0), and stretching out 100 pixels to
// the right and 50 pixels down.
var imageData = context.getImageData(0, 0, 100, 50);
Then, the code retrieves the array of numbers that has the image data, using the data property:
var pixels = imageData.data;
You might expect that there’s one number for each pixel, but life isn’t that simple. There are actually four numbers for each pixel, one each to represent its red, green, blue, and alpha components. So if you want to examine each pixel, you need a loop that bounds through the array four steps at a time, like this:
// Loop over each pixel and invert the color.
for (var i = 0, n = pixels.length; i < n; i += 4) {
// Get the data for one pixel.
var red = pixels[i];
var green = pixels[i+1];
var blue = pixels[i+2];
var alpha = pixels[i+3];
// Invert the colors.
pixels[i] = 255 - red;
pixels[i+1] = 255 - green;
pixels[i+2] = 255 - blue;
}
Each number ranges from 0 to 255. The code above uses one of the simplest image manipulation methods around—it inverts the colors. Try this with an ordinary picture, and you get a result that looks like a photo negative.
To see the results, you can write the pixels back to the canvas, in their original positions (although you could just as easily paint the content somewhere else):
context.putImageData(imageData, 0, 0);
The pixel-manipulation methods certainly give you a lot of control. However, they also have drawbacks. The pixel operations are slow, and the pixel data in the average canvas is immense. If you grab off a large chunk of picture data, you’ll have tens of thousands of pixels to look at. And if you were already getting tired of drawing complex pictures using basic ingredients like lines and curves, you’ll find that dealing with individual pixels is even more tedious.
That said, the pixel-manipulation methods can solve certain problems that would be difficult to deal with in any other way. For example, they provide the easiest way to create fractal patterns and Photoshop-style picture filters. In the maze game, they let you create a concise routine that checks the next move of the happy face icon and determines whether it collides with a wall. Here’s the checkForCollision() function that handles the job:
function checkForCollision() {
// Grab the block of pixels where the happy face is, but extend
// the edges just a bit.
var imgData = context.getImageData(x-1, y-1, 15+2, 15+2);
var pixels = imgData.data;
// Check these pixels.
for (var i = 0; n = pixels.length, i < n; i += 4) {
var red = pixels[i];
var green = pixels[i+1];
var blue = pixels[i+2];
var alpha = pixels[i+3];
// Look for black walls (which indicates a collision).
if (red == 0 && green == 0 && blue == 0) {
return true;
}
// Look for gray edge space (which indicates a collision).
if (red == 169 && green == 169 && blue == 169) {
return true;
}
}
// There was no collision.
return false;
}
This completes the canvas maze game, which is the longest and most code-packed example you’ll encounter in this book. It may take a bit more review (or a JavaScript brush-up) before you really feel comfortable with all the code it contains, but once you do you’ll be able to use similar techniques in your own canvas creations.
If you’re hungering for more canvas tutorials, you may want to check out a complete book on the subject, such as HTML5 Canvas (by Steve Fulton and Jeff Fulton) or Core HTML5 Canvas (by David Geary). Either book will take you deeper into the raw and gritty details of do-it-yourself canvas drawing.
POWER USERS’ CLINIC: EYE-POPPING CANVAS EXAMPLES
There’s virtually no limit to what you can do with the canvas. If you want to look at some even more ambitious examples that take HTML5 into the world of black-belt coding, the Web is your friend. Here’s a list of websites that demonstrate some mind-blowing canvas mojo:
§ Canvas Demos. This canvas example site has enough content to keep you mesmerized for days. Entries include the game Mutant Zombie Masters and the stock-charting tool TickerPlot. Visit www.canvasdemos.com to browse them all.
§ Wikipedia knowledge map. This impressive canvas application shows a graphical representation of Wikipedia articles, with linked topics connected together by slender, web-like lines. Choose a new topic, and you zoom into that part of the knowledge map, pulling new articles to the forefront with a slick animation. See it at http://en.inforapid.org.
§ 3D Walker. This example lets you walk through a simple 3D world of walls and passages (similar to the ancient Wolfenstein 3D game that kicked off the first-person-shooter gaming craze way back in 1992). Take it for a spin at www.benjoffe.com/code/demos/canvascape.
§ Chess. This HTML5 chess simulator lets you try your hand against a computer opponent with a canvas-drawn board that’s rendered from above or with a three-dimensional perspective, depending on your preference. Challenge yourself to a game at http://htmlchess.sourceforge.net/demo/example.html.