HTML5 & CSS3 FOR THE REAL WORLD (2015)
Chapter 12 Canvas, SVG, and Drag and Drop
The HTML5 Herald is becoming quite dynamic for an “ol’ timey” newspaper! We’ve added a video with the new video element, made our site available offline, added support to remember the user’s name and email address, and used geolocation to detect where our user is.
But there’s still much we can do to make it even more fun. First, the video is a little at odds with the rest of the paper, since it’s in color. Second, the geolocation feature, while fairly speedy, could use a progress indicator to let the user know we haven’t left them stranded. And finally, it would be nice to add one more dynamic piece to our page. We’ll take care of all three of these items using the APIs we’ll discuss in this chapter: Canvas, SVG, and Drag and Drop.
Canvas
With HTML5’s Canvas API, we can draw anything we can imagine, all through JavaScript. This can improve the performance of our websites by avoiding the need to download images off the network. With canvas, we can draw shapes and lines, arcs and text, gradients and patterns. In addition, canvas gives us the power to manipulate pixels in images and even video. We’ll start by introducing some of the basic drawing features of canvas, but then move on to using its power to transform our video—taking our modern-looking color video and converting it into conventional black and white to match the overall look and feel of The HTML5 Herald.
The Canvas API is supported in:
· Chrome 4+
· Firefox 2+
· Opera 9.6+
· Safari 3.1+
· iOS 3.2+
· Internet Explorer 9.0+
· Android 3.0+
A Bit of Canvas History
Canvas was first developed by Apple. Since they already had a framework—Quartz 2D—for drawing in two-dimensional space, they went ahead and based many of the concepts of what woud come to be known as HTML5’s canvas on that framework. It was then adopted by Mozilla and Opera, and then standardized by the WHATWG (and subsequently picked up by the W3C, along with the rest of HTML5).
There’s some good news here. If you aspire to do development for the iPhone or iPad (referred to jointly as iOS), or for the Mac, what you learn in canvas should help you understand some of the basic concepts of Quartz 2D. If you already develop for the Mac or iOS and have worked with Quartz 2D, many canvas concepts will look very familiar to you.
Creating a canvas Element
The first step to using canvas is to add a canvas element to the page:
<canvas>
Sorry! Your browser doesn’t support Canvas.
</canvas>
The text in between the canvas tags will only be shown if the canvas element is not supported by the visitor’s browser.
Since drawing on the canvas is done using JavaScript, we’ll need a way to grab the element from the DOM. We’ll do so by giving our canvas an ID:
<canvas id="myCanvas" class="myCanvas">
Sorry! Your browser doesn’t support Canvas.
</canvas>
The canvas element takes both a width and height attribute, which must also be set.
Note: Why not set width and height using CSS?
You may be asking yourself, why not set the width and height via CSS? It’s because the width and height attributes determine how large the canvas’s coordinate system is. If we don’t specify width and height, the canvas element will default to a width of 300 and a height of 150. If we set the width and height for a canvas only in CSS, the canvas element will be 300 by 150, and the CSS properties will simply determine how large the box is that displays the image.
Let’s add a width and height attribute to the canvas element:
<canvas id="myCanvas" class="myCanvas" width="200" height="200">
Sorry! Your browser doesn’t support Canvas.
</canvas>
Finally, let’s add a border to our canvas using some CSS to visually distinguish it on the page. Canvas has no default styling, so it’s difficult to see where it is on the page unless you give it some kind of border:
.myCanvas {
border: dotted 2px black;
}
Now that we’ve styled it, we can actually view the canvas container on our page; Figure 12.1 shows what it looks like.
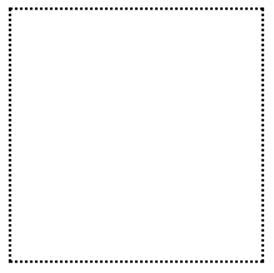
Figure 12.1. An empty canvas with a dotted border
Drawing on the Canvas
All drawing on the canvas happens via the Canvas JavaScript API. In this chapter, we’ll walk you through several different things you can draw onto the canvas element. Each example will have a new function, and all of these different functions live in a file called canvas.js.
Note: A Canvas Playground
We have created a separate file at The HTML5 Herald, canvas.html, for you to see the examples outlined in this chapter. At canvas.html there are seven different canvas elements, each demonstrating a different technique shown in this chapter.
But first, let’s start with the basics. Before we can draw onto a canvas, we need to grab hold of the canvas element on our page:
var canvas = document.getElementById("myCanvas");
Getting the Context
Once we’ve stored our canvas element in a variable, we then set up the canvas’s context. The context is the place where your drawing is rendered. Currently, there’s only wide support for drawing to a two-dimensional context. The W3C Canvas spec defines the context in theCanvasRenderingContext2D interface. Most methods we’ll be using to draw onto the canvas are defined in this interface.
We obtain our drawing context by calling the getContext method and passing it the string "2d", since we’ll be drawing in two dimensions:
var canvas = document.getElementById("myCanvas");
var context = canvas.getContext("2d");
The object that’s returned by getContext is an instance of CanvasRenderingContext2D. In this chapter, we’ll refer to it as simply “the context object” for brevity.
Note: What about 3D?
WebGL is a new API for 3D graphics being managed by the Khronos Group, with a WebGL working group that includes Apple, Mozilla, Google, and Opera.
By combining WebGL with HTML5 Canvas, you can draw in three dimensions. WebGL is currently fully supported in Chrome 18+, Internet Explorer 11+, and iOS 8+, and partially supported in Firefox 4+, Safari 5.1, Opera 12+, and Chrome 37+ for Android. To learn more, see http://www.khronos.org/webgl/.
Filling Our Brush with Color
On a real-life painting canvas, you must first saturate your brush with paint before you can begin. In the HTML5 canvas, you must do the same, and we do so with the strokeStyle or fillStyle properties. Both strokeStyle and fillStyle are set on a context object, and both take one of three values: a string representing a color, a CanvasGradient object, or a CanvasPattern object.
Let’s start by using a color string to style the stroke. You can think of the stroke as the border of the shape you’re going to draw. To draw a rectangle with a red border, we first define the stroke color:
var canvas = document.getElementById("myCanvas");
var context = canvas.getContext("2d");
context.strokeStyle = "red";
To draw a rectangle with a red border and blue fill, we must also define the fill color:
var canvas = document.getElementById("myCanvas");
var context = canvas.getContext("2d");
context.strokeStyle = "red";
context.fillStyle = "blue";
We can use any CSS color value to set the stroke or fill color, as long as we specify it as a string: a hexadecimal value such as #00FFFF, a color name such as red or blue, or an RGB value such as rgb(0, 0, 255). We can even use the property rgba to set a semitransparent stroke or fill color.
Let’s change our blue fill to blue with a 50% opacity:
var canvas = document.getElementById("myCanvas");
var context = canvas.getContext("2d");
context.strokeStyle = "red";
context.fillStyle = "rgba(0, 0, 255, 0.5)";
Drawing a Rectangle to the Canvas
Once we’ve defined the color of the stroke and the fill, we’re ready to start drawing! Let’s begin by drawing a rectangle. We can repeat the steps we just took: grabbing the canvas and the context, and setting a fill and stroke style. But now, we’ll draw a rectangle. We can do this by calling the fillRect and strokeRect methods. Both of these methods take the X and Y coordinates where you want to begin drawing the fill or the stroke, and the width and height of the rectangle. We’ll add the stroke and fill 10 pixels from the top and 10 pixels from the left of the canvas’s top-left corner:
var canvas = document.getElementById("myCanvas");
var context = canvas.getContext("2d");
context.strokeStyle = "red";
context.fillStyle = "rgba(0, 0, 255, 0.5)";
context.fillRect(10, 10, 100, 100);
context.strokeRect(10, 10, 100, 100);
This will create a semitransparent blue rectangle with a red border, such as the one in Figure 12.2.
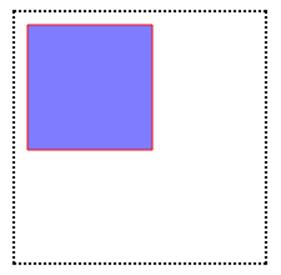
Figure 12.2. A simple rectangle—not bad for our first canvas drawing!
Note: The Canvas Coordinate System
As you may have gathered, the coordinate system in the canvas element is different from the Cartesian coordinate system you learned in math class. In the canvas coordinate system, the top-left corner is (0,0). If the canvas is 200 pixels by 200 pixels, then the bottom-right corner is (200,200), as Figure 12.3 illustrates.
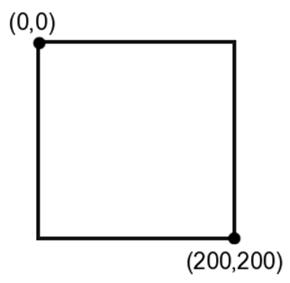
Figure 12.3. The canvas coordinate system goes top-to-bottom and left-to-right
Variations on fillStyle
Instead of a color as our fillStyle, we could have used a CanvasGradient or a CanvasPattern object. Let’s create a pattern on the second canvas element (whose ID is demo2) on the canvas.html page.
We create a CanvasPattern by calling the createPattern method. createPattern takes two parameters: the image to create the pattern with, and how that image should be repeated. The repeat value is a string, and the valid values are the same as those in CSS: repeat, repeat-x, repeat-y, andno-repeat.
Instead of using a semitransparent blue fillStyle, let’s create a pattern using our bicycle image. We’ll do this in a new function called drawPattern. After doing the basics (grabbing the canvas and the context and setting a stroke), we must create an Image object and set its src property to our image:
function drawPattern() {
var canvas = document.getElementById("demo2");
var context = canvas.getContext("2d");
context.strokeStyle = "red";
var img = new Image();
img.src = "../images/bg-bike.png";
}
Setting the src attribute will tell the browser to start downloading the image; however, if we try to use it immediately to create our gradient, we might run into some problems, because the image may still be loading (depending on whether it is in the browser cache). To be on the safe side, we’ll use the image’s onload property to create our pattern once the image has been fully loaded by the browser:
function drawPattern() {
var canvas = document.getElementById("demo2");
var context = canvas.getContext("2d");
context.strokeStyle = "red";
var img = new Image();
img.src = "../images/bg-bike.png";
img.onload = function() {
};
}
In our onload event handler, we call createPattern, passing it the Image object and the string repeat so that our image repeats along both the X and Y axes. We store the results of createPattern in the variable pattern, and set the fillStyle to that variable:
function drawPattern() {
…
var img = new Image();
img.src = "../images/bg-bike.png";
img.onload = function() {
var pattern = context.createPattern(img, "repeat");
context.fillStyle = pattern;
context.fillRect(10, 10, 100, 100);
context.strokeRect(10, 10, 100, 100);
};
}
Note: Anonymous Functions
You may be asking yourself, “what is that function statement that comes right before the call to img.onload?” It’s an anonymous function. Anonymous functions are much like regular functions except, as you might guess, they are without names.
When you see an anonymous function defined as an event listener, it means that the anonymous function is being bound to that event. In other words, the code inside that anonymous function will be run when the load event is fired.
Now, our rectangle’s fill is a pattern made up of our bicycle image, as Figure 12.4 shows.
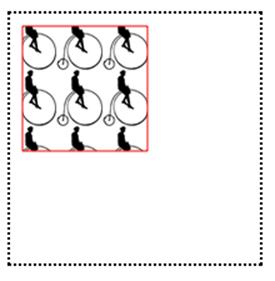
Figure 12.4. A pattern fill on a canvas
We can also create a CanvasGradient object to use as our fillStyle. To create a CanvasGradient, we call one of two methods: createLinearGradient() or createRadialGradient(); then we add one or more color stops to the gradient.
createLinearGradient’s x0 and y0 represent the starting location of the gradient. x1 and y1 represent the ending location.
Let’s try creating a gradient in the third canvas element. To create a gradient that begins at the top of the canvas and blends the color down to the bottom, we’d define our starting point at the origin (0,0), and our ending point 200 pixels down from there (0,200):
function drawGradient() {
var canvas = document.getElementById("demo3");
var context = canvas.getContext("2d");
context.strokeStyle = "red";
var gradient = context.createLinearGradient(0, 0, 0, 200);
}
Next, we specify our color stops. The color stop method is simply addColorStop().
The offset is a value between 0 and 1. An offset of 0 is at the start of the gradient, and an offset of 1 is at the end of the gradient. The color is a string value that, as with the fillStyle, can be a color name, a hexadecimal color value, an rgb() value, or an rgba() value.
To make a gradient that starts as blue and begins to blend into white halfway down the gradient, we can specify a blue color stop with an offset of 0 and a purple color stop with an offset of 1:
function drawGradient() {
…
var gradient = context.createLinearGradient(0, 0, 0, 200);
gradient.addColorStop(0, "blue");
gradient.addColorStop(1, "white");
context.fillStyle = gradient;
context.fillRect(10, 10, 100, 100);
context.strokeRect(10, 10, 100, 100);
}
Figure 12.5 is the result of setting our CanvasGradient to be the fillStyle of our rectangle.
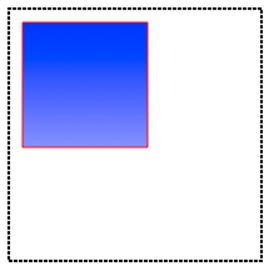
Figure 12.5. Creating a linear gradient with canvas
Drawing Other Shapes by Creating Paths
We’re not limited to drawing rectangles—we can draw any shape we can imagine! Unlike rectangles and squares, however, there’s no built-in method for drawing circles or other shapes. To draw more interesting shapes, we must first lay out the path of the shape.
Paths create a blueprint for your lines, arcs, and shapes, but paths are invisible until you give them a stroke! When we drew rectangles, we first set the strokeStyle and then called fillRect. With more complex shapes, we need to take three steps: layout the path, stroke the path, and fill the path. As with drawing rectangles, we can just stroke the path, or fill the path—or we can do both.
Let’s draw a circle on the fourth canvas element at canvas.html. We’ll write a generic function that draws a circle that we can pass the canvas element we want to draw onto―that way, we can reuse this function in a later example. The first step is to begin the path of the circle. We do that with the method beginPath(), which resets the default path for you to begin drawing a new shape:
function drawCircle(canvas) {
var context = canvas.getContext("2d");
context.beginPath();
}
Now we need to create an arc. An arc is a segment of a circle, but as there’s no method for creating a circle, we can draw a 360° arc. We create it using the arc method:
function drawCircle(canvas) {
var canvas = document.getElementById("myCanvas");
var context = canvas.getContext("2d");
context.beginPath();
context.arc(50, 50, 30, 0, Math.PI*2, true);
}
The signature for the arc method is: arc(x, y, radius, startAngle, endAngle, anticlockwise).
x and y represent where on the canvas you want the arc’s path to begin. Imagine this as the center of the circle that you’ll be drawing. radius is, of course, the distance from the center to the edge of the circle.
startAngle and endAngle represent the start and end angles along the circle’s circumference that you want to draw. The units for the angles are in radians, and a circle is 2π radians. We want to draw a complete circle, so we’ll use 2π for the endAngle. In JavaScript, we can obtain this value by multiplying Math.PI by 2.
Note: Radians Explained
Radians are a unit used to measure angles, and the symbol π denotes a measurement in radians. One radian is equal to 180 degrees. Two radians, or 2π, are equal to 360 degrees. For a review of radians, see the “Intuitive Guide to Angles, Degrees and Radians” at betterexplained.com.
anticlockwise is an optional argument. If you wanted the arc to be drawn counterclockwise instead of clockwise, you would set this value to true. Since we are drawing a full circle, it’s of no consequence which direction we draw it in, so we omit this argument.
Our next step is to close the path, as we’ve now finished drawing our circle. We do that with the closePath method:
function drawCircle(canvas) {
var context = canvas.getContext("2d");
context.beginPath();
context.arc(100, 100, 50, 0, Math.PI*2, true);
context.closePath();
}
Now we have a path—but unless we stroke it or fill it, we’ll be unable to see it. Thus, we must set a strokeStyle if we’d like to give it a border, and we must set a fillStyle if we’d like our circle to have a fill color. By default, the width of the stroke is one pixel, which is stored in thelineWidth property of the context object. Let’s make our border a bit bigger by setting the lineWidth to 3:
function drawCircle(canvas) {
var context = canvas.getContext("2d");
context.beginPath();
context.arc(50, 50, 30, 0, Math.PI*2, true);
context.closePath();
context.strokeStyle = "red";
context.fillStyle = "blue";
context.lineWidth = 3;
}
Lastly, we fill and stroke the path. Note that this time, the method names are different from those we used with our rectangle. To fill a path you simply call fill, and to stroke it you call stroke:
function drawCircle(canvas) {
var context = canvas.getContext("2d");
context.beginPath();
context.arc(100, 100, 50, 0, Math.PI*2, true);
context.closePath();
context.strokeStyle = "red";
context.fillStyle = "blue";
context.lineWidth = 3;
context.fill();
context.stroke();
}
Figure 12.6 shows the finished circle.
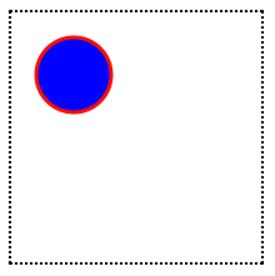
Figure 12.6. Our shiny new circle
To learn more about drawing shapes, the Mozilla Developer Network has an excellent tutorial.
Saving Canvas Drawings
If we create an image programmatically using the Canvas API, but decide we’d like to have a local copy of our drawing, we can use the API’s toDataURL method to save our drawing. toDataURL creates a URL with the image in it, (either a png or jpg, whichever is specified). You can then right-click the image at this URL, and save it as a PNG or JPEG.
In the fifth demo on the canvas.html page, let’s redraw a circle, but add a button called saveButton that allows us to save this circle drawn onto the canvas:
<h2>Demo 5: Saving canvas drawings</h2>
<canvas width="200" height="200" id="demo5" class="myCanvas">
Sorry! Your browser doesn't support Canvas.
</canvas>
<button name="saveButton" id="saveButton">Save Drawing</button>
When the button is clicked, we want to open the canvas drawing as an image in a new tab. To do that, we’ll define a new JavaScript function called saveDrawing:
function saveDrawing() {
var canvas5 = document.getElementById("demo5");
window.open(canvas5.toDataURL("image/png"));
}
Next, let’s add code to canvas.js to call our saveDrawing function when the Save button is clicked:
var button = document.getElementById("saveButton");
button.addEventListener("click", saveDrawing, false);
Note: Adding IE8 Support
For simplicity, we are using addEventListener in this chapter. This function is supported in all major, modern browsers, but not IE8, which we want support for in our code examples. You'll see in the book's code that we use a simple helper function called addEvent that usesaddEventListener if it's supported; In the case where there's no support, it uses an old method called attachEvent, the method IE8 supports.
When the button is clicked, a new tab opens with a PNG file loaded into it, as shown in Figure 12.7.
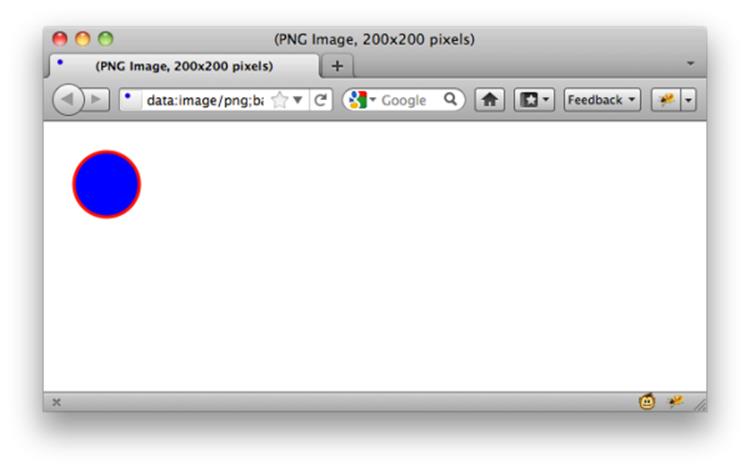
Figure 12.7. Our image loads in a new window
To learn more about saving our canvas drawings as files, see the W3C Canvas spec and the “Saving a canvas image to file” section of Mozilla’s Canvas code snippets.
Drawing an Image to the Canvas
We can also draw images onto the canvas element. In this example, we’ll be redrawing onto the canvas an image that already exists on the page.
For the sake of illustration, we’ll use the HTML5 logo as our image for the next few examples. Let’s start by adding it to our page in an img element:
<h2>Demo 6: Drawing an image to the canvas</h2>
<canvas width="200" height="200" id="demo6" class="myCanvas">
Sorry! Your browser doesn't support Canvas.
</canvas>
<img src="images/html5-logo.png" id="myImageElem">
Then, in our canvas.js file, we’ll create a new function called drawImageToCanvas in order to redraw the HTML img element onto the canvas.
Before we attempt to redraw an HTML img element on the page, we must ensure that the element has loaded. In order to do that, we’ll add an event listener that will run our code only once the window’s load event has fired:
window.addEventListener("load", drawImageToCanvas, false);
Next, after grabbing the canvas element and setting up the canvas’s context, we can grab an image from our page via document.getElementById:
function drawImageToCanvas() {
var canvas = document.getElementById("demo6");
var context = canvas.getContext("2d");
var image = document.getElementById("myImageElem");
}
We’ll use the same CSS that we used before to make the area of the canvas element visible:
.myCanvas {
border: dotted 2px black;
}
Let’s modify it slightly to space out our canvas and our image:
.myCanvas {
border: dotted 2px black;
margin: 0 20px;
}
Figure 12.8 shows our empty canvas next to our image.
Figure 12.8. An image and a canvas sitting on a page, doing very little
We can use canvas’s drawImage method to redraw the image from our page into the canvas:
function drawImageToCanvas() {
var canvas = document.getElementById("demo6");
var context = canvas.getContext("2d");
var image = document.getElementById("myImageElem");
context.drawImage(image, 0, 0);
}
Because we’ve drawn the image to the (0,0) coordinate, the image appears in the top-left of the canvas, as you can see in Figure 12.9.
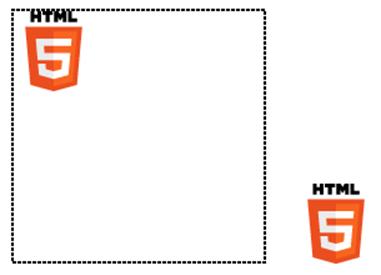
Figure 12.9. Redrawing an image inside a canvas
We could instead draw the image at the center of the canvas by changing the X and Y coordinates that we pass to drawImage. Since the image is 64 by 64 pixels and the canvas is 200 by 200 pixels, if we draw the image to (68, 68),[17] the image will be in the center of the canvas, as inFigure 12.9.
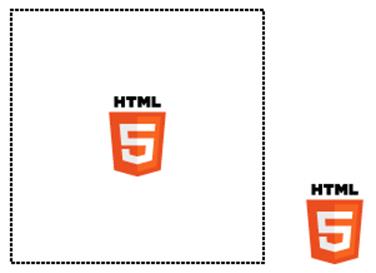
Figure 12.10. Displaying the image in the center of the canvas
Manipulating Images
Redrawing an image element from the page onto a canvas is fairly unexciting. It’s really no different from using an img element. Where it does become interesting is how we can manipulate an image after we’ve drawn it into the canvas.
Once we’ve drawn an image on the canvas, we can use the getImageData method from the Canvas API to manipulate the pixels of that image. For example, if we wanted to convert our logo from color to black and white, we can do so using methods in the Canvas API.
getImageData will return an ImageData object, which contains three properties: width, height, and data. The first two are self-explanatory; it’s the last one, data, that interests us.
data contains information about the pixels in the ImageData object in the form of an array. Each pixel on the canvas will have four values in the data array, which correspond to that pixel’s R, G, B, and A values. A stands for Alpha, a measure of the element’s transparency, with 0 meaning the element is totally transparent, 1 meaning it’s totally opaque, and 0.5 meaning it’s 50% transparent.
The getImageData method allows us to examine a small section of a canvas, so let’s use this feature to become more familiar with the data array. getImageData takes four parameters, corresponding to the four corners of a rectangular piece of the canvas we’d like to inspect. If we callgetImageData on a very small section of the canvas, say context.getImageData(0, 0, 1, 1), we’d be examining just one pixel (the rectangle from 0,0 to 1,1). The array that’s returned is four items long, as it contains a red, green, blue, and alpha value for this lone pixel:
var canvas = document.getElementById("myCanvas");
var context = canvas.getContext("2d");
var image = document.getElementById("myImageElem");
// draw the image at x=0 and y=0 on the canvas
context.drawImage(image, 68, 68);
var imageData = context.getImageData(0, 0, 1, 1);
var pixelData = imageData.data;
console.log(pixelData.length);
We log the length of the pixelData array to the console, and the output confirms that the data array for a one-pixel section of the canvas will have four values.
Security Errors with getImageData
If you tried out this code by double-clicking the file in Chrome or Firefox (in other words, you’re not using a web server to view the file), you may have noticed that it failed to work—the image on the canvas is in color. That’s because when you’re running the code locally on your computer, you’ll be using the file:// protocol to open local files. And files loaded with the file:// protocol are considered to come from different domains, which is deemed a security error.
What you’ll see specifically is an error in getImageData. The error is a security error, though in our case it’s an unnecessary one.
The true security issue that Chrome and Firefox are attempting to prohibit is a user on one domain manipulating images on another domain. For example, stopping me from loading an official logo from http://google.com/ and then manipulating the pixel data.
The W3C Canvas spec describes it this way:
Information leakage can occur if scripts from one domain can access information (e.g. read pixels) from images from another domain (this is called a cross-origin request). To mitigate this, canvas elements are defined with a flag indicating whether they are origin-clean.
This origin-clean flag will be set to false if the image you want to manipulate is on a different domain from the JavaScript doing the manipulating. Unfortunately, in Chrome and Firefox, this origin-clean flag is also set to false while you’re testing from files on your hard drive, as they’re seen as being files that live on different domains.
If you want to test pixel manipulation using canvas in Firefox or Chrome, you’ll need to either test it on a web server running on your computer (http://localhost/), or test it online.
Converting an Image from Color to Black and White
Let’s look at how we’d go about using getImageData to convert a full color image into black and white on a canvas. We’ll create a new function in the canvas.js file called manipulateImage to do so.
Assuming that we’ve already placed an image onto the canvas, as we did above, we can use a for loop to iterate through each pixel in the image and change it to grayscale.
First, we’ll call getImageData(0, 0, 200, 200) to retrieve the entire canvas. Then, we’ll grab the red, green, and blue values of each pixel, which appear in the array in that order:
function manipulateImage() {
var canvas = document.getElementById("demo7");
var context = canvas.getContext("2d");
var image = document.getElementById("secondImage");
context.drawImage(image, 68, 68);
var imageData = context.getImageData(0, 0, 200, 200);
var red, green, blue, greyscale;
for (var i = 0; i < imageData.data.length; i += 4) {
red = imageData.data[i];
green = imageData.data[i + 1];
blue = imageData.data[i + 2];
}
}
Notice that our for loop is incrementing i by 4 instead of the usual 1. This is because each pixel takes up four values in the imageData array—one number each for the R, G, B, and A values.
Next, we must determine the grayscale value for the current pixel. It turns out that there’s a mathematical formula for converting RGB to grayscale; you simply need to multiply each of the red, green, and blue values by some specific numbers, seen in this code block:
function manipulateImage() {
…
for (var i = 0; i < imageData.data.length; i += 4) {
red = imageData.data[i];
green = imageData.data[i + 1];
blue = imageData.data[i + 2];
grayscale = red * 0.3 + green * 0.59 + blue * 0.11;
}
Now that we have the proper grayscale value, we’re going to store it back into the red, green, and blue values in the data array:
function manipulateImage() {
…
for (var i = 0; i < imageData.data.length; i += 4) {
var red = imageData.data[i];
var green = imageData.data[i + 1];
var blue = imageData.data[i + 2];
var grayscale = red * 0.3 + green * 0.59 + blue * 0.11;
imageData.data[i] = grayscale;
imageData.data[i + 1] = grayscale;
imageData.data[i + 2] = grayscale;
}
}
So now we’ve modified our pixel data by individually converting each pixel to grayscale. The final step? Putting the image data we’ve modified back into the canvas via a method called putImageData. This method does exactly what you’d expect: it takes an image's data and writes it onto thecanvas. Here’s the method in action:
function manipulateImage() {
var canvas = document.getElementById("demo7");
var context = canvas.getContext("2d");
var image = document.getElementById("secondImage");
context.drawImage(image, 60, 60);
var imageData = context.getImageData(0, 0, 200, 200);
for (var i = 0; i < imageData.data.length; i += 4) {
var red = imageData.data[i];
var green = imageData.data[i + 1];
var blue = imageData.data[i + 2];
var grayscale = red * 0.3 + green * 0.59 + blue * 0.11;
imageData.data[i] = grayscale;
imageData.data[i + 1] = grayscale;
imageData.data[i + 2] = grayscale;
}
context.putImageData(imageData, 0, 0);
}
With that, we’ve drawn a black-and-white version of the validation image into the canvas.
Manipulating Video with Canvas
We can take the code we’ve already written to convert a color image to black and white and enhance it to make our color video black and white, matching the old-timey feel of The HTML5 Herald page. We’ll do this in a new separate JavaScript file called videoToBW.js, so that we can include it on the site’s home page.
The file begins, as always, by setting up the canvas and the context:
function makeVideoOldTimey() {
var video = document.getElementById("video");
var canvas = document.getElementById("canvasOverlay");
var context = canvas.getContext("2d");
}
Next, we’ll add a new event listener to react to the play event firing on the video element.
We want to call a custom function called draw when the video begins playing (we’ll review what happens in this custom function right after this code block). To do so, we’ll add an event listener to our video element that responds to the play event:
function makeVideoOldTimey() {
var video = document.getElementById("video");
var canvas = document.getElementById("canvasOverlay");
var context = canvas.getContext("2d");
video.addEventListener("play", function() {
draw(video,context,canvas);
}, false);
}
The draw function, which is a custom function that we’ll define, will be called when the play event fires. It will be passed the video, context, and canvas objects. We’re using an anonymous function here instead of a normal named function because we’re unable to actually pass parameters to named functions when declaring them as event handlers without wrapping them in an another function.
Since we want to pass several parameters to the draw function—video, context, and canvas—we must call it from inside an anonymous function.
Let’s look at the custom draw function:
function draw(video, context, canvas) {
if (video.paused || video.ended) return false;
drawOneFrame(video, context, canvas);
}
Before doing anything else, we check to see if the video is paused or has ended, in which case we’ll just cut the function short by returning false. Otherwise, we continue on to the drawOneFrame function. The drawOneFrame function is nearly identical to the code we had earlier for converting an image from color to black and white, except that we’re drawing the video element onto the canvas instead of a static image:
function drawOneFrame(video, context, canvas){
// draw the video onto the canvas
context.drawImage(video, 0, 0, canvas.width, canvas.height);
var imageData = context.getImageData(0, 0, canvas.width, canvas.height);
var pixelData = imageData.data;
// Loop through the red, green and blue pixels,
// turning them grayscale
var red, green, blue, greyscale;
for (var i = 0; i < pixelData.length; i += 4) {
red = pixelData[i];
green = pixelData[i + 1];
blue = pixelData[i + 2];
//we'll ignore the alpha value, which is in position i+3
grayscale = red * 0.3 + green * 0.59 + blue * 0.11;
pixelData[i] = grayscale;
pixelData[i + 1] = grayscale;
pixelData[i + 2] = grayscale;
}
context.putImageData(imageData, 0, 0);
}
Note: Getting Better Performance
You may notice a difference between the code sample used in converting an image to black and white, and the code sample for converting a video. In the video conversion, we’ve created another variable, pixelData, which stores the array of pixels in it. You may be wondering why we bother doing this, instead of just accessing imageData.data. The reason is performance. Creating the pixelData variable, which is then used several times in the for loop, saves us several property lookups. There would be no issue if we were just doing one color conversion, but since we’re performing this action over and over again as the video plays, tiny delays matter.
After we’ve drawn one frame, what’s the next step? We need to draw another frame! The setTimeout method allows us to keep calling the draw function over and over again, without pause. The final parameter is the value for delay, which tells the browser how long, in milliseconds, to wait before calling the function. Because it’s set to 0, we are essentially running draw continuously. This goes on until the video has either ended, or been paused:
function draw(video, context, canvas) {
if (video.paused || video.ended) return false;
drawOneFrame(video, context, canvas);
// Start over!
setTimeout(function(){ draw(video, context, canvas); }, 0);
}
What’s the final result of this code? Our color video of a plane taking off now plays in black and white!
Displaying Text on the Canvas
If we were to view The HTML5 Herald from a file on a computer, we’d encounter security errors in Firefox and Chrome when trying to manipulate an entire video, as we did with a simple image. We can add a bit of error-checking in order to make our video work anyway, whether or not we view it from our local machine in Chrome or Firefox.
The first step is to add an error handling try/catch block to catch the error:
function drawOneFrame(video, context, canvas){
context.drawImage(video, 0, 0, canvas.width, canvas.height);
try {
var imageData = context.getImageData(0, 0, canvas.width, canvas.height);
var pixelData = imageData.data;
for (var i = 0; i < pixelData.length; i += 4) {
var red = pixelData[i];
var green = pixelData[i + 1];
var blue = pixelData[i + 2];
var grayscale = red * 0.3 + green * 0.59 + blue * 0.11;
pixelData[i] = grayscale;
pixelData[i + 1] = grayscale;
pixelData[i + 2] = grayscale;
}
imageData.data = pixelData;
context.putImageData(imageData, 0, 0);
} catch (err) {
// error handling code will go here
}
}
If an error occurs when trying to call getImageData, it would be nice to let the user know what is going wrong. We’ll do just that, using the fillText method of the Canvas API.
Before we write any text to the canvas, we should clear what’s already there. We’ve already drawn the first frame of the video into the canvas using the call to drawImage. How can we clear it?
It turns out that if we reset the width or height of the canvas, the canvas will be cleared. So, let’s reset the width:
function drawOneFrame(video, context, canvas){
context.drawImage(video, 0, 0, canvas.width, canvas.height);
try {
…
} catch (err) {
canvas.width = canvas.width;
}
}
Next, let’s change the background color from black to transparent, since the canvas element is positioned on top of the video:
function drawOneFrame(video, context, canvas){
context.drawImage(video, 0, 0, canvas.width, canvas.height);
try {
…
} catch (err) {
// clear the canvas
context.clearRect(0,0,canvas.width,canvas.height);
canvas.style.backgroundColor = "transparent";
context.fillStyle = "white";
}
}
Before we can draw any text to the now transparent canvas, we first must set up the style of our text—similar to what we did with paths earlier. We do that with the fillStyle and textAlign methods:
videoToBW.js (excerpt)
function drawOneFrame(video, context, canvas){
context.drawImage(video, 0, 0, canvas.width, canvas.height);
try {(review code style)
…
} catch (err) {
// clear the canvas
context.clearRect(0,0,canvas.width,canvas.height);
canvas.style.backgroundColor = "transparent";
context.fillStyle = "white";
context.textAlign = "left";
}
}
We can also set a specific font and font style we’d like to use. The font property of the context object works the same way the CSS font property does. We’ll specify a font size of 18px and a comma-separated list of font families:
function drawOneFrame(video, context, canvas){
context.drawImage(video, 0, 0, canvas.width, canvas.height);
try {
…
} catch (err) {
// clear the canvas
context.clearRect(0,0,canvas.width,canvas.height);
canvas.style.backgroundColor = "transparent";
context.fillStyle = "white";
context.textAlign = "left";
context.font = "18px LeagueGothic, Tahoma, Geneva, sans-serif";
}
}
Notice that we’re using League Gothic; any fonts you’ve included with @font-face are also available for use on the canvas. Finally, we draw the text. We use a method of the context object called fillText, which takes the text to be drawn and the x,y coordinates where it should be placed. Since we want to write out a fairly long message, we’ll split it up into several sections, placing each one on the canvas separately:
function drawOneFrame(video, context, canvas){
context.drawImage(video, 0, 0, canvas.width, canvas.height);
try {
…
} catch (err) {
// clear the canvas
context.clearRect(0,0,canvas.width,canvas.height);
canvas.style.backgroundColor = "transparent";
context.fillStyle = "white";
context.textAlign = "left";
context.font = "18px LeagueGothic, Tahoma, Geneva, sans-serif";
context.fillText("There was an error rendering ", 10, 20);
context.fillText("the video to the canvas.", 10, 40);
context.fillText("Perhaps you are viewing this page from", 10, 70);
context.fillText("a file on your computer?", 10, 90);
context.fillText("Try viewing this page online instead.", 10, 130);
return false;
}
}
As a last step, we return false. This lets us check in the draw function whether an exception was thrown. If it was, we want to stop calling drawOneFrame for each video frame, so we exit the draw function:
function draw(video, context, canvas) {
if (video.paused || video.ended) return false;
drawOneFrame(video, context, canvas);
// Start over!
setTimeout(function(){ draw(video, context, canvas); }, 0);
}
Accessibility Concerns
A major downside of canvas in its current form is its lack of accessibility. The canvas doesn’t create a DOM node, is not a text-based format, and is thus essentially invisible to tools such as screen readers. For example, even though we wrote text to the canvas in our last example, that text is essentially no more than a bunch of pixels and is therefore inaccessible―it’s just like an image that contains text.
The HTML5 community is aware of these failings, and while no solution has been finalized, debates on how canvas could be changed to make it accessible are underway. You can read a compilation of the arguments and currently proposed solutions on the W3C’s wiki page.
Further Reading
To read more about canvas and the Canvas API, here are a couple of good resources:
· “HTML5 Canvas—the Basics” at Dev.Opera
· Safari’s HTML5 Canvas Guide
SVG
We mentioned SVG previously in Chapter 7. In this chapter, we’ll dive into SVG in more detail and learn how to use it in other ways.
First, a quick refresher: SVG stands for Scalable Vector Graphics, a specific file format that allows you to describe vector graphics using XML. A major selling point of vector graphics in general is that, unlike bitmap images (such as GIF, JPEG, PNG, and TIFF), vector images preserve their quality even as you blow them up or shrink them down. We can use SVG to do many of the same tasks we can do with canvas, including drawing paths, shapes, text, gradients, and patterns. There are also very useful open-source tools relevant to SVG, some of which we’ll leverage in order to add a spinning progress indicator to The HTML5 Herald’s geolocation widget.
Note: What's XML?
XML stands for eXtensible Markup Language. Like HTML, it’s a markup metalanguage. In plain English, it’s a system meant to annotate text. Just as we can use HTML tags to wrap our content and give it meaning, so can XML tags be used to describe data, such as the content of a file.
Basic SVG, including using SVG in an HTML img element, is supported in:
· Chrome 4+
· Safari 3.2+
· Firefox 3+
· Opera 9.6+
· iOS 3.2+
· Internet Explorer 9.0+
· Android browser 4.4+
Unlike canvas, images created with SVG are available via the DOM. This enables technologies such as screen readers to see what’s present in an SVG object through its DOM node, as well as allowing you to inspect SVG using your browser’s developer tools. Since SVG is an XML file format, it’s also more accessible to search engines than canvas.
Drawing in SVG
Drawing a circle in SVG is arguably easier than drawing a circle with canvas. Here’s how we do it:
<svg xmlns="http://www.w3.org/2000/svg" viewBox="0 0 400 400">
<circle cx="50" cy="50" r="25" fill="red"/>
</svg>
The viewBox attribute defines the starting location, width, and height of the SVG image.
The circle element defines a circle, with cx and cy the X and Y coordinates of the center of the circle. The radius is represented by r, while fill defines the fill style.
To view an SVG file, you simply open it via the File menu in any browser that supports SVG. Figure 12.11 shows what our circle looks like.
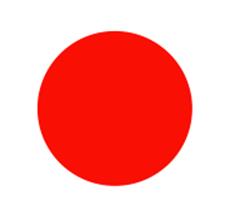
Figure 12.11. A circle drawn using SVG
We can also draw rectangles in SVG, and add a stroke to them as we did with canvas.
This time, let’s take advantage of SVG being an XML—and thus text-based—file format, and utilize the <desc> tag, which allows us to provide a description for the image we’re going to draw:
<svg xmlns="http://www.w3.org/2000/svg" viewbox="0 0 400 400">
<desc>Drawing a rectangle</desc>
</svg>
Next, we populate the <rect> tag with a number of attributes that describe the rectangle. This includes the X and Y coordinate where the rectangle should be drawn, the width and height of the rectangle, the fill, the stroke, and the width of the stroke:
<svg xmlns="http://www.w3.org/2000/svg" viewbox="0 0 400 400">
<desc>Drawing a rectangle</desc>
<rect x="10" y="10" width="100" height="100"
fill="blue" stroke="red" stroke-width="3" />
</svg>
Figure 12.12 shows what our rectangle looks like.
Figure 12.12. A rectangle drawn with SVG
Unfortunately, it’s not always this easy. If you want to create complex shapes, the code begins to look a little scary. As an example of what SVG looks like, let's examine the first few lines of a more complex image in SVG:
<svg xmlns="http://www.w3.org/2000/svg"
width="122.88545" height="114.88568">
<g
inkscape:label="Calque 1"
inkscape:groupmode="layer"
id="layer1"
transform="translate(-242.42282,-449.03699)">
<g
transform="matrix(0.72428496,0,0,0.72428496,119.87078,183.8127)"
id="g7153">
<path
style="fill:#ffffff;fill-opacity:1;stroke:#000000;stroke-width :2.761343;stroke-linecap:round;stroke-linejoin:round;stroke-miterl imit:4;stroke-opacity:1;stroke-dasharray:none;stroke-dashoffset:0"
d="m 249.28667,389.00422 -9.7738,30.15957 -31.91999,7.5995 c - 2.74681,1.46591 -5.51239,2.92436 -1.69852,6.99979 l 30.15935,12.57 796 -11.80876,32.07362 c -1.56949,4.62283 -0.21957,6.36158 4.24212 ,3.35419 l 26.59198,-24.55691 30.9576,17.75909 c 3.83318,2.65893 6 .12086,0.80055 5.36349,-3.57143 l -12.10702,-34.11764 22.72561,-13 .7066 c 2.32805,-1.03398 5.8555,-6.16054 -0.46651,-6.46042 l -33.5 0135,-0.66887 -11.69597,-27.26175 c -2.04282,-3.50583 -4.06602,-7. 22748 -7.06823,-0.1801 z"
id="path7155"
inkscape:connector-curvature="0"
sodipodi:nodetypes="cccccccccccccccc" />
…
Eek!
To save ourselves some work (and sanity), instead of creating SVG images by hand, we can use an image editor to help. One open source tool that you can use to make SVG images is Inkscape, which is available for download at http://inkscape.org/.
As we mentioned at the start of the chapter, it would be nice to add a progress indicator to our geolocation example from Chapter 11, one that lets the user know we’re still waiting for the map to load and haven’t left them stranded.
Instead of starting from scratch, we’ve searched the public domain to find a good progress-indicating spinner image from which to begin. A good resource to know about for public domain images is http://openclipart.org/, where you can find images that are free to use and free of copyright. The images have been donated by their creators for use in the public domain, even for commercial purposes, without the need for permission.
We will be using an image of three arrows as the basis of our progress spinner, shown in Figure 12.13. The original can be found at openclipart.org.
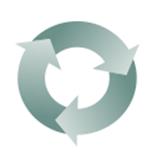
Figure 12.13. The image we’ll be using for our progress indicator
SVG Filters
To make our progress spinner match our page a bit better, we can use a filter in Inkscape to make it black and white. Start by opening the file in Inkscape, then choose Filters > Color > Moonarize.
You may notice that if you test out The HTML5 Herald in an older version of IE or Safari that our black-and-white spinner is still ... in color. That’s because SVG filters are only supported in IE10 and later, and Safari 6 and later. Here’s a complete list of SVG filter support:
· all recent versions of Chrome, Firefox, and Opera
· iOS 6.1+
· Android browser 4.4+
A safer approach would be to avoid using filters, and instead modify the color of the original image.
We can do this in Inkscape by selecting the three arrows in the spinner.svg image, and then selecting Object > Fill and Stroke. The Fill and Stroke menu will appear on the right-hand side of the screen, as seen in Figure 12.14.
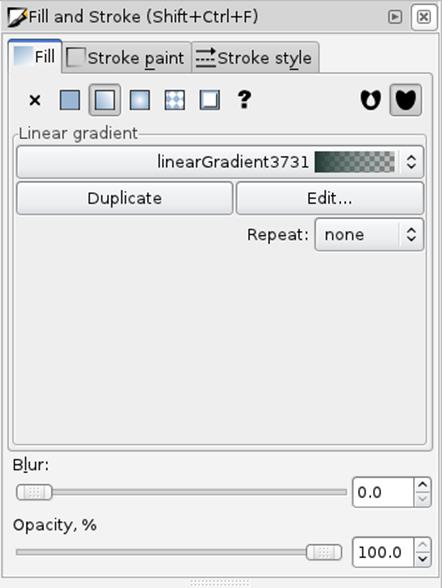
Figure 12.14. Modifying color using Fill and Stroke
From this menu, we can choose to edit the existing linear gradient by clicking the Edit button. We can then change the red, green, and blue values to 0 to make our image black and white.
We’ve saved the resulting SVG as spinnerBW.svg.
Using the Raphaël Library
Raphaël is an open-source JavaScript library that makes drawing and animating with SVG much easier.
Drawing an Image to Raphaël’s Container
Much as with canvas, you can draw images into a container that you create using Raphaël.
Let’s add a div to our main index file. We’ll use this as the container for the SVG elements that we’ll create using Raphaël. We’ve given this div the ID of spinner:
<article class="ad-ad4">
<div id="mapDiv">
<h1 id="geoHeading">Where in the world are you?</h1>
<form id="geoForm">
<input type="button" id="geobutton" value="Tell us!">
</form>
<div class="spin" id="spinner"></div>
</div>
</article>
We have styled this div to be placed in the center of the parent mapDiv using the following CSS (note that without this, the element won’t be centered):
.spin {
position: absolute;
top: 8px;
left: 55px;
}
Now in our geolocation JavaScript file, geolocation.js, let’s put the spinner in place while we’re fetching the map. The first step is to turn our div into a Raphaël container. This is as simple as calling the Raphael method, and passing in the element we’d like to use along with a width and height:
function determineLocation() {
if (navigator.onLine) {
if (Modernizr.geolocation) {
navigator.geolocation.getCurrentPosition(displayOnMap);
var container = Raphael(document.getElementById("spinner"), 125, 125);
Next, we draw the spinner SVG image into the newly created container with the Raphaël method image, which is called on a Raphaël container object. This method takes the path to the image, the starting coordinates where the image should be drawn, and the width and height of the image:
var container = Raphael(document.getElementById("spinner"), 125, 125);
var spinner = container.image("images/spinnerBW.svg", 0, 0, 125, 125);
With this code our spinner image will appear once the geolocation code begins to run, and will spin until the map is displayed.
Rotating a Spinner with Raphaël
Now that we have our container and the spinner SVG image drawn into it, we want to animate the image to make it spin. Raphaël has animation features built in with the animate method. Before we can use this method, though, we first need to tell it which attribute to animate. Since we want to rotate our image, we’ll create an object that specifies how many degrees of rotation we want.
We create a new object attrsToAnimate specifying that we want to animate the rotation, and we want to rotate by 720 degrees (two full turns). The way we do that is to set the value of the transform property to "r720", with the "r" indicating the transform is a rotation:
var container = Raphael(document.getElementById("spinner"),125,125);
var spinner = container.image("images/spinnerBW.png",0,0,125,125);
var attrsToAnimate = { transform: "r720" };
The final step is to call the animate method, and specify how long the animation should last. In our case, we’ll let it run for a maximum of 60 seconds. Since animate takes its values in milliseconds, we’ll pass it 60000:
var container = Raphael(document.getElementById("spinner"),125,125);
var spinner = container.image("images/spinnerBW.png",0,0,125,125);
var attrsToAnimate = { transform: "r720" };
spinner.animate(attrsToAnimate, 60000);
That’s great! We now have a spinning progress indicator to keep our visitors in the know while our map is loading. There’s still one problem, though: it remains after the map has loaded. We can fix this by adding one line to the beginning of the existing displayOnMap function:
function displayOnMap(position) {
document.getElementById("spinner").style.display = "none";
}
This line sets the display property of the spinner element to none, effectively hiding the spinner div and the SVG image we’ve loaded into it.
Canvas versus SVG
Now that we’ve learned about canvas and SVG, you may be asking yourself which is the right one to use? The answer is: it depends on what you’re doing.
Both canvas and SVG allow you to draw custom shapes, paths, and fonts. But what’s unique about each?
Canvas allows for pixel manipulation, as we saw when we turned our video from color to black and white. One downside of canvas is that it operates in what’s known as immediate mode. This means that if you ever want to add more to the canvas, you’re unable to simply add to what’s already there. Every time you finish drawing a shape, the canvas no longer has access to that shape, because it won’t persist as an object that you can modify. So if you want to add to what you’ve already drawn on the canvas, you must redraw the new shape from scratch. Still, canvas does allow you to save the images you create to a PNG or JPEG file.
There’s also no access to what’s drawn on the canvas via the DOM. Because of this, canvas is much faster than SVG (here’s one speed comparison), and canvas is generally the better choice if you’re looking to design a game requiring lots of animations.
By contrast, what you draw to SVG is accessible via the DOM, because its mode is retained mode, meaning that the structure of the image is preserved in the XML document that describes it. SVG also has, at this time, a more complete set of tools to help you work with it, such as the Raphaël library and Inkscape. However, since SVG is a file format—rather than a set of methods that allows you to dynamically draw on a surface—you can’t manipulate SVG images the way you can manipulate pixels on canvas. It would have been impossible, for example, to use SVG to convert our color video to black and white as we did with canvas.
In summary, if you need to paint pixels to the screen and have no concerns about the ability to retrieve and modify your shapes, canvas is probably the better choice. If, on the other hand, you need to be able to access and change specific aspects of your graphics, SVG might be more appropriate.
Drag and Drop
We’ve spent quite a bit of time this chapter focusing on drawing with code. Let’s shift gears a little now and look at an API we can use to add some fun user interaction to our website, the Drag and Drop API. This API allows us to specify that certain elements are draggable, and then specify what should happen when these draggable elements are dragged over or dropped onto other elements on the page.
Drag and Drop is supported in:
· All recent versions of Chrome, Firefox, and Safari
· Partial support in Internet Explorer 7.0+ (IE10 doesn’t allow setting the drag image, but supports all other features)
· Opera 12+
The API is unsupported by Android. It is also unsupported by design in iOS, as Apple directs you to use the DOM Touch API instead.
There are two major kinds of functionality you can implement with Drag and Drop: dragging files from your computer into a web page—in combination with the File API—or dragging elements into other elements on the same page. In this chapter, we’ll focus on the latter.
Note: Using Drag and Drop with the File API
If you’d like to learn more about how to combine Drag and Drop with the File API in order to let users drag files from their desktop onto your websites, an excellent guide can be found at the Mozilla Developer Network. All modern browsers support the File API.
There are several steps to adding drag and drop to your page:
1. Set the draggable attribute on any HTML elements you’d like to be draggable.
2. Add an event listener for the dragstart event on any draggable HTML elements.
3. Add an event listener for the dragover and drop events on any elements that you want to have accept dropped items.
Feeding the WAI-ARIA Cat
In order to add a bit of fun and frivolity to our page, let’s add a few images of mice so that we can drag them onto our cat image and watch the cat react and devour them. Before you start worrying (or call the Society for the Prevention of Cruelty to Animals), rest assured that we mean computer mice, of course. We’ll use another image from OpenClipArt for our mice.
The first step is to add these new images to our index.html file. We’ll give each mouse image an ID as well:
<article id="ac3">
<h1>Wai-Aria? HAHA!</h1>
<h2>Form Accessibility</h2>
<img src="images/cat.png" alt="WAI-ARIA Cat">
<div class="content">
<p id="mouseContainer" class="mc">
<img src="images/computer-mouse-pic.svg" alt="mouse treat" id="mouse1" draggable="true">
<img src="images/computer-mouse-pic.svg" alt="mouse treat" id="mouse2" draggable="true">
<img src="images/computer-mouse-pic.svg" alt="mouse treat" id="mouse3" draggable="true">
</p>
…
We style the "mouseContainer" div to have its text center aligned (assuming drag and drop is supported, which is what the .draganddrop class is checking for):
.draganddrop .mc {
text-align: center;
}
Figure 12.15 shows our images in their initial state.
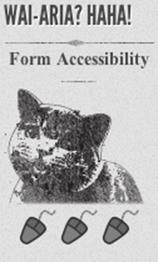
Figure 12.15. Three little mice, ready to be fed to the WAI-ARIA cat
Making Elements Draggable
The next step is to make our images draggable. In order to do that, we add the draggable attribute to them, and set the value to true:
<img src="images/computer-mouse-pic.svg" width="30" alt="mouse treat" id="mouse1" draggable="true">
<img src="images/computer-mouse-pic.svg" width="30" alt="mouse treat" id="mouse2" draggable="true">
<img src="images/computer-mouse-pic.svg" width="30" alt="mouse treat" id="mouse3" draggable="true">
Important: draggable is not Boolean!
Note that draggable is not a Boolean attribute, so you have to explicitly set it to true.
Now that we have set draggable to true, we have to set an event listener for the dragstart event on each image. We’ll have to do this for all three of our img elements that contain the computer mouse images. So we begin by using querySelectorAll to grab all the img elements whose parent element has the ID set to mouseContainer:
var mice = document.querySelectorAll("#mouseContainer img");
Next, we’ll loop through all the img elements contained in the mice variable, and add an event listener for the dragstart event on each computer mouse:
var mouse = null;
for (var i=0; i < mice.length; i++) {
mouse = mice[i];
mouse.addEventListener('dragstart', function (event) {
// handle the dragstart event
});
}
The DataTransfer Object
DataTransfer objects are one type of object outlined in the Drag and Drop API. These objects allow us to set and get data about the elements that are being dragged. Specifically, DataTransfer lets us define two pieces of information:
· the type of data we’re saving of the draggable element
· the value of the data itself
In the case of our draggable mouse images, we want to be able to store the ID of these images so that we know which image is being dragged around.
To do this, we first tell DataTransfer that we want to save some plain text by passing in the string text/plain. Then we give it the ID of our mouse image:
mouse.addEventListener("dragstart", function (event) {
event.dataTransfer.setData("text/plain", this.id);
});
When an element is dragged, we save the ID of the element in the DataTransfer object, to be used again once the element is dropped.
Accepting Dropped Elements
Now our mouse images are set up to be dragged. Yet, when we try to drag them around, we’re unable to drop them anywhere—which is no fun.
The reason is that by default, elements on the page aren’t set up to receive dragged items. In order to override the default behavior on a specific element, we must stop it from happening. We can do that by creating two more event listeners.
The two events we need to monitor for are dragover and drop. As you’d expect, dragover fires when you drag an item over an element, and drop fires when you drop an item on it.
We’ll need to prevent the default behavior for both these events, since the default prohibits you from dropping an element.
Let’s start by adding an ID to our cat image so that we can bind event handlers to it:
<article id="ac3">
<h1>Wai-Aria? HAHA!</h1>
<h2 id="catHeading">Form Accessibility</h2>
<img src="images/cat.png" id="cat" alt="WAI-ARIA Cat">
You may have noticed that we also gave an ID to the h2 element. This is so we can change this text once we’ve dropped a mouse onto the cat.
Now let’s handle the dragover event:
var cat = document.getElementById("cat");
cat.addEventListener("dragover", function(event) {
event.preventDefault();
});
That was easy! In this case, we merely ensured that the mouse picture can actually be dragged over the cat picture. We simply need to prevent the default behavior, and JavaScript’s preventDefault method serves this purpose exactly.
The code for the drop handler is a bit more complex, so let us review it piece by piece. Our first task is to figure out what the cat should say when a mouse is dropped on it. In order to demonstrate that we can retrieve the ID of the dropped mouse from the DataTransfer object, we’ll use a different phrase for each mouse, regardless of the order in which they’re dropped. We’ve given three cat-appropriate options: “MEOW!”, “Purrr ...”, and “NOMNOMNOM.”
We’ll store these options inside an object called mouseHash, where the first step is to declare our object:
cat.addEventListener("drop", function(event) {
var mouseHash = {};
Next, we’re going to take advantage of JavaScript’s objects allowing us to store key/value pairs inside them, as well as storing each response in the mouseHash object, associating each response with the ID of one of the mouse images:
cat.addEventListener("drop", function(event) {
var mouseHash = {
mouse1: 'NOMNOMNOM',
mouse2: 'Meow',
mouse3: 'Purrrrrr ...'
};
}
Our next step is to grab the h2 element that we’ll change to reflect the cat’s response:
var catHeading = document.getElementById('catHeading');
Remember when we saved the ID of the dragged element to the DataTransfer object using setData? Well, now we want to retrieve that ID. If you guessed that we’ll need a method called getData for this, you guessed right:
var mouseID = event.originalEvent.dataTransfer.getData("text/plain");
Note that we’ve stored the mouse’s ID in a variable called mouseID. Now that we know which mouse was dropped, and we have our heading, we just need to change the text to the appropriate response:
catHeading.innerHTML = mouseHash[mouseID];
We use the information stored in the item variable (the dragged mouse’s ID) to retrieve the correct message for the h2 element. For example, if the dragged mouse is mouse1, calling mouseHash[item] will retrieve “NOMNOMNOM” and set that as the h2 element’s text.
Given that the mouse has now been “eaten,” it makes sense to remove it from the page:
var mousey = document.getElementById(item);
mousey.parentNode.removeChild(mousey);
Last but not least, we must also prevent the default behavior of not allowing elements to be dropped on our cat image, as we did before:
event.preventDefault();
Figure 12.16 shows our happy cat, with one mouse to go.
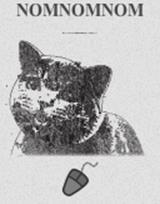
Figure 12.16. This cat’s already consumed two mice
Further Reading
We’ve only touched on the basics of the Drag and Drop API, in order to give you a taste of what’s available. We’ve shown you how you can use DataTransfer to pass data from your dragged items to their drop targets. What you do with this power is up to you.
To learn more about the Drag and Drop API, here are a couple of good resources
· Mozilla Developer Network’s Drag and Drop documentation
· W3C’s Drag and Drop specification
That’s All, Folks!
With these final bits of interactivity, our work on The HTML5 Herald has come to an end, and your journey into the world of HTML5 and CSS3 is well on its way! We’ve tried to provide a solid foundation of knowledge about as many of the cool new features available in today’s browsers as possible, but how you build on that is up to you.
We hope we’ve given you a clear picture of how most of these features can be used today on real projects. Many are already well supported, and browser development is once again progressing at a rapid clip. And when it comes to those elements for which support is still lacking, you have the aid of an online army of ingenious developers. These community-minded individuals are constantly working at creating fallbacks and polyfills to help us push forward and build the next generation of websites and applications.
Get to it!
[17] Half of the canvas’s dimensions minus half of the image’s dimensions: (200/2) - (64/2) = 68.